The ASX-200 has retraced to a significant potential weekly-chart support level and so I thought the Index warranted a deeper review and a post of its own. I say potential because this support level held back in the 1987 and Global Financial Crisis (GFC) pullbacks. There is no guarantee that it will hold this time around but, in my opinion, this is a level worth noting and monitoring. Here is how I’m seeing the index and what I’ll be looking for in sessions to come.
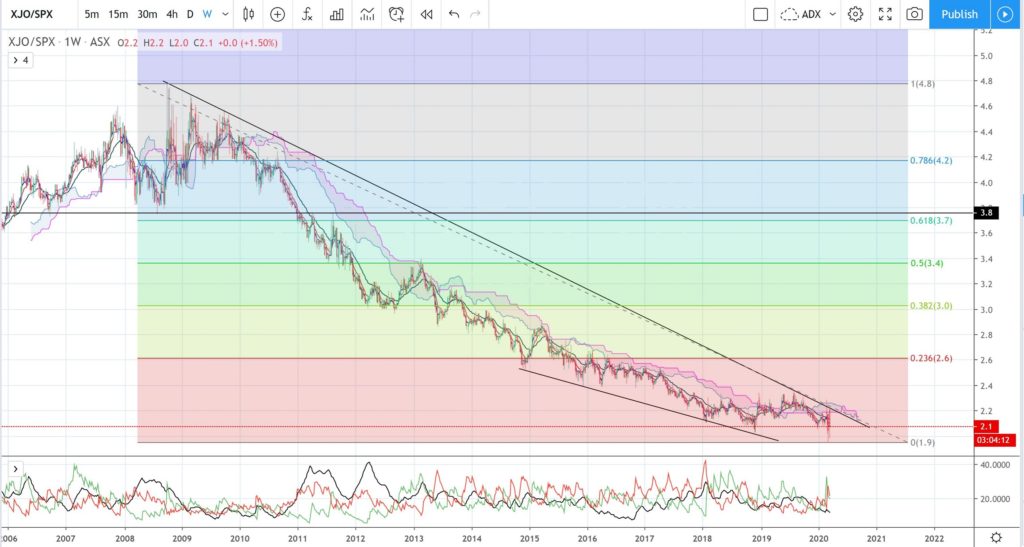
Before I review individual charts of the ASX-200 / XJO index I want to show a chart that has held my interest for the last couple of months. This is a chart of the XJO versus the S&P500. The chart shows a steady decline meaning that the XJO has under-performed compared to the S&P500 and this has generated a Descending Wedge chart pattern:
XJO/SPX weekly: note the descending wedge formation:
Descending wedges are bullish-reversal chart patterns and I had Tweeted back in early March, before Covid-19 was part of our vernacular, wondering what, if anything, could trigger a bullish breakout here. This would mean that the XJO would have to start to out perform the S&P500! Covid-19 has been a major change here though and I wonder whether the Australian stock market and economy might be able to recover more quickly than the market and economy in the USA? This is certainly not a prediction; more of a conundrum I ponder but given China is Australia’s largest trading partner and, by some accounts, is starting a post-Covid-19 recovery this could well evolve. This link contains an animation of air pollution over China and, whilst the levels declined during the January and February 2020 Chinese peak of Covid-19 infections, pollution levels are now back on the incline reflecting some kind of return to business across China. This augers well for the Australian economy when the worst of Covid-19 is finally behind the country.
It is hard to imagine a period where the ASX-200 could outperform the S&P500, but, these are definitely most unusual times!
Keep this conundrum in mind as you read through the analysis and view the following charts of the ASX-200.
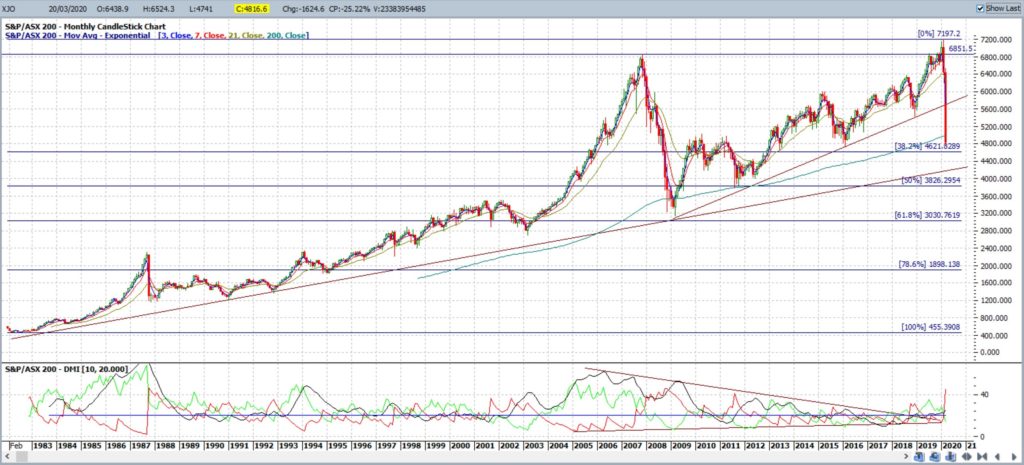
ASX-200 / XJO monthly: the monthly candle has yet to close but is currently printing a very large bearish candle with a Low that comes in below the 11-year swing High move of 2009-2020.
My data on this software only goes back to 1983 but the trend since that time has been UP and there is a monthly support trend line in place.
NB: The ASX-200 index evolved in 2000 out of the previous All Ordinaries index.
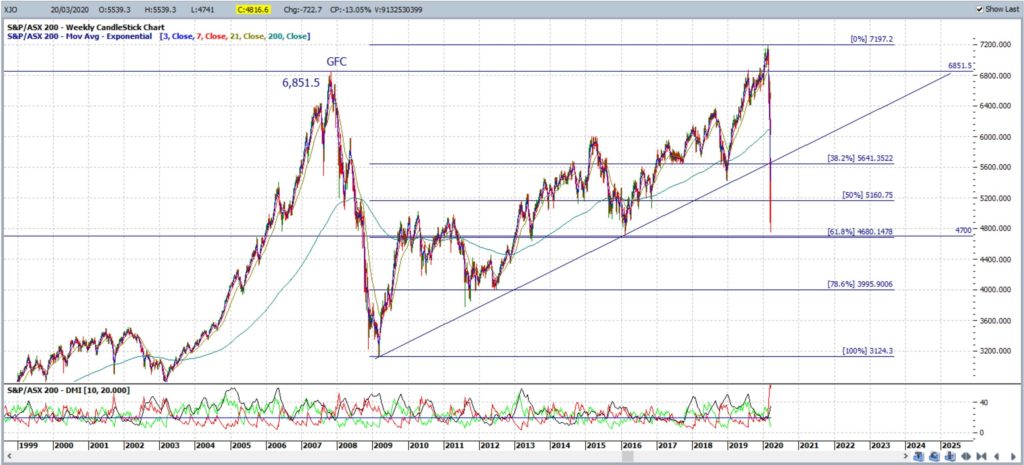
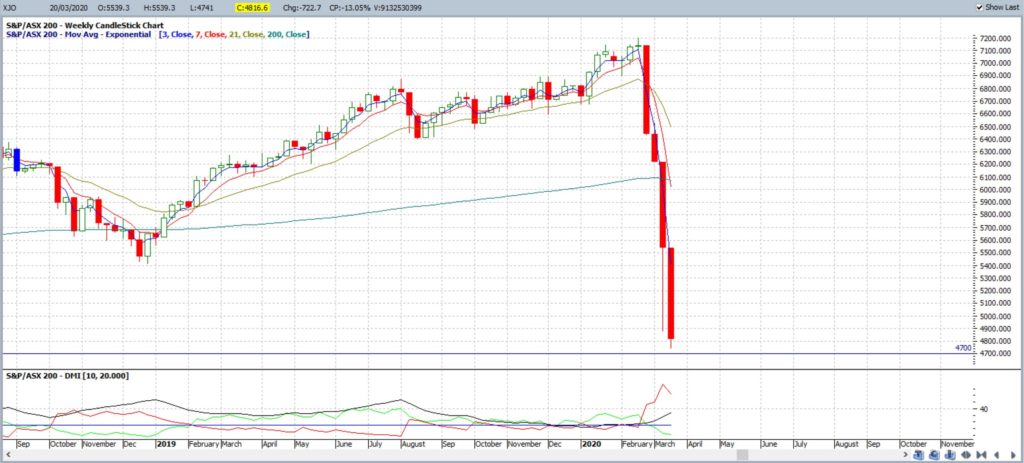
ASX-200 / XJO weekly: The ASX-200 closed with another large, bearish weekly candle and down near the key 4,700 level; being the 61.8% Fibonacci retracement level of the 2009-2020 swing High move. The 61.8% Fibonacci level is a major level in technical analysis and you can read more about the impact of this major S/R region here and here.
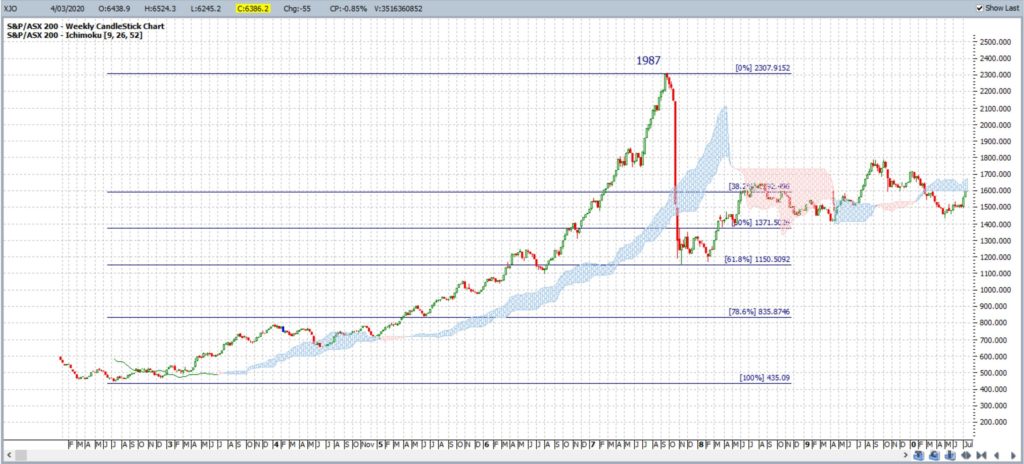
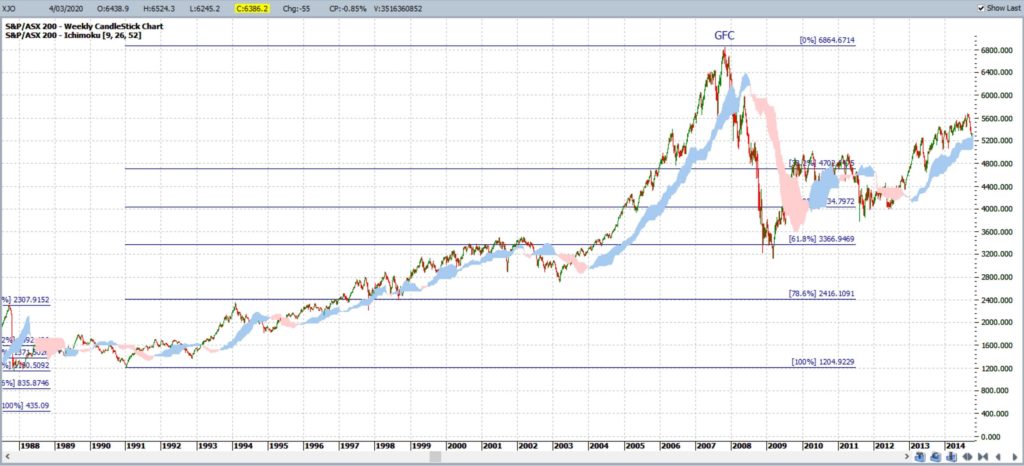
This 4,700 / 4,600 is therefore a major potential support zone for the index as this 61.8% fib offered support during the 1987 and the GFC pullbacks as the following two charts reveal:
ASX-200 weekly at the 1987 pullback: note the pullback to the weekly 61.8% Fib level region:
ASX-200 weekly at the GFC pullback: note the pullback to the weekly 61.8% Fib level region:
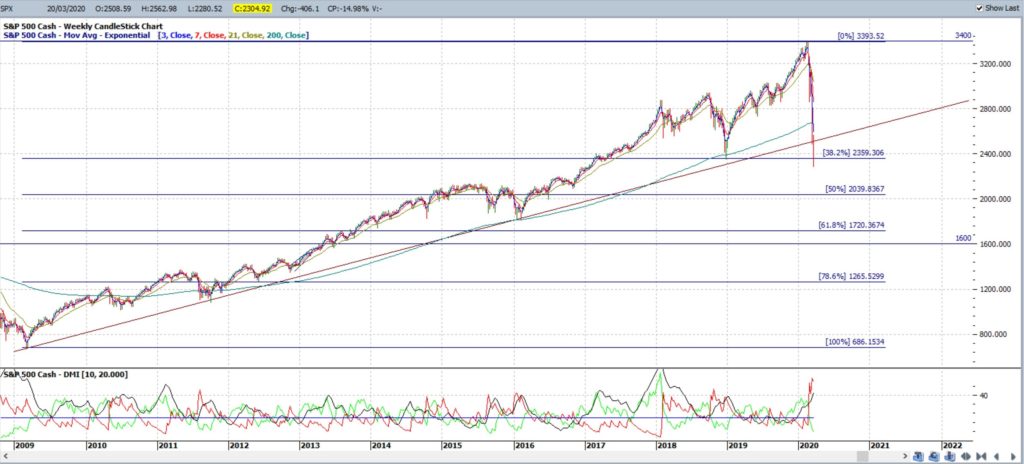
By contrast, the S&P500 has only retraced about 40% from the same 2009-2020 swing High move with the current Covid-19 pullback so this index may have some retracement ahead:
S&P500 weekly: about 40% retracement of 2009-2020 swing High:
Will the 61.8% Fibonacci level hold for the ASX-200 this time though? No one can know for sure but I would expect to see a possible pause or some consolidation here, unless the Covid-19 situation takes a drastic turn for the worse. There are some Economists suggesting the Covid-19 situation is far worse that the GFC and to expect a much more severe market pullback. That may well evolve but I would still urge traders to monitor this 4,700 / 4,600 region for any possible reaction by way of pause or consolidation before the next major move.
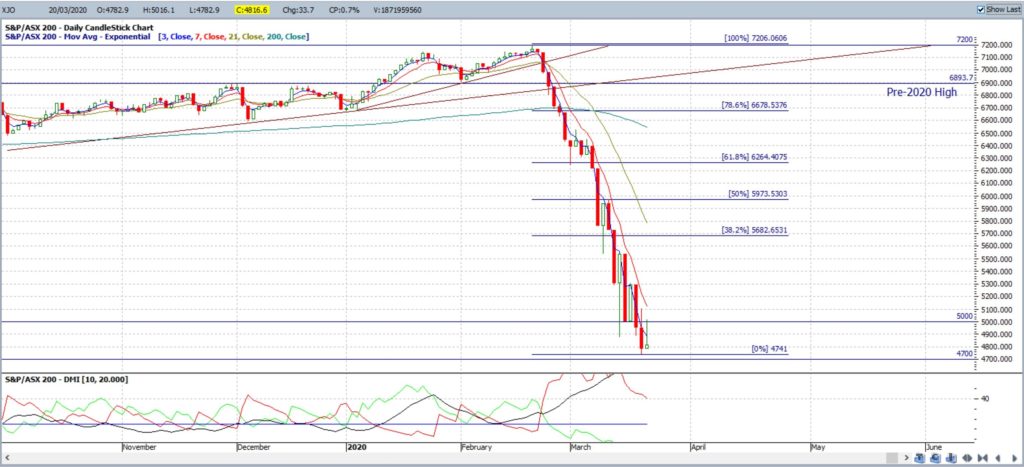
ASX-200 / XJO daily:
It is worth noting that Friday’s daily candle closed as a bullish-reversal Inverted Hammer so watch for any reaction at this 4,700 level. However, the 4,700 and 4,600 levels have not actually been ‘touched’ yet so there could be a bit more weakness to come, even if these levels eventually do hold.
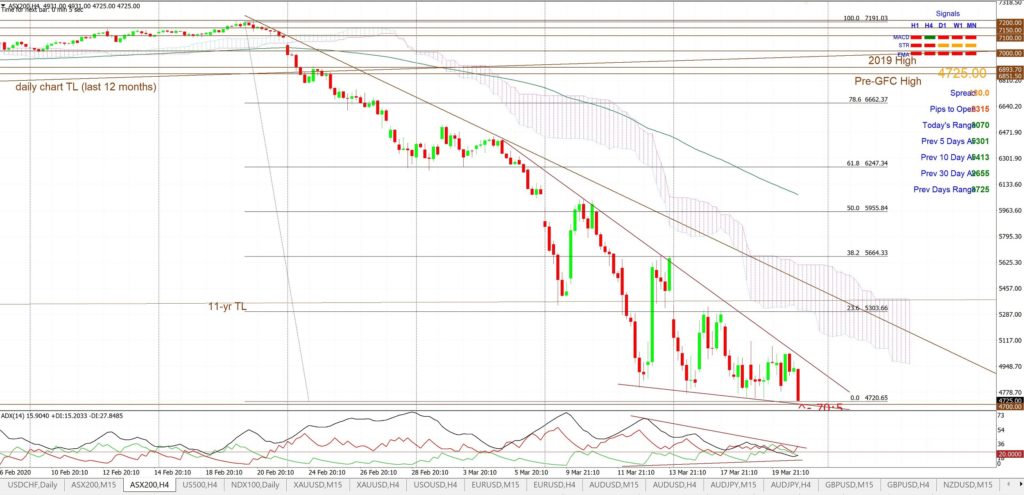
ASX-200 / XJO 4hr: It is rather interesting to see that the 4hr chart reveals a bit of a bullish-reversal Descending wedge shaping up so watch trend lines for any new momentum based breakout: up or down!
Bullish targets: Any bullish 4hr chart wedge breakout will bring the recently broken 11-yr trend line into focus followed by 4hr chart’s 61.8% fib level, near 6,250.
Bearish targets: Any bearish 4hr chart wedge breakout below 4,700 would bring 4,600 and whole-number levels on the way down to 4,000 S/R into focus.
- Watch for any 4hr chart wedge breakout:
Summary: Covid-19 has been a trigger for stock market pullbacks around the globe. The ASX-200 index has retraced near to a major 61.8% Fibonacci support region and traders should watch this region for any potential pause or consolidation before the next major market move: whether that be up or down! Technical patterns on the daily and 4hr charts both reflect some bullish-reversal potential so keep an open mind.


