


ADX: Average Directional Index
The ADX indicator is one of my preferred technical indicators and I recently gave a presentation on the ADX at the Sydney branch of the ATAA. This article is a slightly fleshed out version of my PowerPoint from that presentation and may be of interest to other traders curious about the ADX indicator.
My interest in the ADX was triggered after I purchased my first trading software package. One of the support videos for this package made reference to the ADX indicator and also to Dr Charles B Schaap’s book, ADXcellence; a text that I found very helpful. I would urge any trader who is interested in learning more about the ADX to read Dr Schaap’s book. This article is for educational purposes only.
1 ADX: origin:
- Average Directional Index: ADX.
- Developed by J. Welles Wilder, Jnr in the late 1970s.
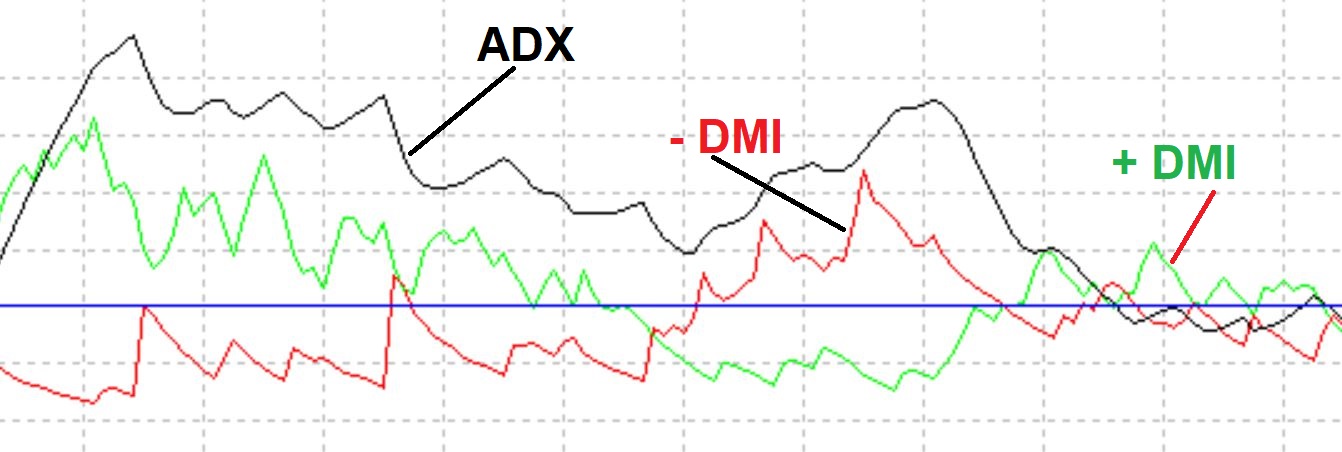
- The ADX indicator is generally made up of three components:
- ADX
- +DMI (bullish Directional Movement Indicator)
- –DMI (bearish Directional Movement Indicator)
2 What the ADX shows:
- ADX: gives measure of trend strength.
- ADX: Oscilates between 0 and 100.
- The +/- DMI: gives measure of trend direction.
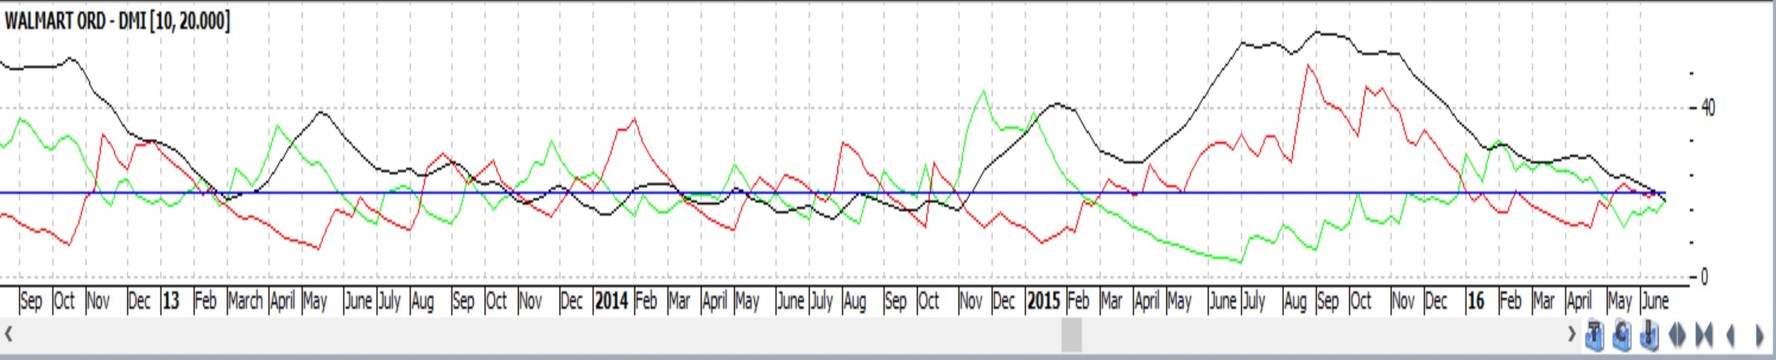
- For my charts I use the following colours: +DMI is green and -DMI is red
3 Calculation of ADX:
Step 1: The first step is to calculate the +/- DMI:
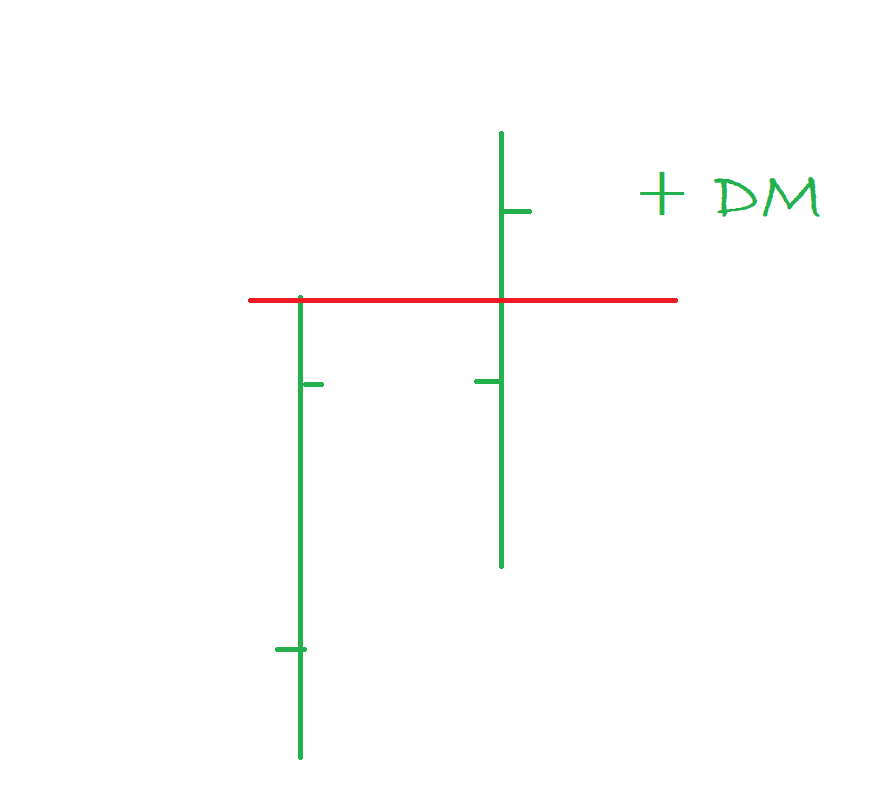
Calculating +Directional Movement Indicator:
- + DM : when price moves higher and beyond the range of the previous day (see screen shot below).
- + DM is divided by range for the day.
- + DM : averaged over 14 days and multiplied by 100.
- The result is +DMI.
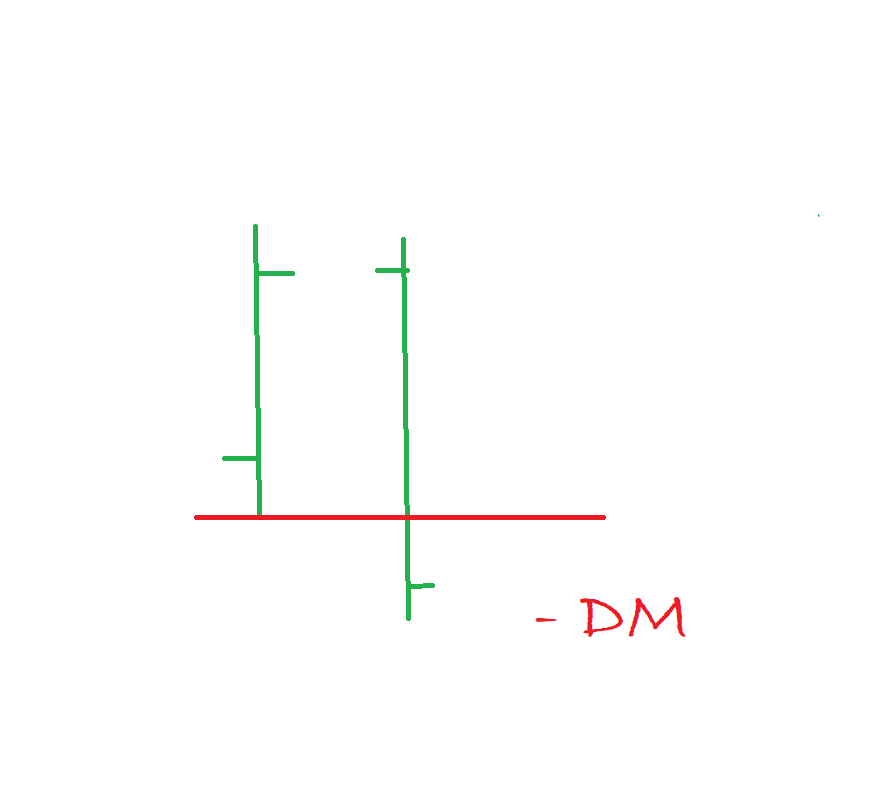
Calculating – Directional Movement Indicator:
- -DM : when price moves lower and beyond the range of the previous day (see screen shot below).
- – DM is divided by range for the day.
- – DM : averaged over 14 days and multiplied by 100.
- The result is -DMI.
Step 2: Calculate ADX from DMIs
- + DMI and – DMI are subtracted.
- This value is divided by the sum of +DMI and –DMI.
- This value is multiplied by 100 to give ADX.
4 Using the ADX:
- ADX gives a measure of overall trend strength:
- High ADX: results when +DMI and –DMI are far apart. Strong Trend.
- Low ADX: results when +DMI and –DMI are close. Weak / no trend.
- ADX trend threshold: Most traders use a threshold of either 20, 25 or 30. I use a threshold of 20:
- > 20 : markets are trending and
- < 20: markets not trending (consolidating).
- ADX itself is non-directional: you need to look at the DMIs to determine whether the trend is bullish or bearish.
5 An example of how the ADX can be used in trading:
There are many different ways that the ADX can be used by traders to assist them with their trading analysis and trading decisions. It is best for individuals to have some practice using the ADX and to develop their own trading regime. One example is offered below for purely illustrative purposes as part of this educational article. Many other sample strategies are offered by Dr Charles Schaap in his book; ADXcellence.
A Sample ADX trading strategy:
LONG Trades:
- ADX and +DMI >20.
- Price above the 21 EMA.
SHORT trades:
- ADX and -DMI > 20.
- Price below the 21 EMA.
If this sample trading strategy was applied to Apple (AAPL) then the following blocks of trades would have been possible to capture; the potential gain on each trade is labelled above the block.
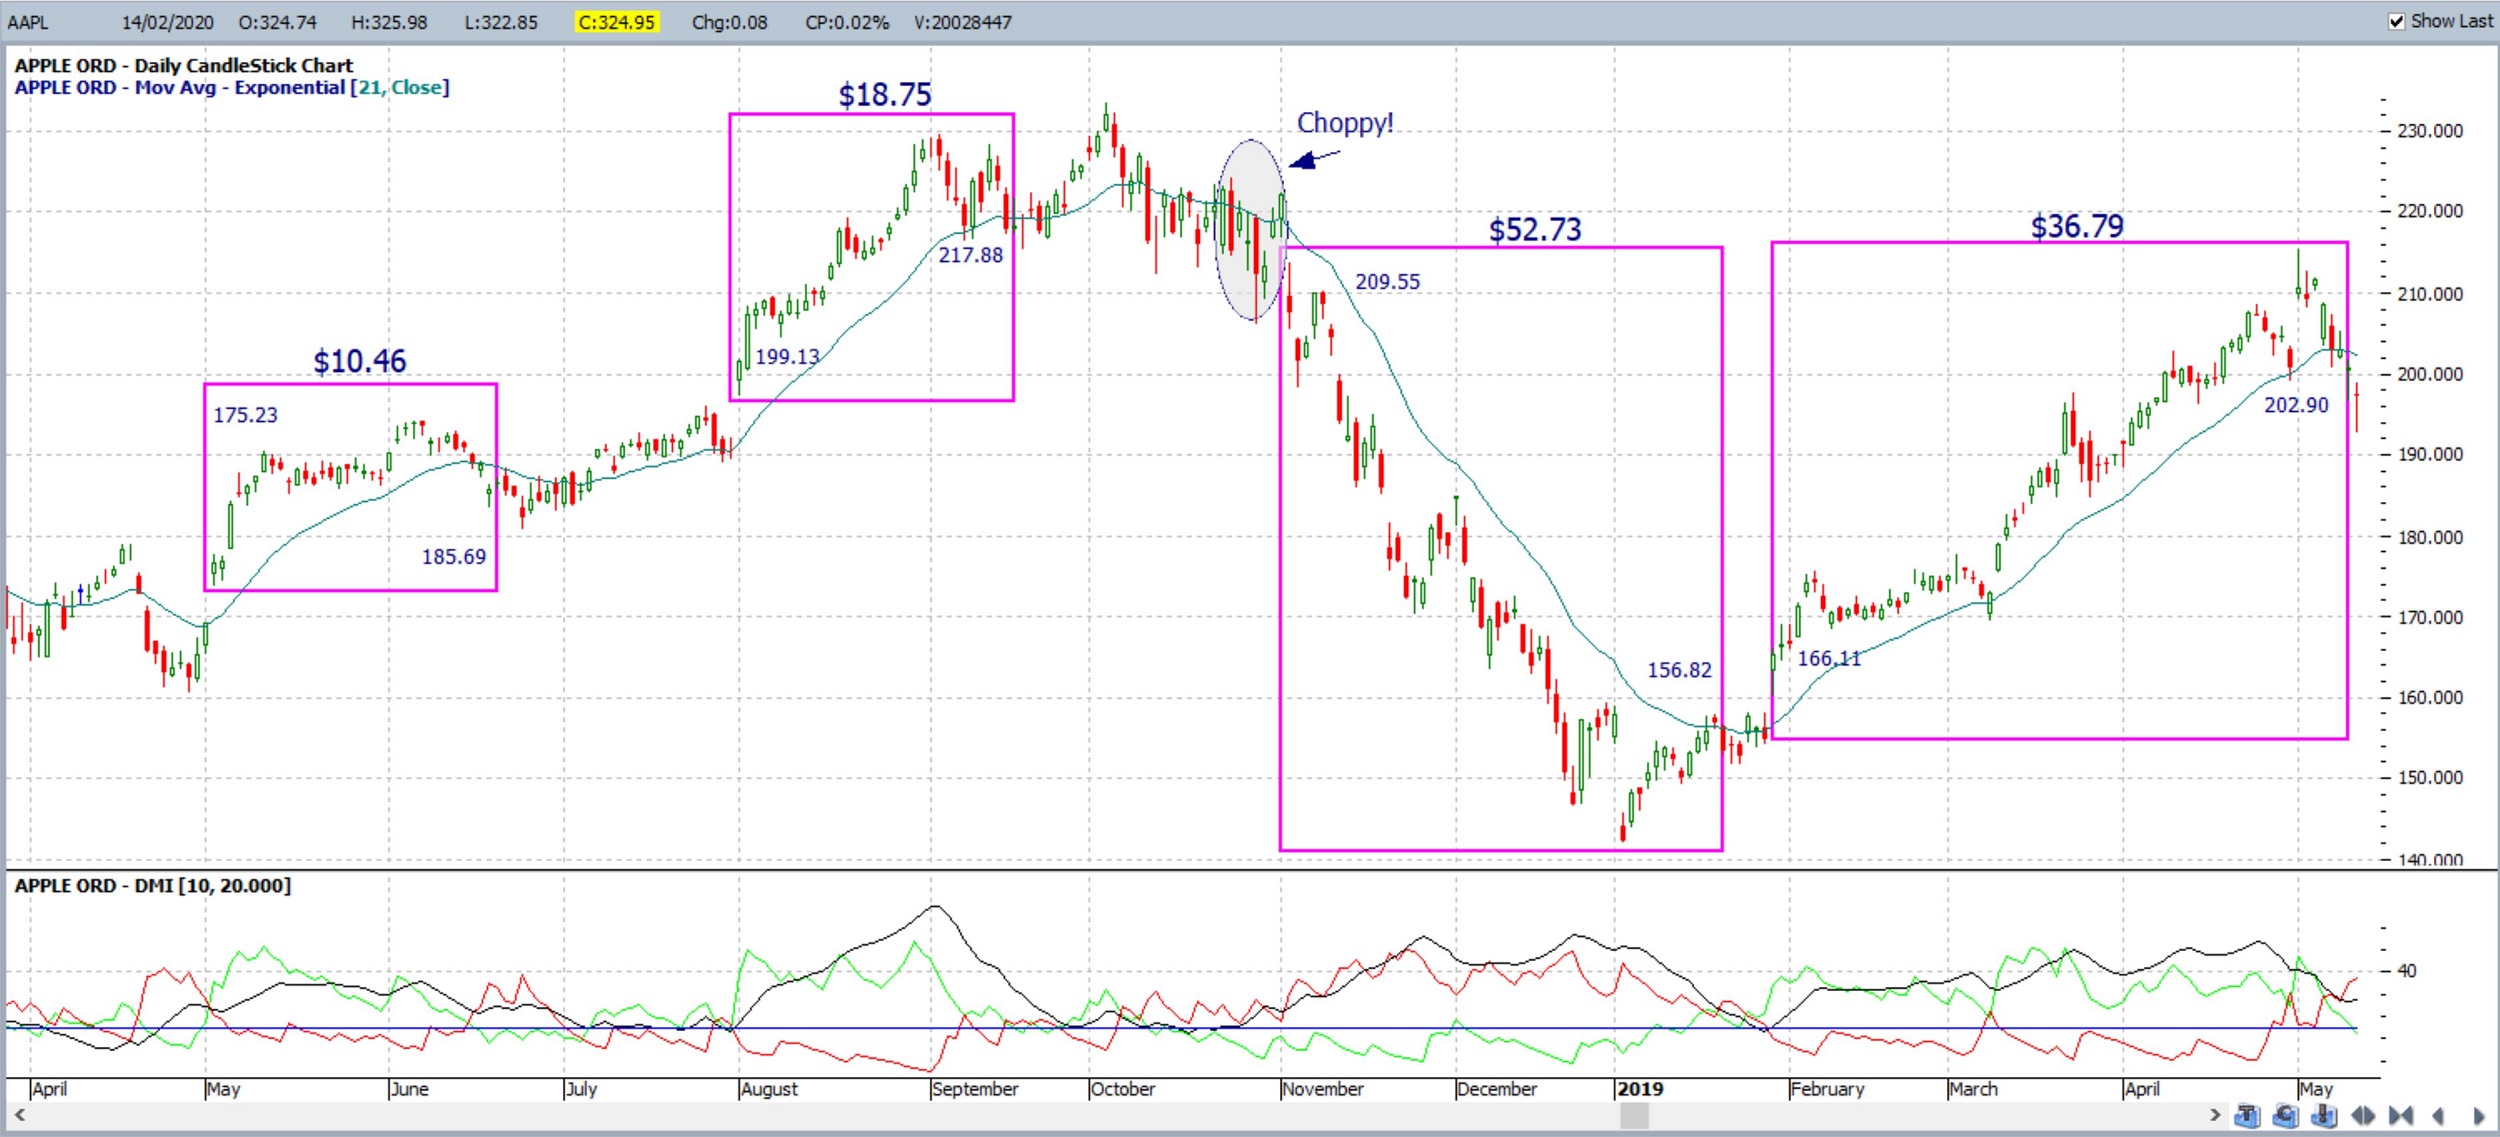
This sample system, like all systems, is not perfect and I have circled just one region to highlight where losing trades would have resulted. As with all trading though, it is not so much the system BUT how the trader manages the trades. Losing trades need to be cut quickly to keep losses small and winning trades should be let run to maximize profits. Traders should only ever trade with funds that are surplus to need and that they can afford to lose and I suggest a maximum risk per trade at around 1 or 2%.
References:
- ADXcellence: Dr Charles B. Schaap.
- New Concepts in Technical Trading Systems: J. Welles Wilder, Jnr.
Any Questions? Please email mary@tradecharting.com