


The Bull Flag is, as its name suggests, a bullish continuation pattern. Bull Flags generally evolve after a lengthy rally and mark a period of consolidation following the bullish run. They are so named as the lengthy rally appears like a Flag pole and the the consolidation phase appears like a Flag.
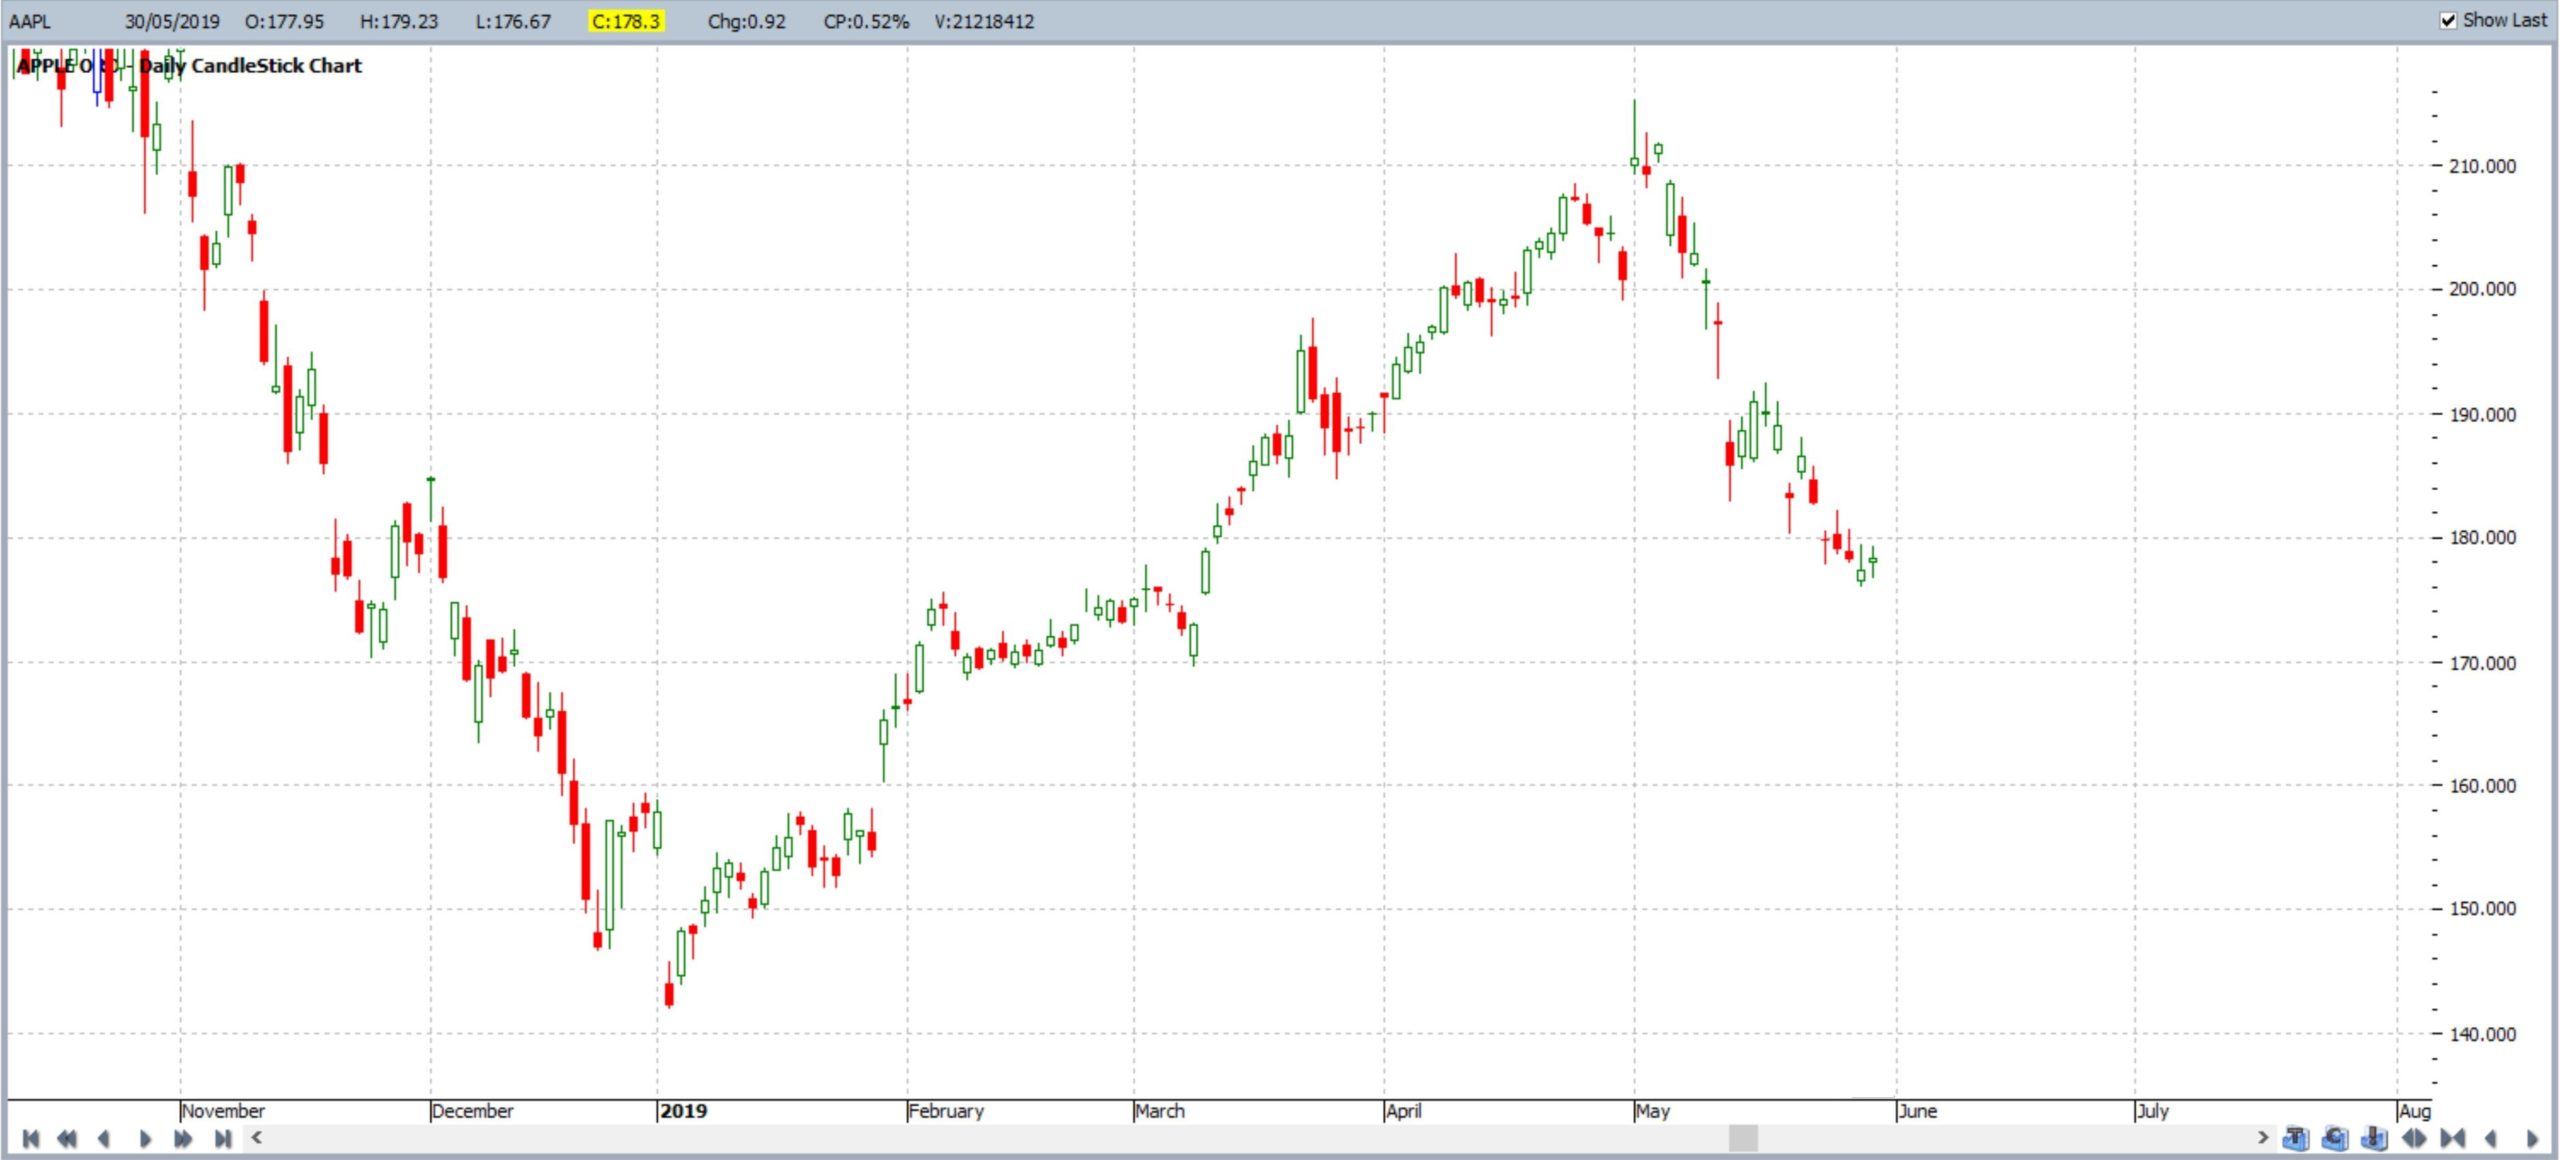
The Bull Flag example below uses the 2019 Bull Flag pattern from Apple (AAPL).
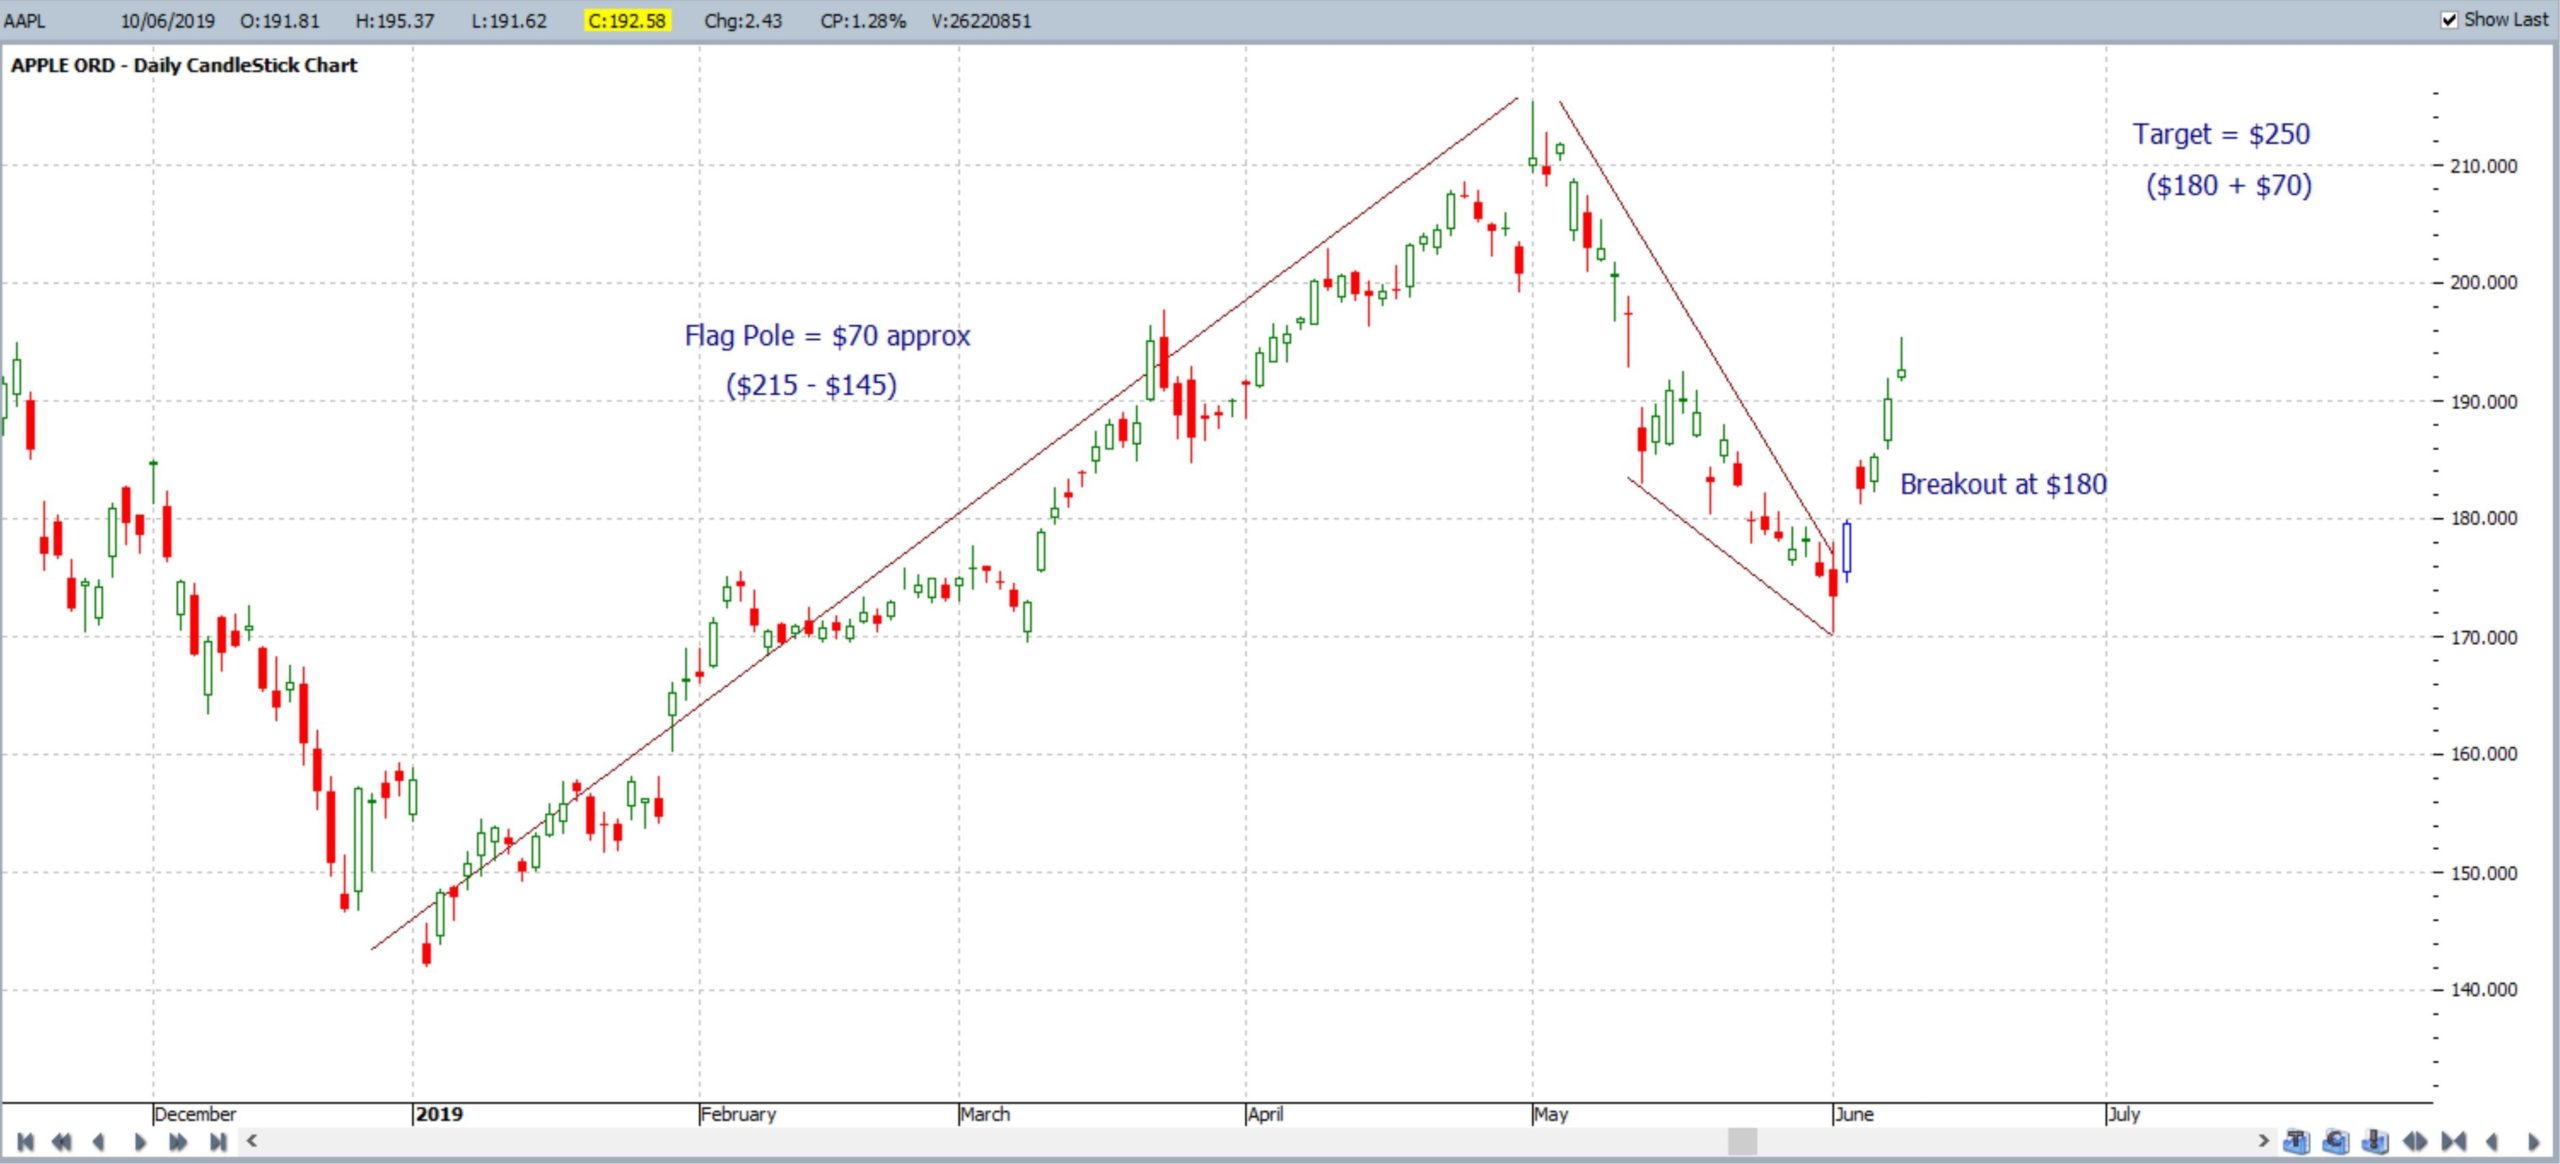
AAPL daily: Apple rallied roughly from around $145 to $215 during the first half of 2019. Price action then pulled back to consolidate in what evolved to look like a Bull Flag:
AAPL daily: this chart shows the Bull Flag style appearance.
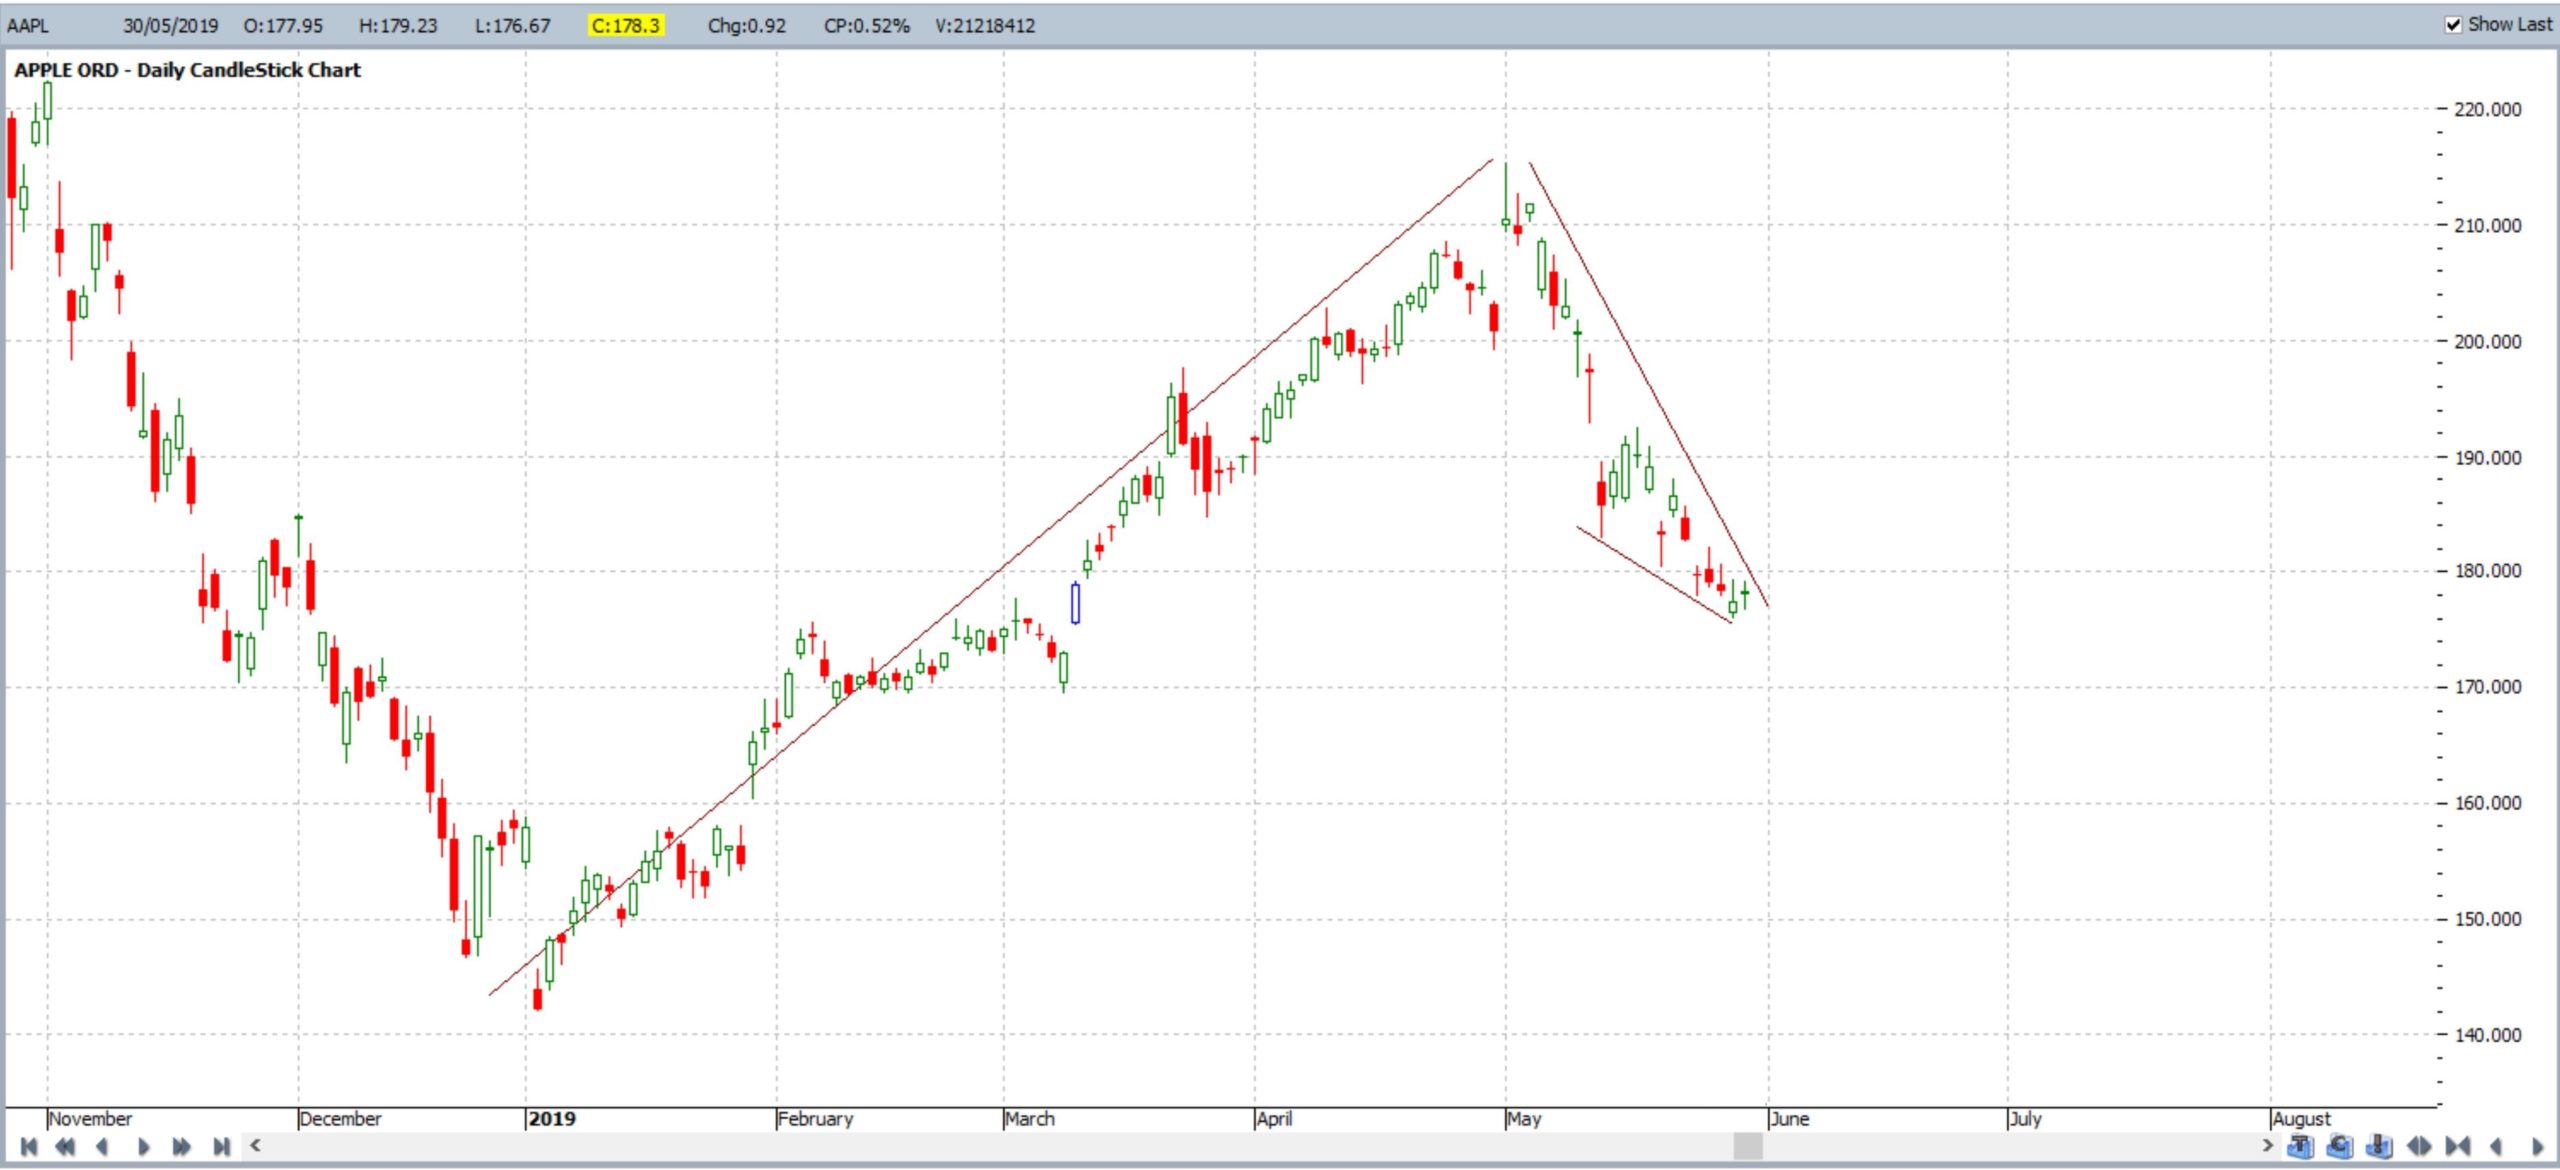
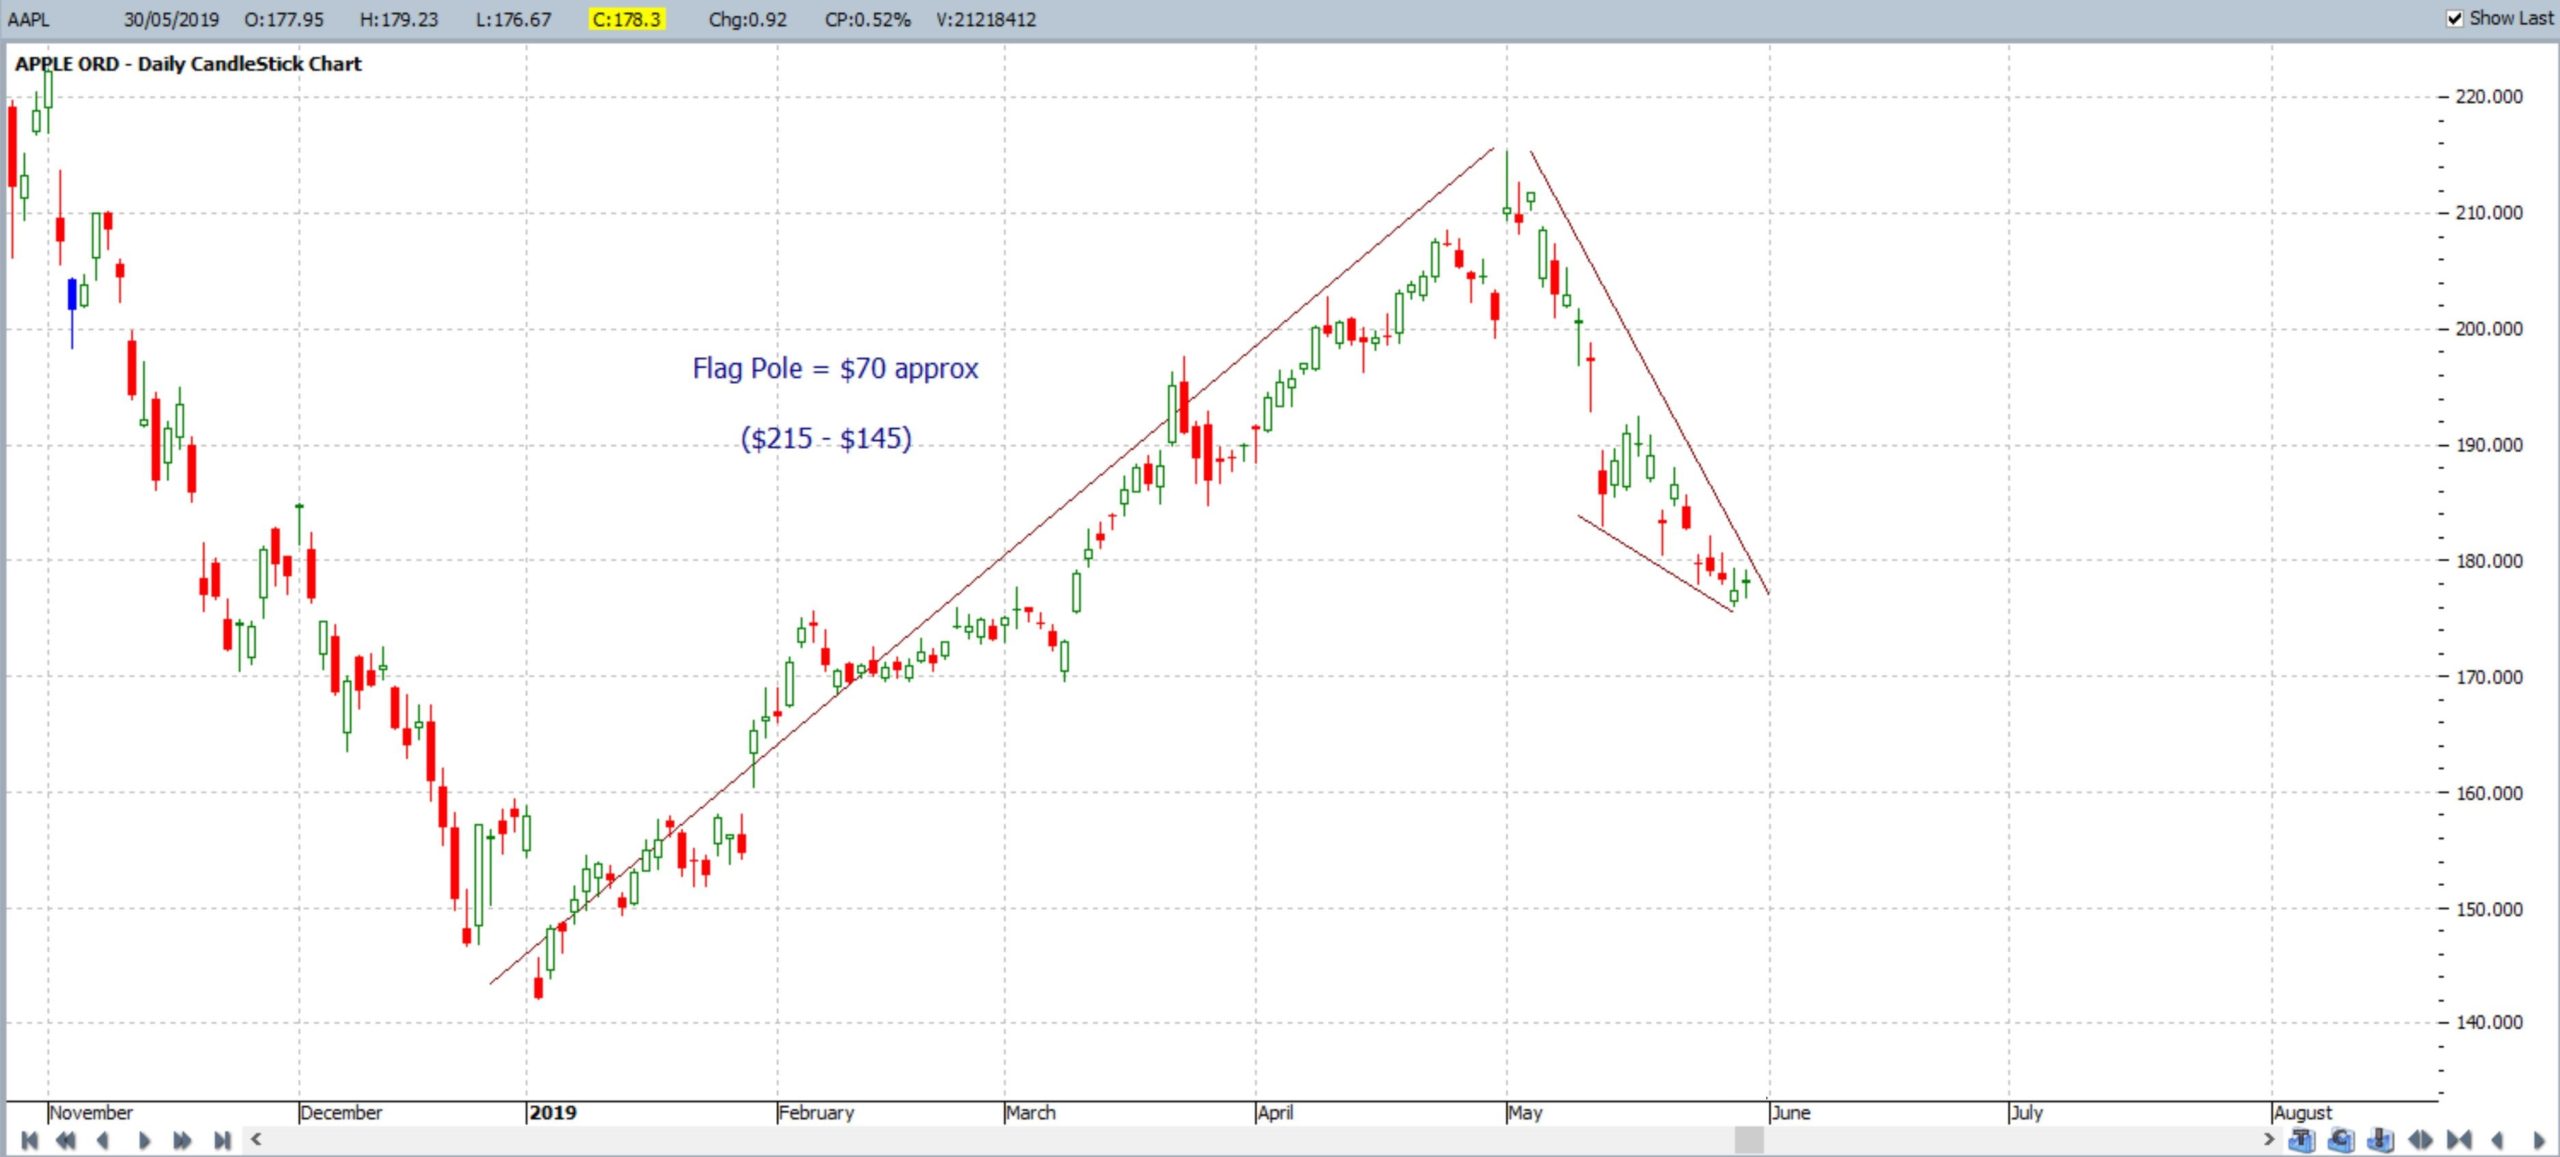
AAPL daily: Technical analysts suggest that the length of the Flag pole can be used to approximate the target for any bullish breakout move. That is, the length of the Flag pole equals the length of the bullish breakout move. In the Apple example, the length of the Flag pole is $70 and so the target for any breakout move would be $70 beyond the breakout level. (NB: I measure the Bull Flag breakout from the level at the top of the Flag. Some analysts measure the breakout from the bottom of the Flag):
AAPL daily: the Bull Flag breakout evolved in June 2019.
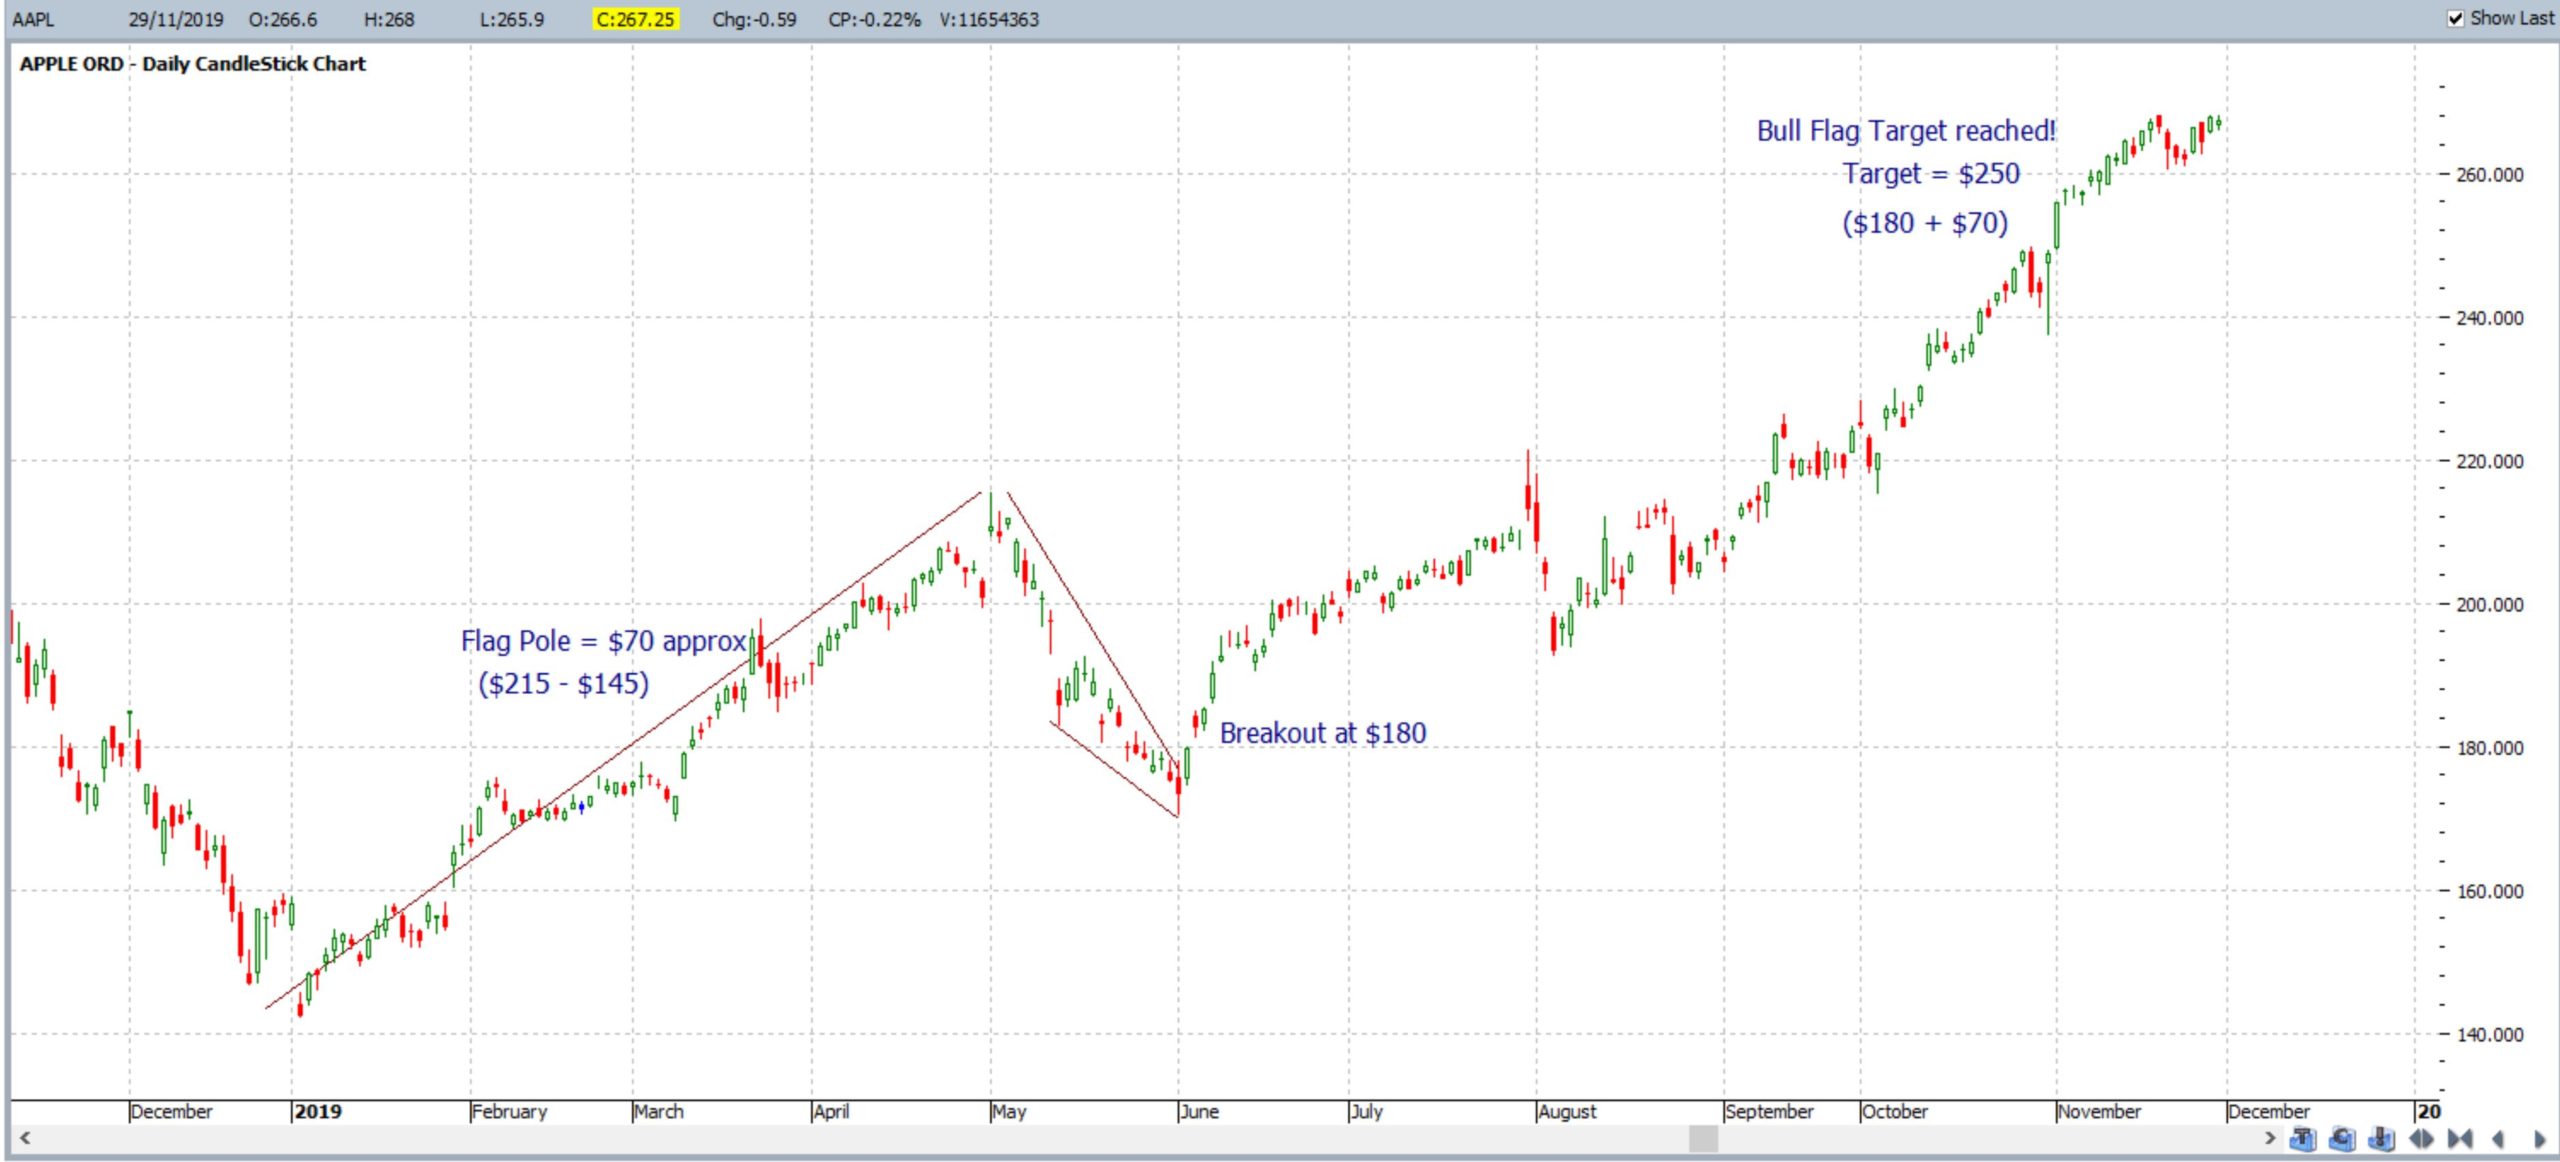
AAPL daily: Note how the Bull Flag completed in November 2019. Price action reached the target of $250 and has even continued from this point.
Summary: the Bull Flag is a bullish continuation pattern. They are worthwhile patterns to try and identify across charts as they have a better than a coin toss probability of some decent follow-through, even if not for the whole of the projected target. It is useful to use a momentum indicator in conjunction with the trend line breakout to give confidence there is momentum for any breakout move.