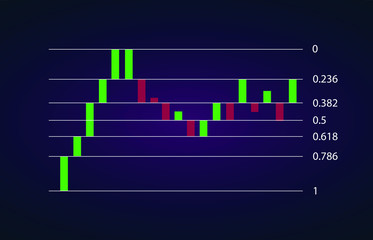
Fibonacci retracements are ratios used by traders to help identify potential targets in any pull-back move. A more detailed explanation about Fibonacci and the application of this to charting can be found elsewhere on my site and through this link. One of the most powerful of the Fibonacci levels is the 61.8% level, know as the Golden Ratio, but the 50% and 78.6% levels figure highly as well. Fibonacci analysis is quite widely used and so even technical analysis ‘doubters’ should respect the science of self-fulfilling prophecy here. That is, that price action often adheres to these norms given the large number of traders who observe Fibonacci and apply it in their trading! It’s really nothing more than herd mentality in operation. In this post I show two examples where Fibonacci levels have been respected. More Fibonacci examples will be updated through this link as they trigger.
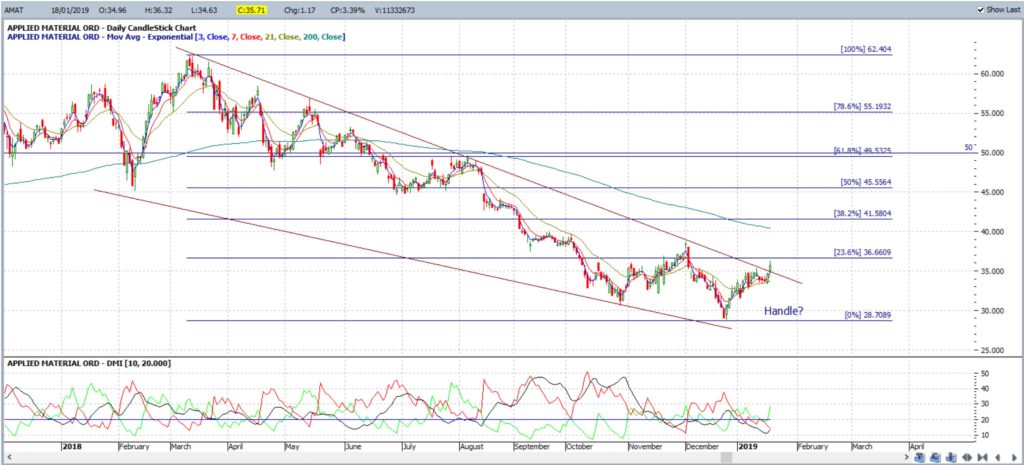
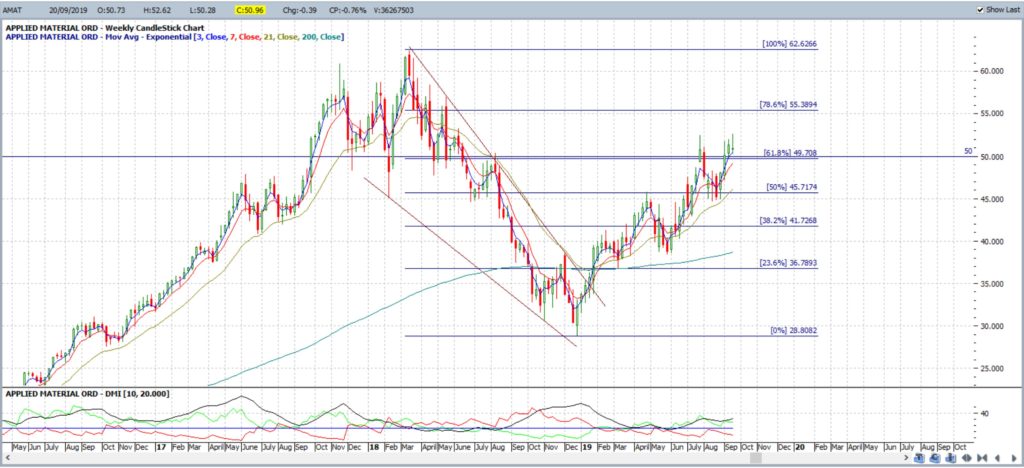
EXAMPLE: AMAT September 2019: The 61.8% Fibonacci level has been respected by AMAT two times in recent history.
AMAT weekly: Jan 2019: price action had rallied from late 2015 to 2018. A pullback then triggered and this moved price down to the 61.8% fib level. Note how this pullback shaped up into a bullish-reversal Descending Wedge:
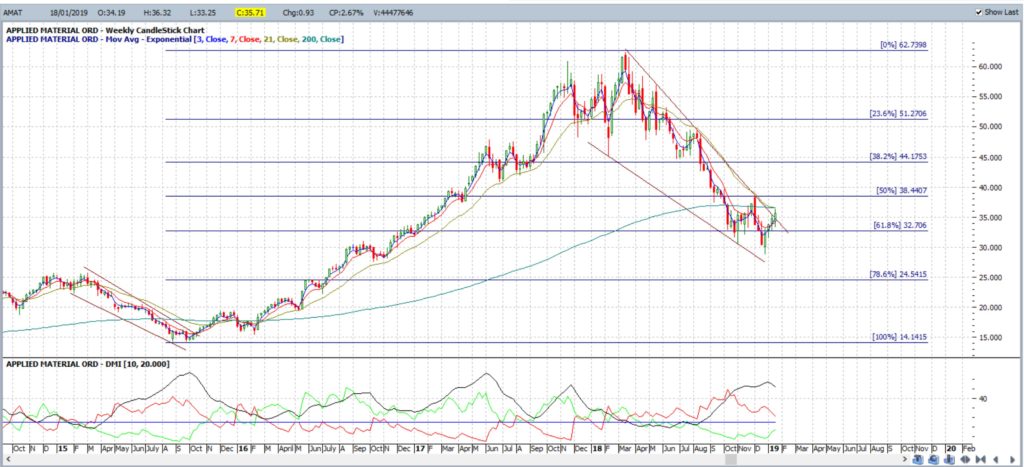
AMAT weekly: Jan 2019: This pullback stalled and a recovery was noted when price action made a bullish trend line breakout from the descending wedge. The target for any continued recovery here was the 61.8% fib, up near $50:
AMAT weekly: Sept 2019: The Descending Wedge breakout move continued up to the target of the 61.8% fib level, circa $50:
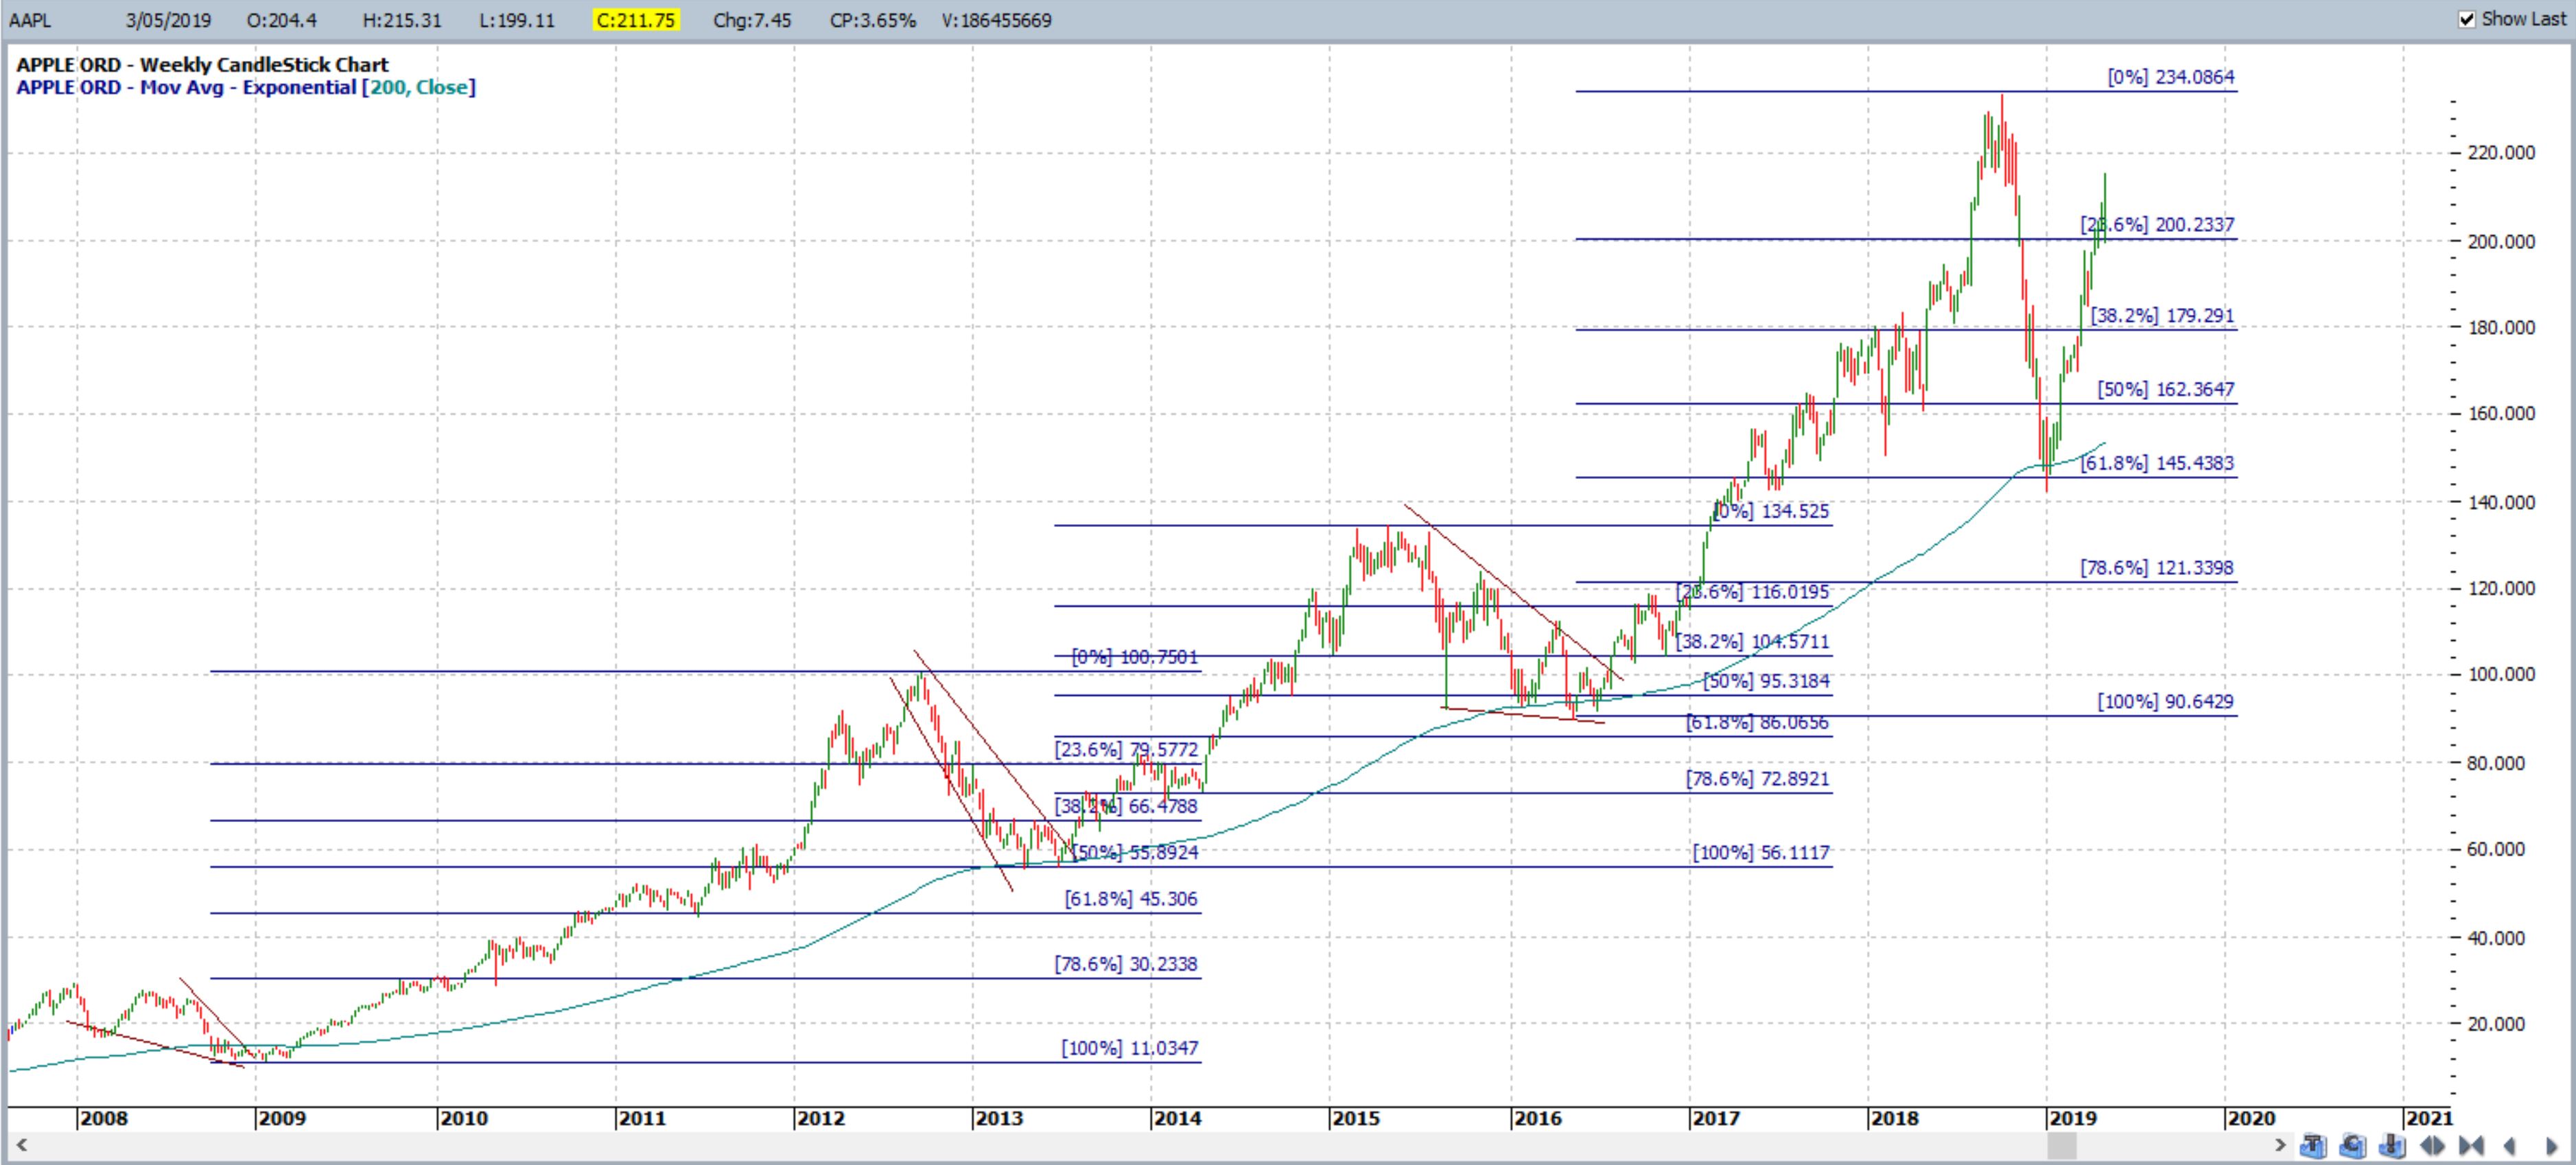
EXAMPLE: AAPL May 2019: Check out how Apple stock has respected either the 50% or 61.8% Fibonacci over the last 10 years!
AAPL weekly: May 2019:
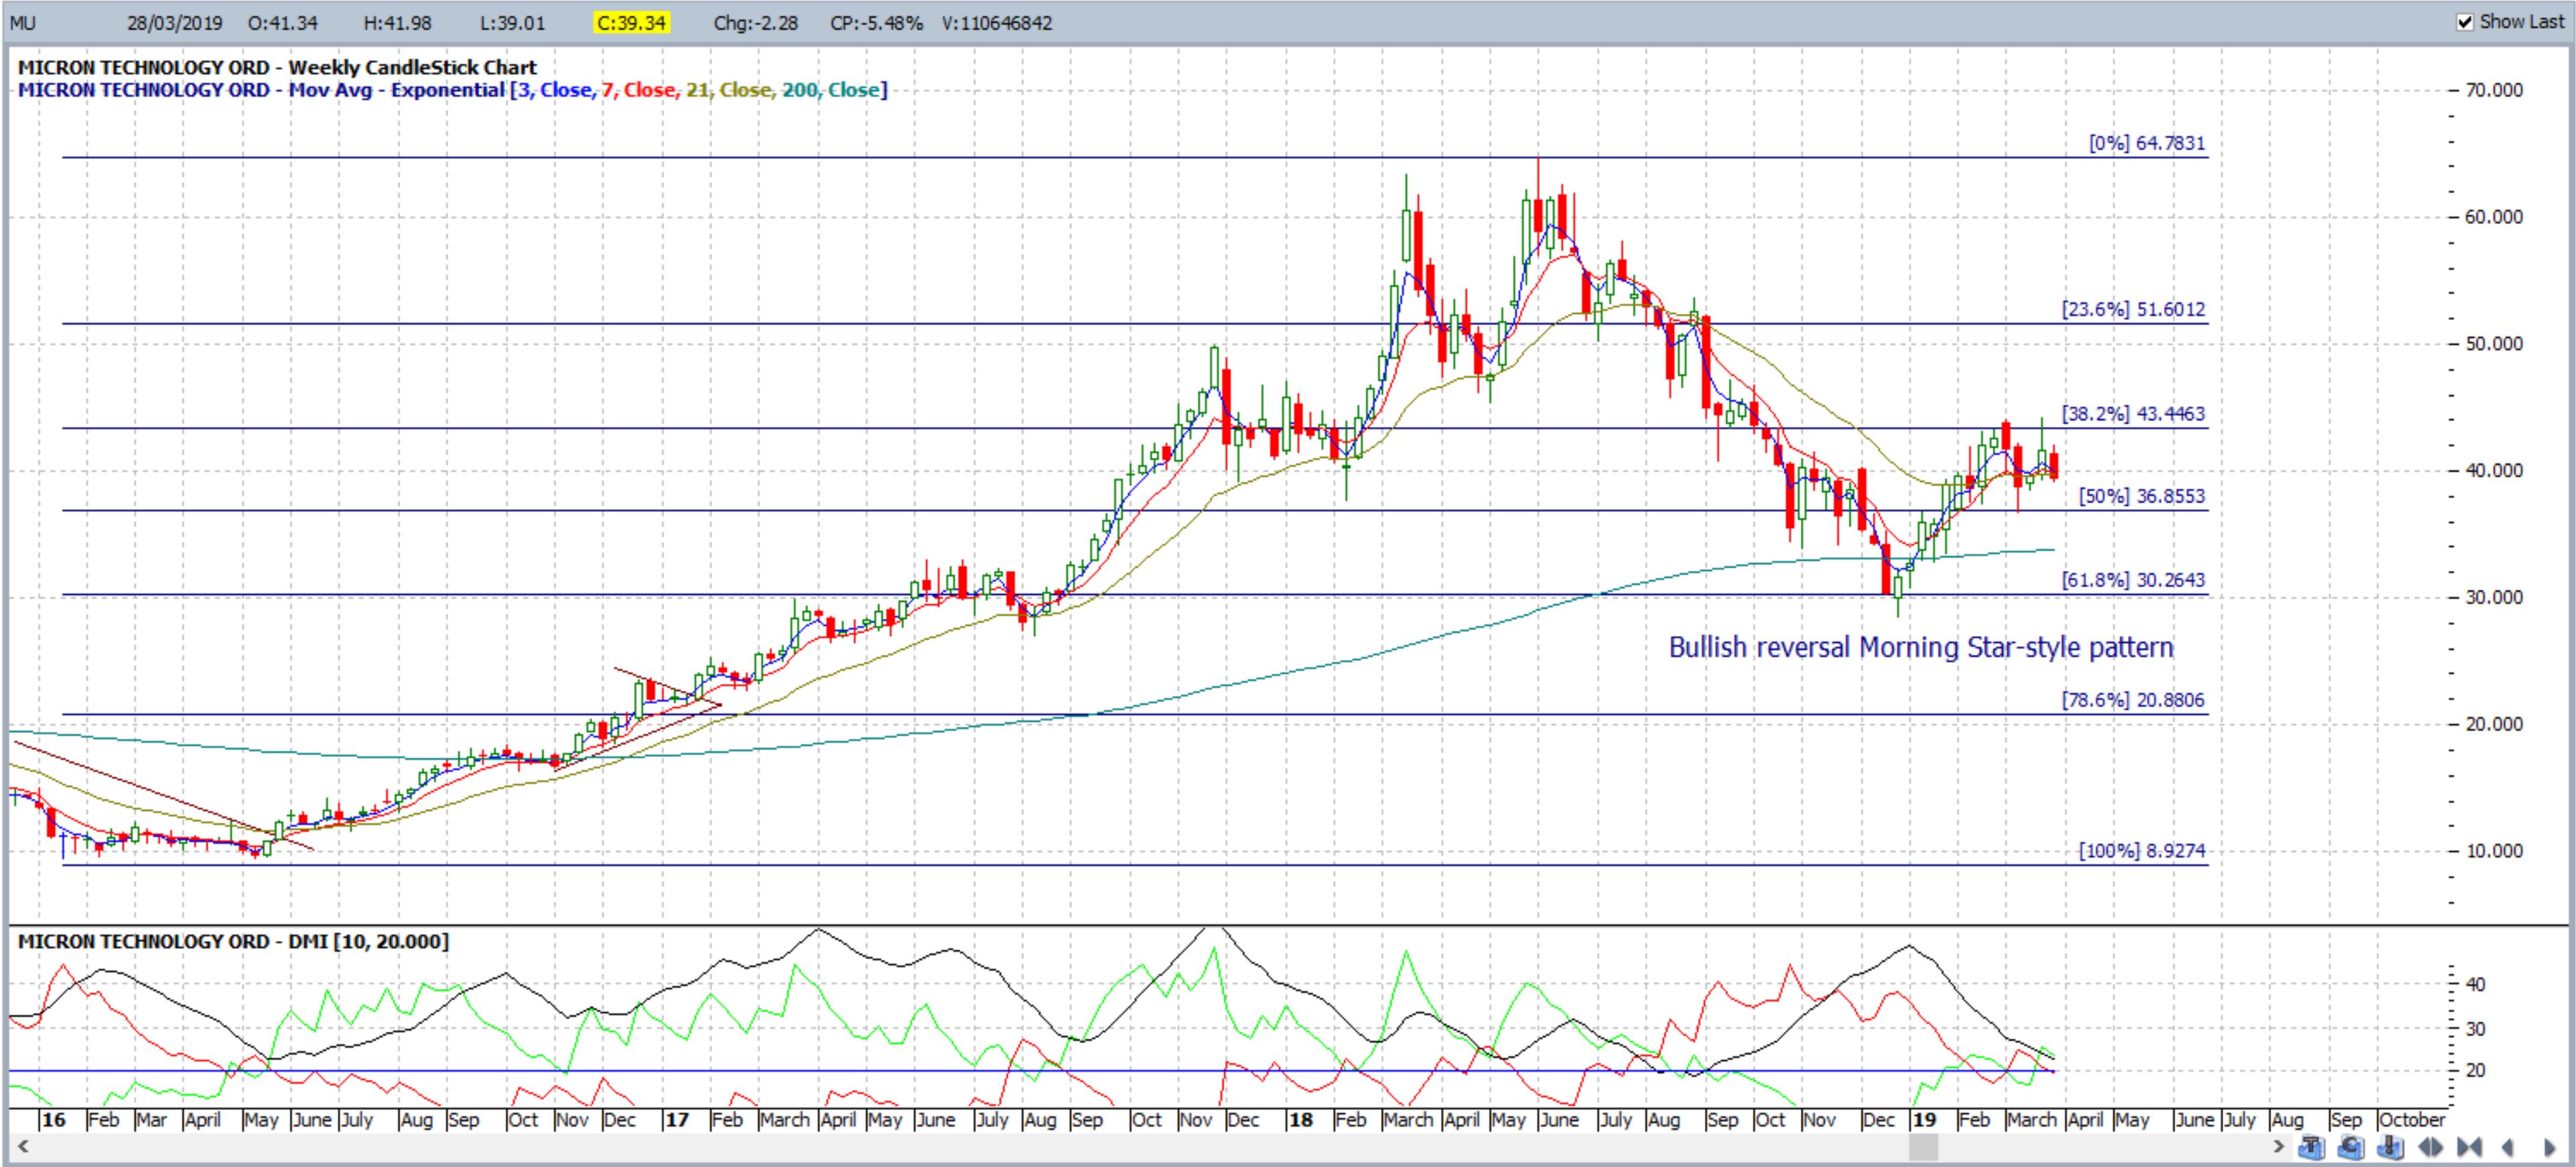
EXAMPLE: MU March 2019: Micron Technology is a good example of a stock having a bullish run but, eventually, experiencing some exhaustion and having a pull back. Price action had rallied for almost 2 1/2 years: from early 2016 to mid 2018. Fibonacci levels can be used in these instances to help track and identify potential pull back targets. The 61.8% Fibonacci level is a popular pullback target and this was the target for the pullback on Micron. Another popular level is the 50% level. Note how there was also the print of a bullish-reversal Morning Star pattern and this was added confluence to the support offered by the 61.8% level:
MU weekly: March 2019:
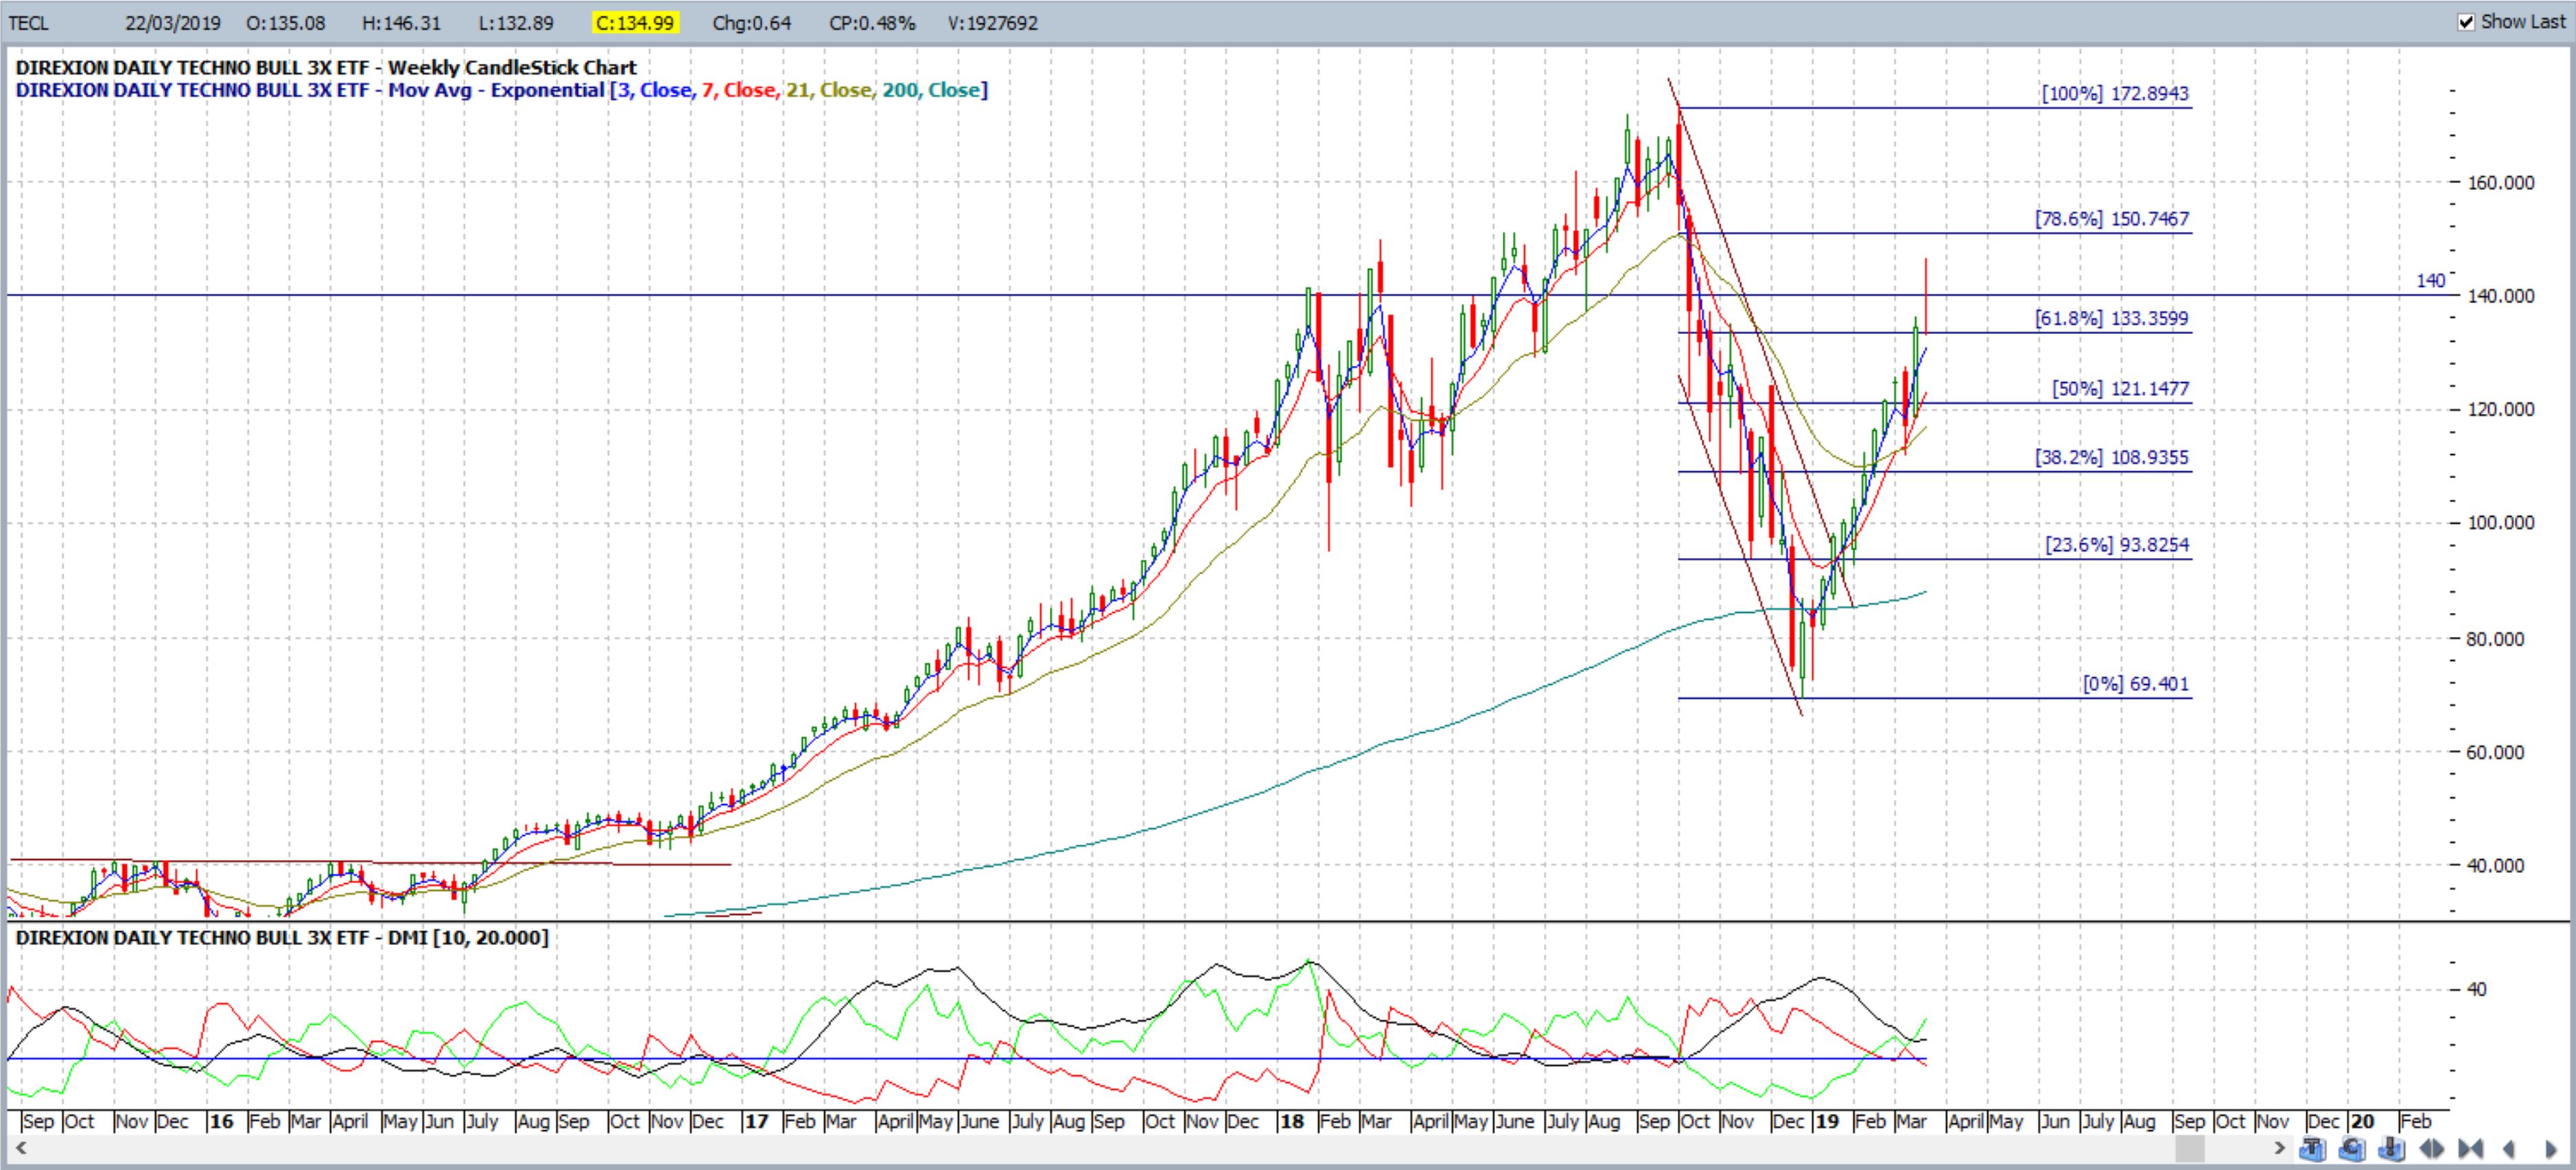
EXAMPLE: TECL: Jan 2019: this channel breakout triggered in late January 2019 and so Fibonacci was applied to the swing Low move. That is, the pullback move from October 2018 to December 2018. The second chart shows that the 61.8% Fibonacci was reached in late March of 2019. The gain was 35 which equates to a 35% increase:
TECL weekly: on breakout January 2019:
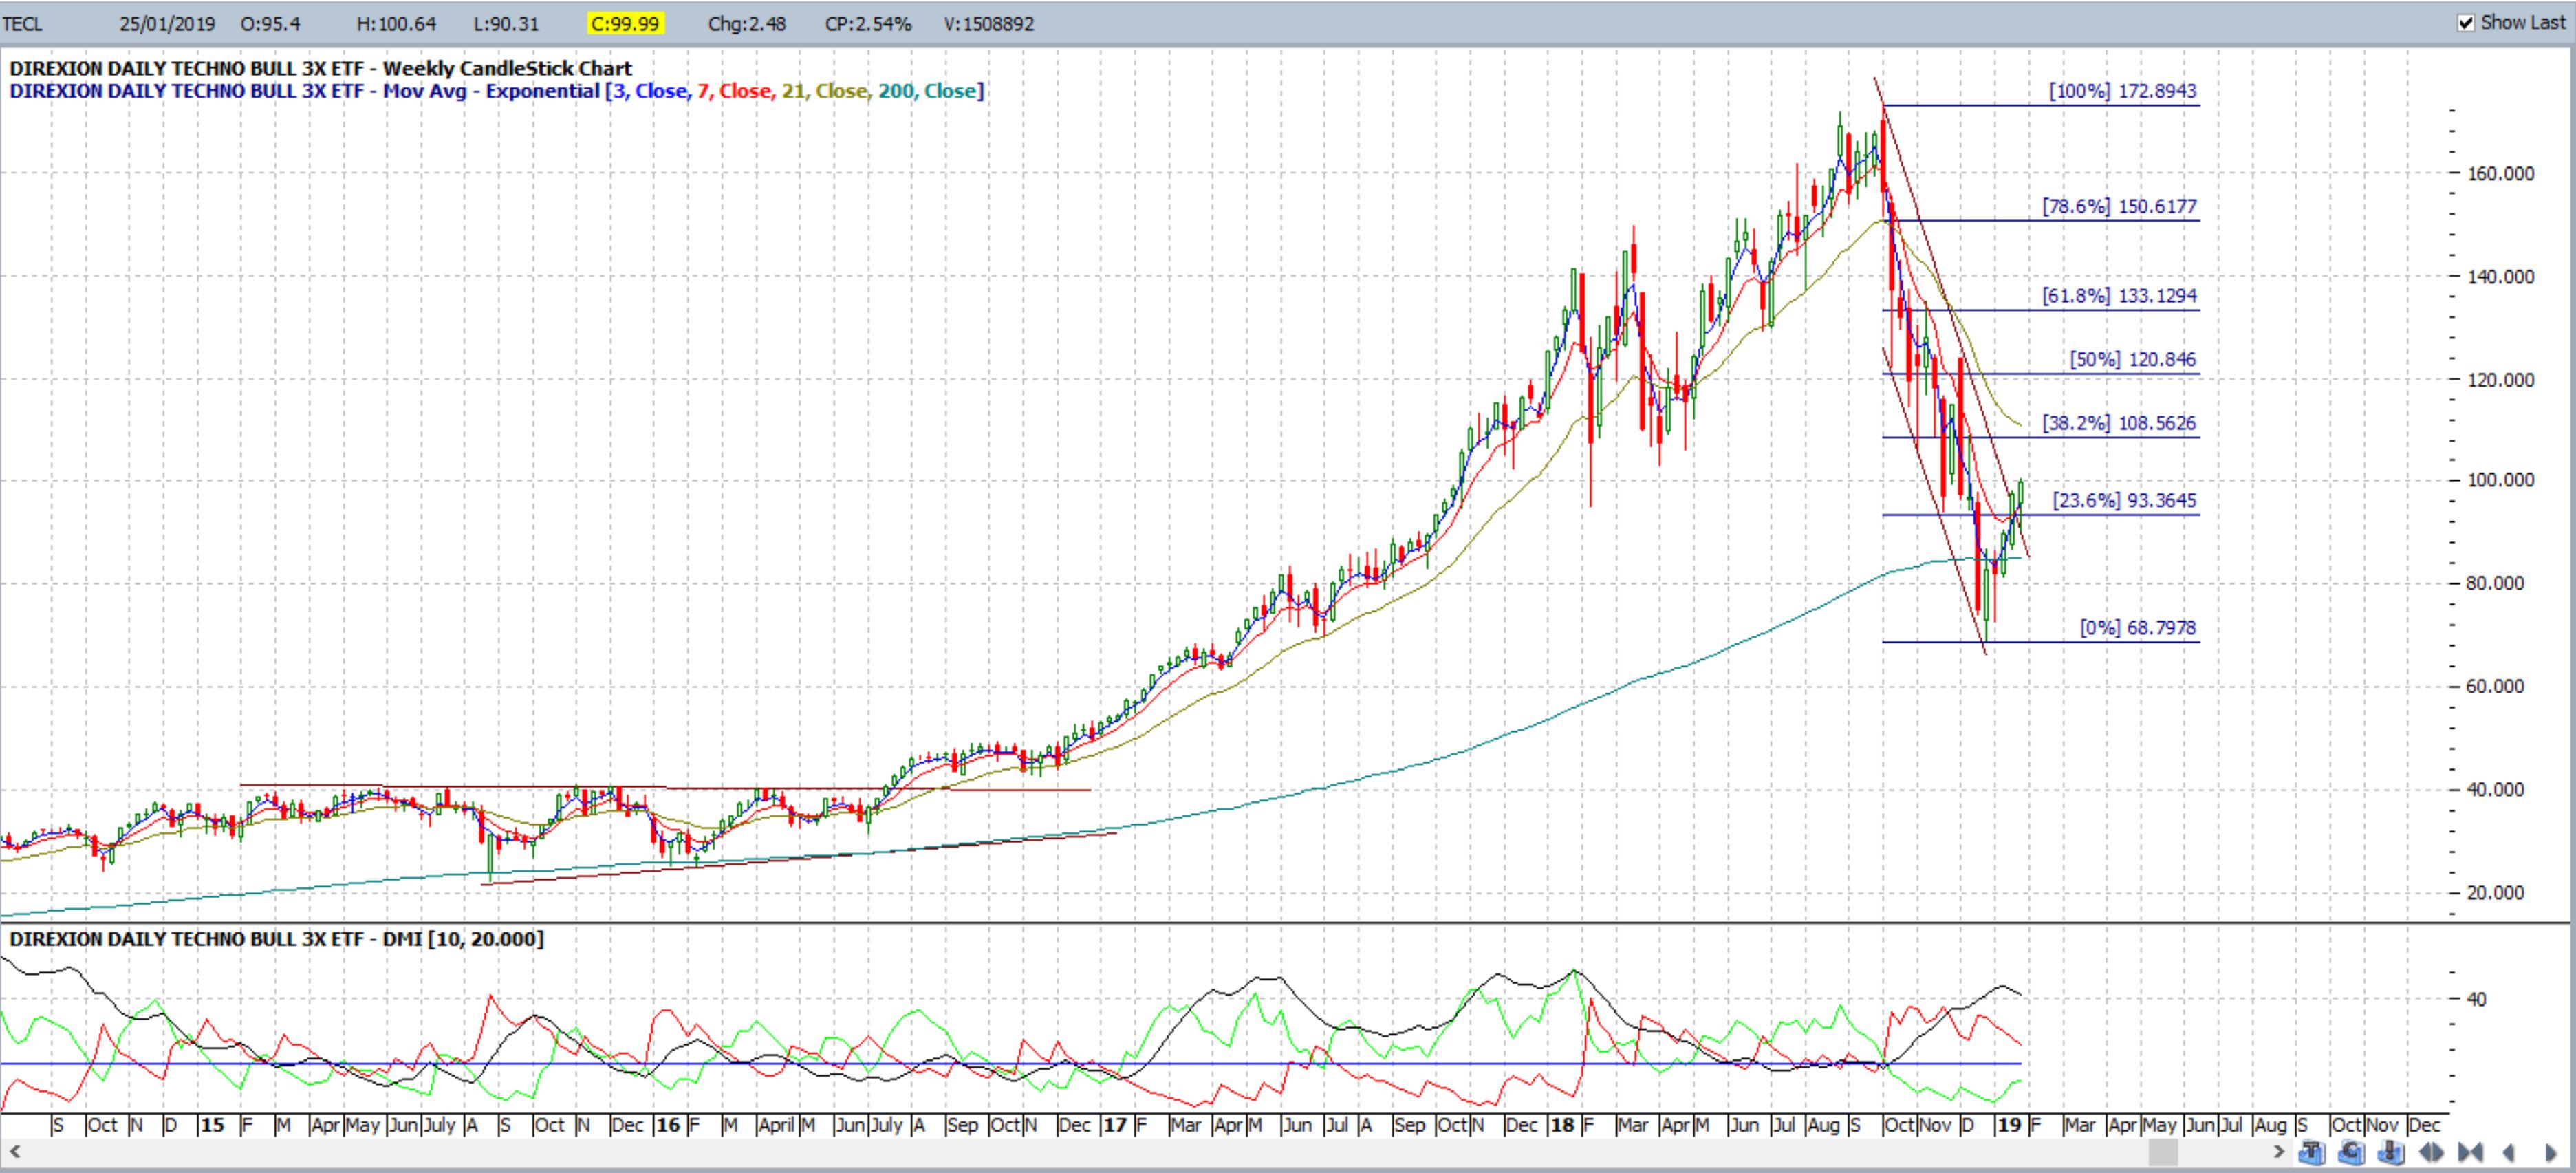
TECL weekly: with a 35% gain by March 2019:
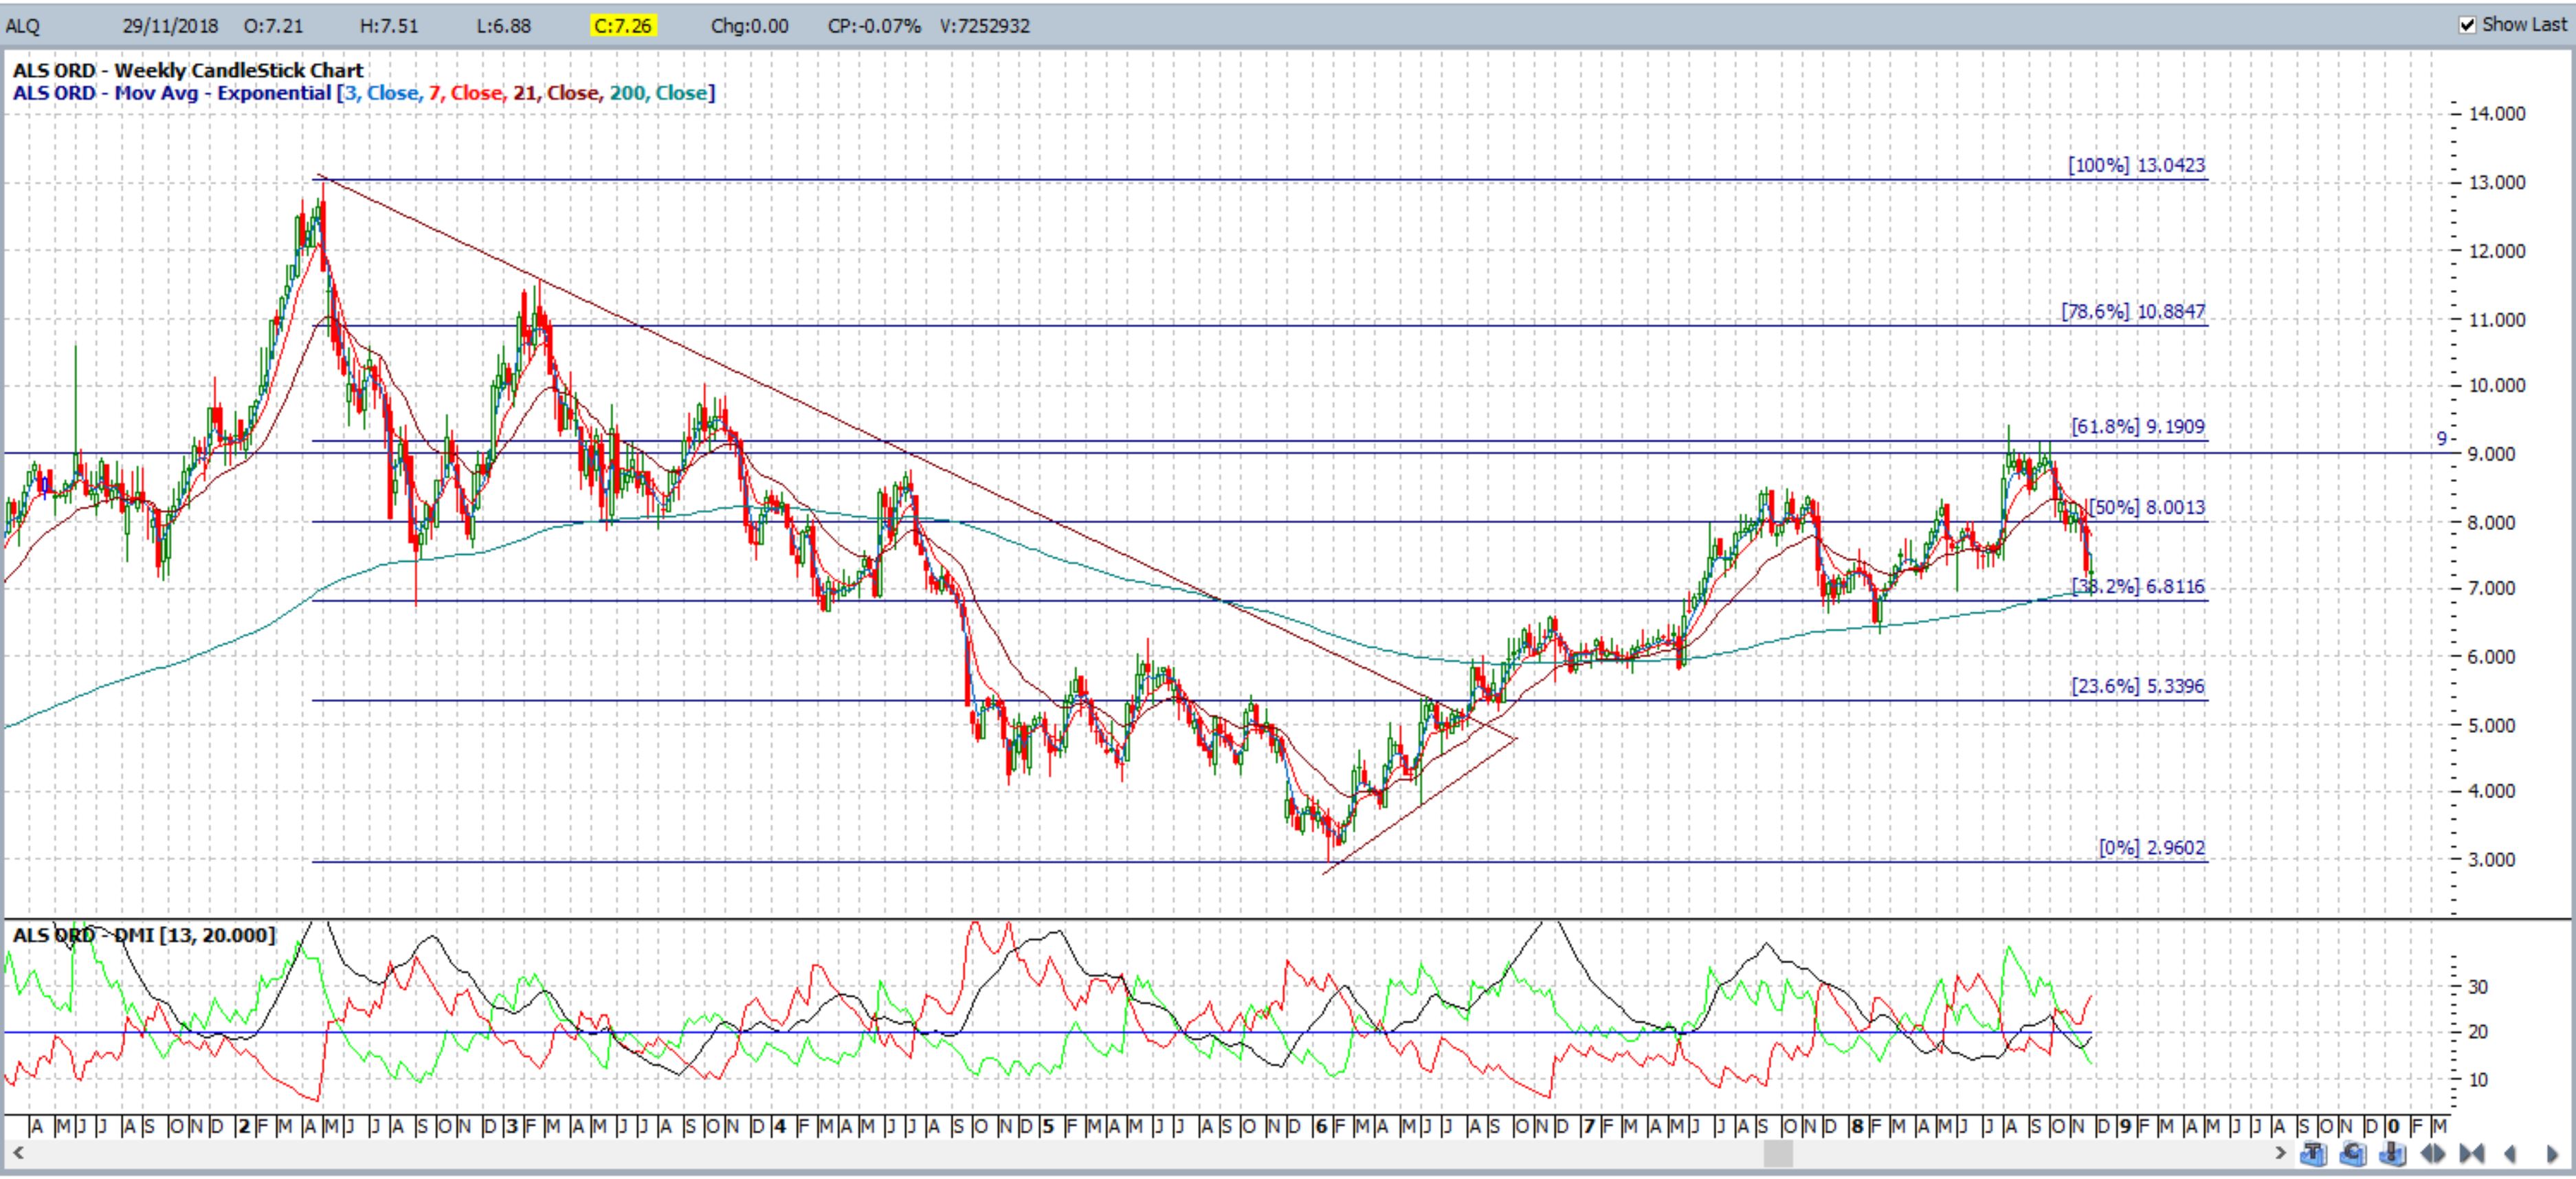
Example: ALQ: Nov 2018.
This triangle breakout triggered in Aug 2016 and the target was always the 61.8% fib, near $9 S/R. This target was reached in mid 2018 and price action subsequently chopped sideways:
ALQ weekly: on breakout:
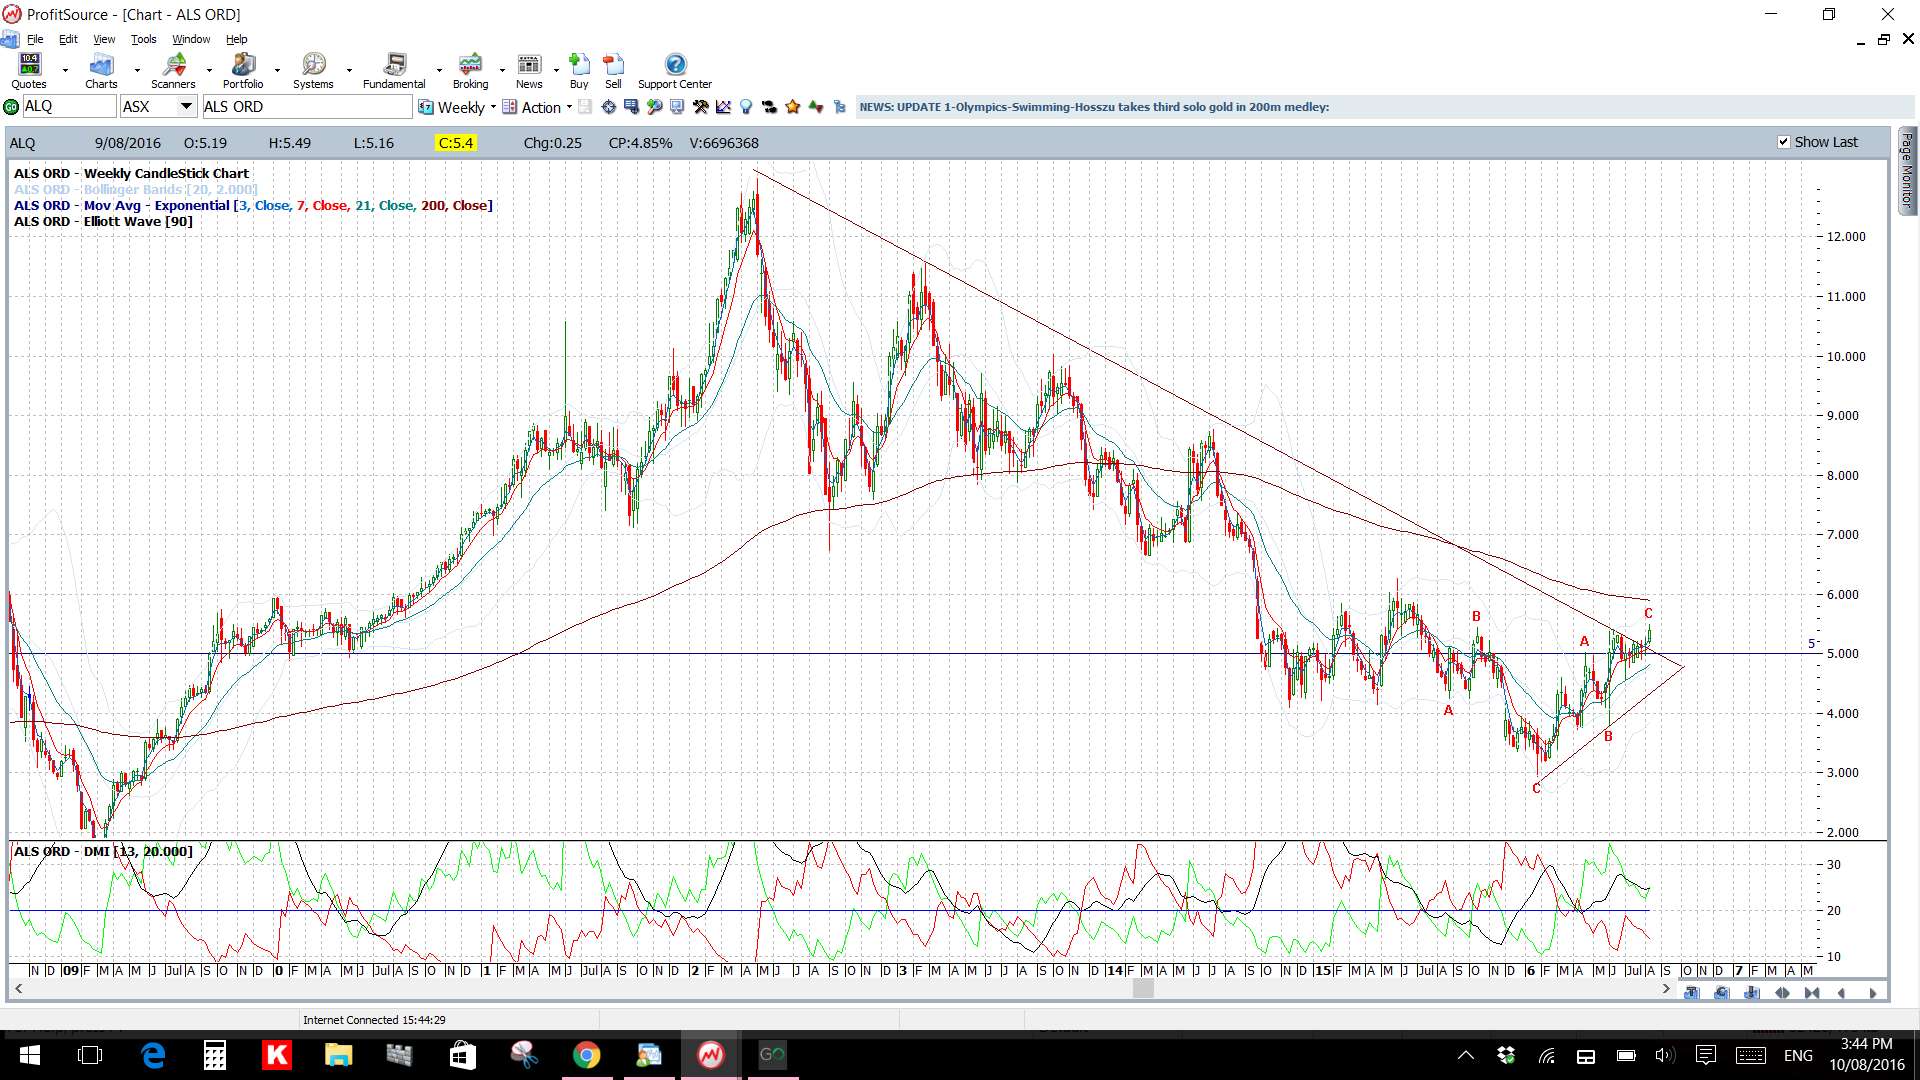
ALQ weekly: the breakout stalled once the 61.8% fib was reached: