


There are plenty of examples on this site of the merits of Descending Wedge chart patterns and of the application of Fibonacci to charting. In this article I take this one step further and show the value of combing both of these technical tools in the assessment of a potential trade.
These two aspects of technical analysis work very well together though and in this article I provide an outline of their application on a recent breakout trade on the USD/JPY currency pair. It is my belief that the combination of the Descending Wedge and Fibonacci is much like a marriage made in heaven!
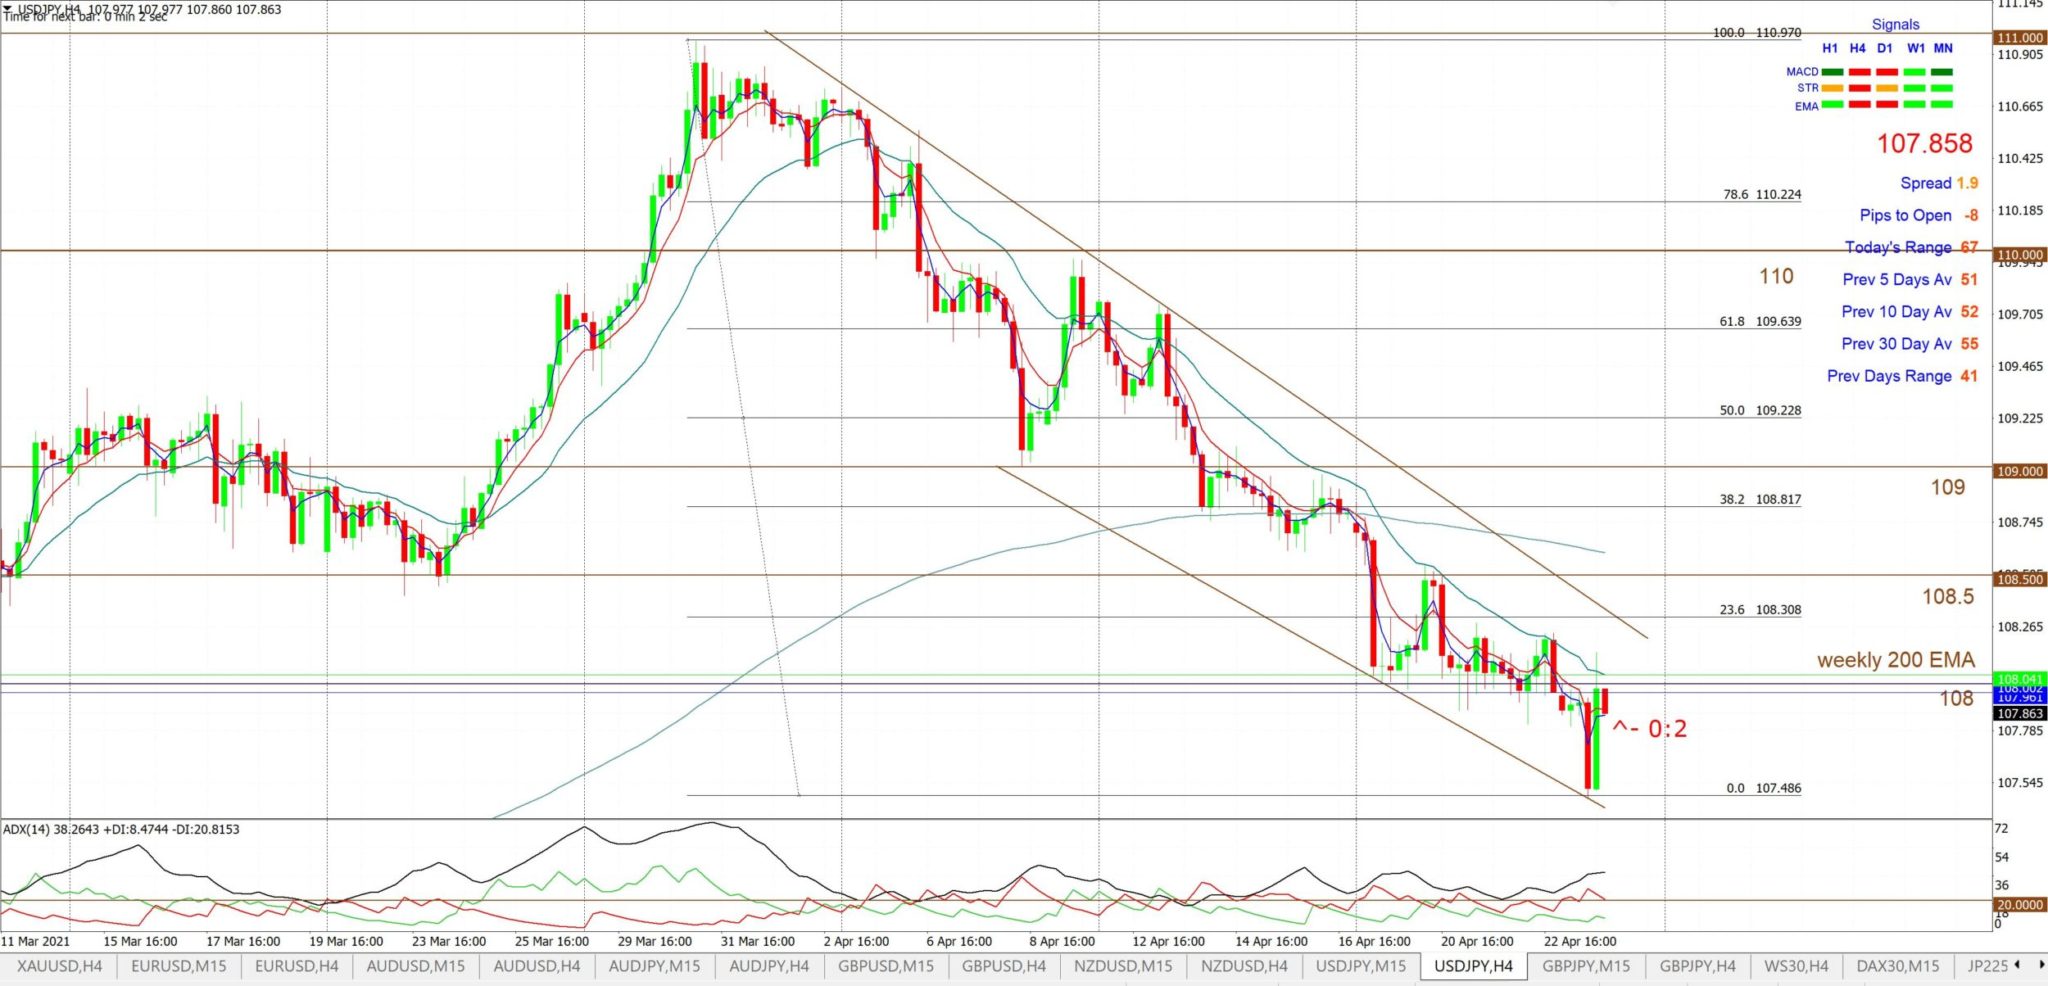
USD/JPY 4hr: This chart was posted in my weekend update on April 25th 2021. Price action had been trading within a Descending Wedge / channel for around four weeks. The plan of action for USD/JPY traders would be to watch for any new trend line breakout; either up or down. However, Descending Wedge patterns are typically bullish-reversal patterns and so the caution here would have been to watch for any mean-reversion breakout move to the upside.
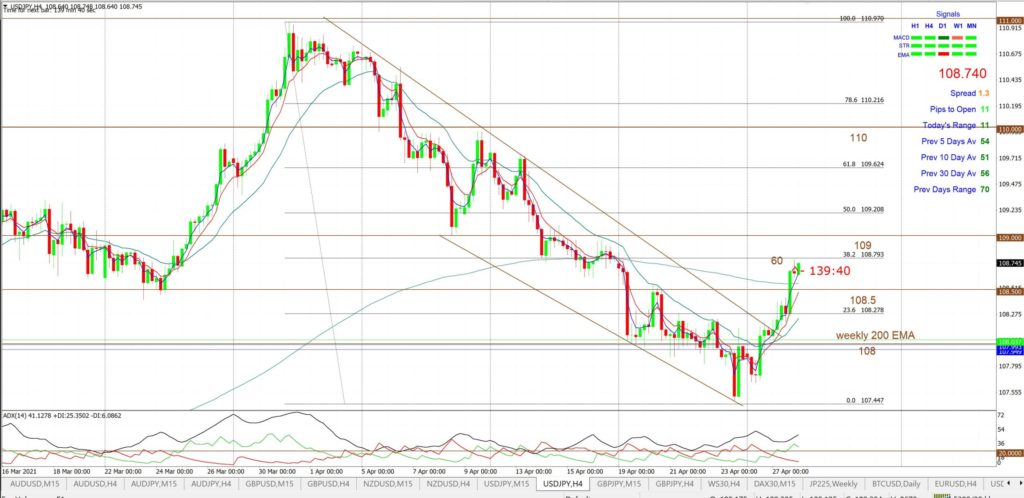
USD/JPY 4hr: The chart below was posted to my website on April 27th
Price action within the Descending Wedge had evolved to test the upper trend line. There is no guarantee, at this point, about the direction of any new breakout but the decline in ADX momentum, see lower pane of chart, revealed a shift from bearish momentum to bullish momentum. At this point it would be wise to watch for any bullish trend line breakout and to establish a Profit Target and Stop as trading parameters for the trading of any such breakout.
One such method to help with identifying a potential Profit Target is to apply a Fibonacci retracement tool and this is applied to the USD/JPY 4hr chart’s Swing Low move. By this we mean applying a 100% span from the USD/JPY High, printed in late March 2021, to the USD/JPY Low, printed in mid-late April 2021. This move is referred to as a Swing Low move and is then mapped with a percentage range spanning from 0% to 100%. Anyone interested in learning more about Fibonacci should try searching on their favourite search engine but, suffice to say here, one popular Fibonacci target used by traders is the 61.8% Fibonacci and this is the Profit Target that was used used in this analysis. Thus, the Profit Target for any bullish breakout would be the 61.8% Fibonacci level which, in plain language, means the 61.8% retracement of the Swing Low move, and this level came in just under the whole-number 110 level.

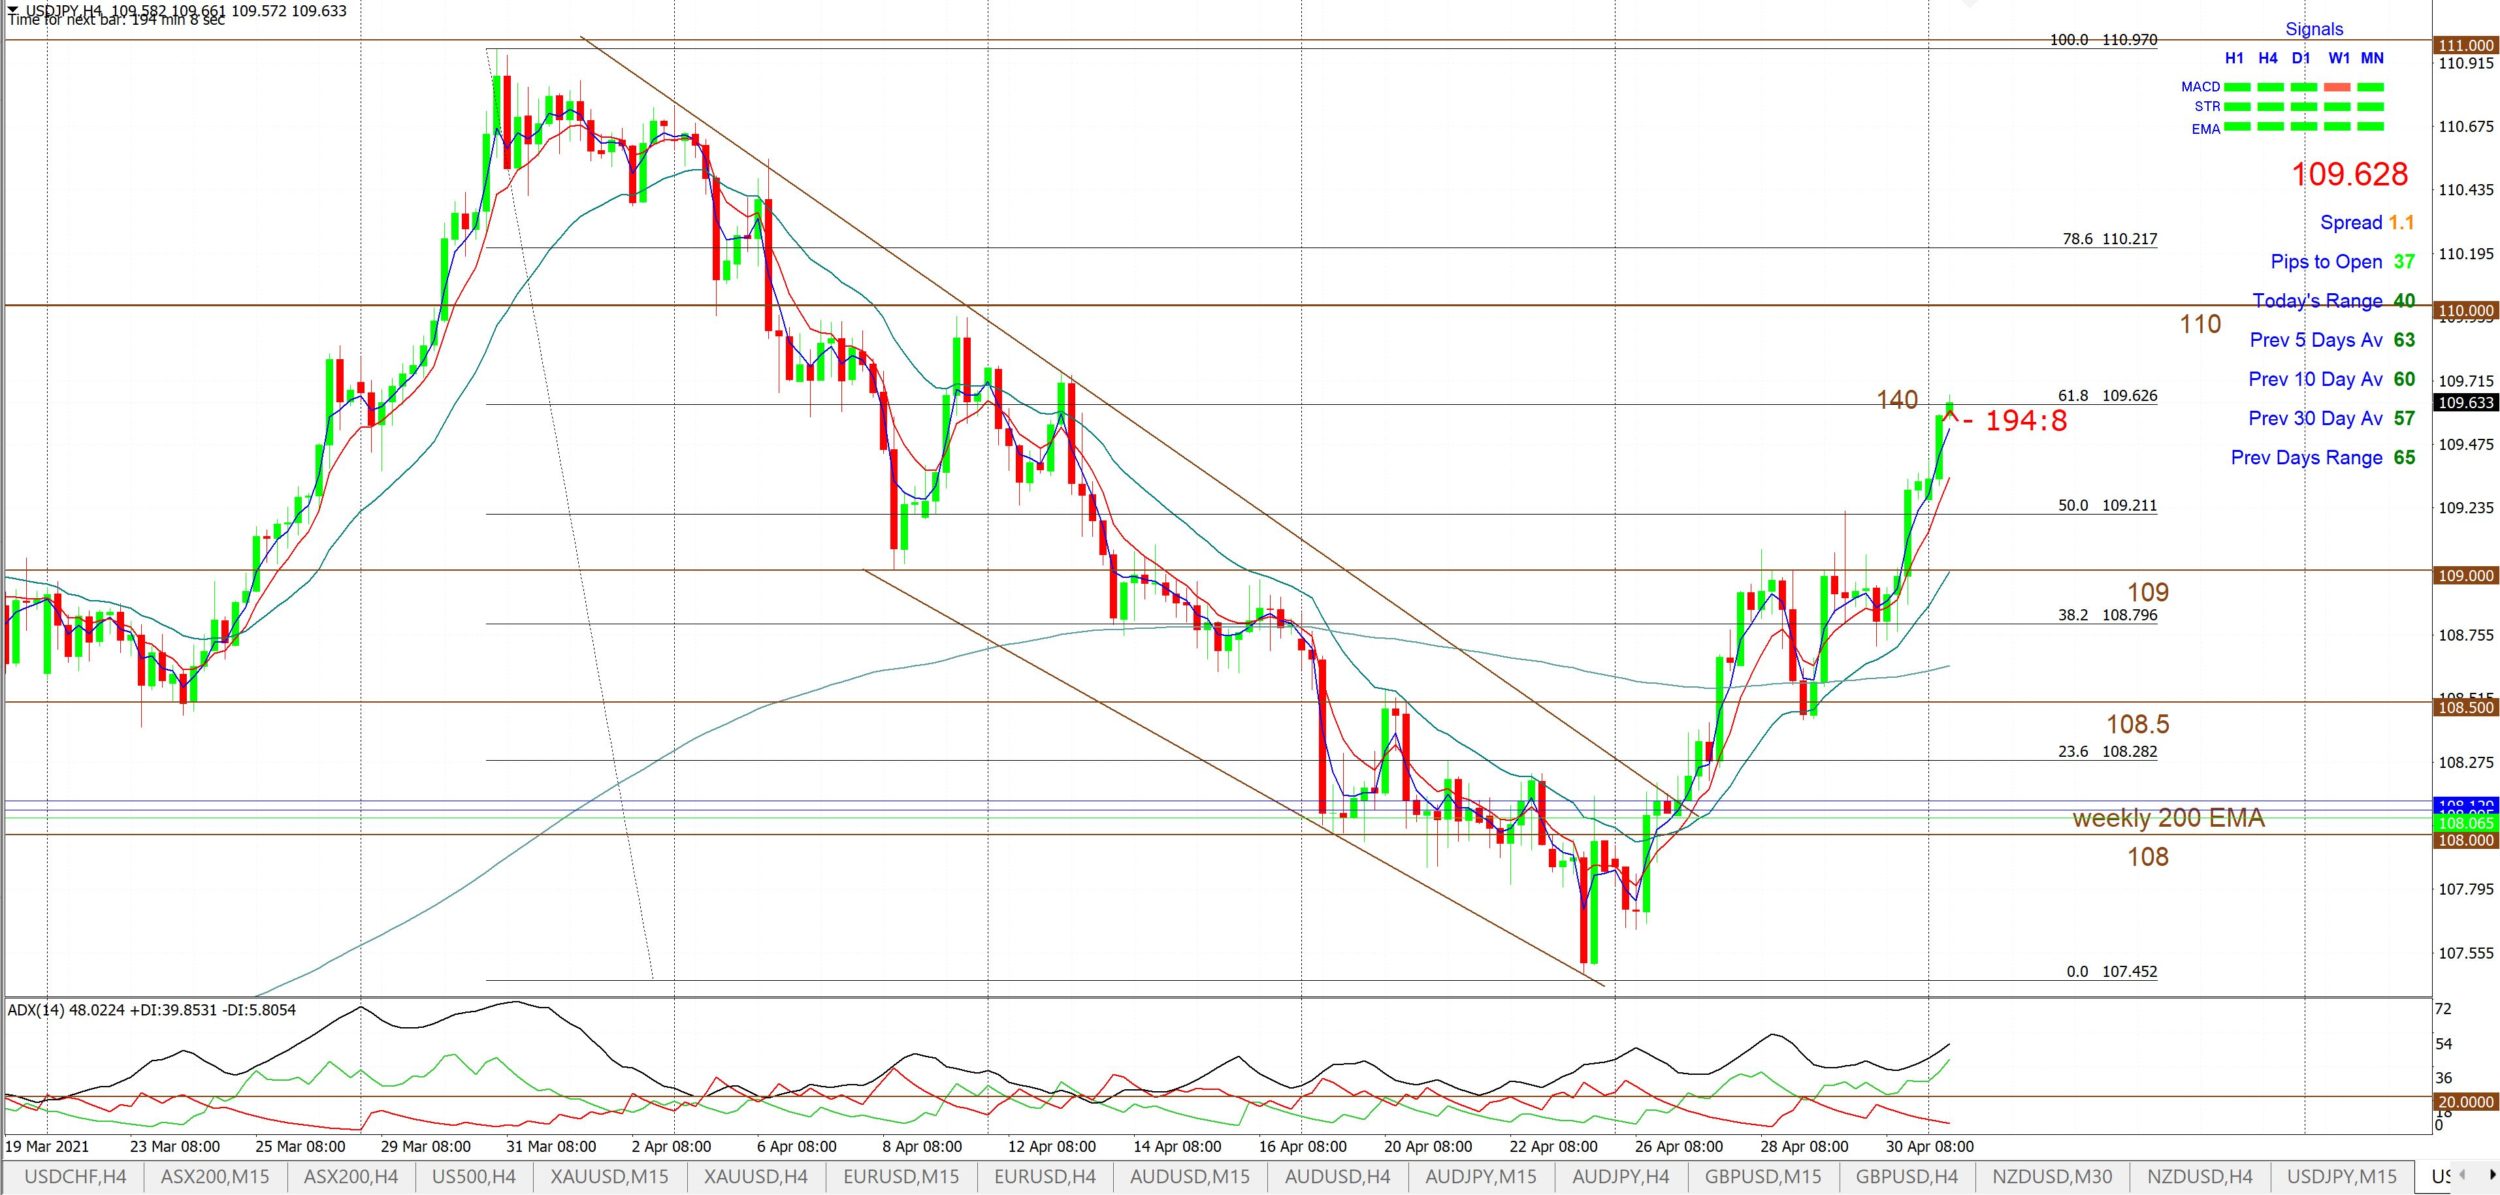
USD/JPY 4hr: the breakout triggered on April 27th and was summarised in my post on April 28th.
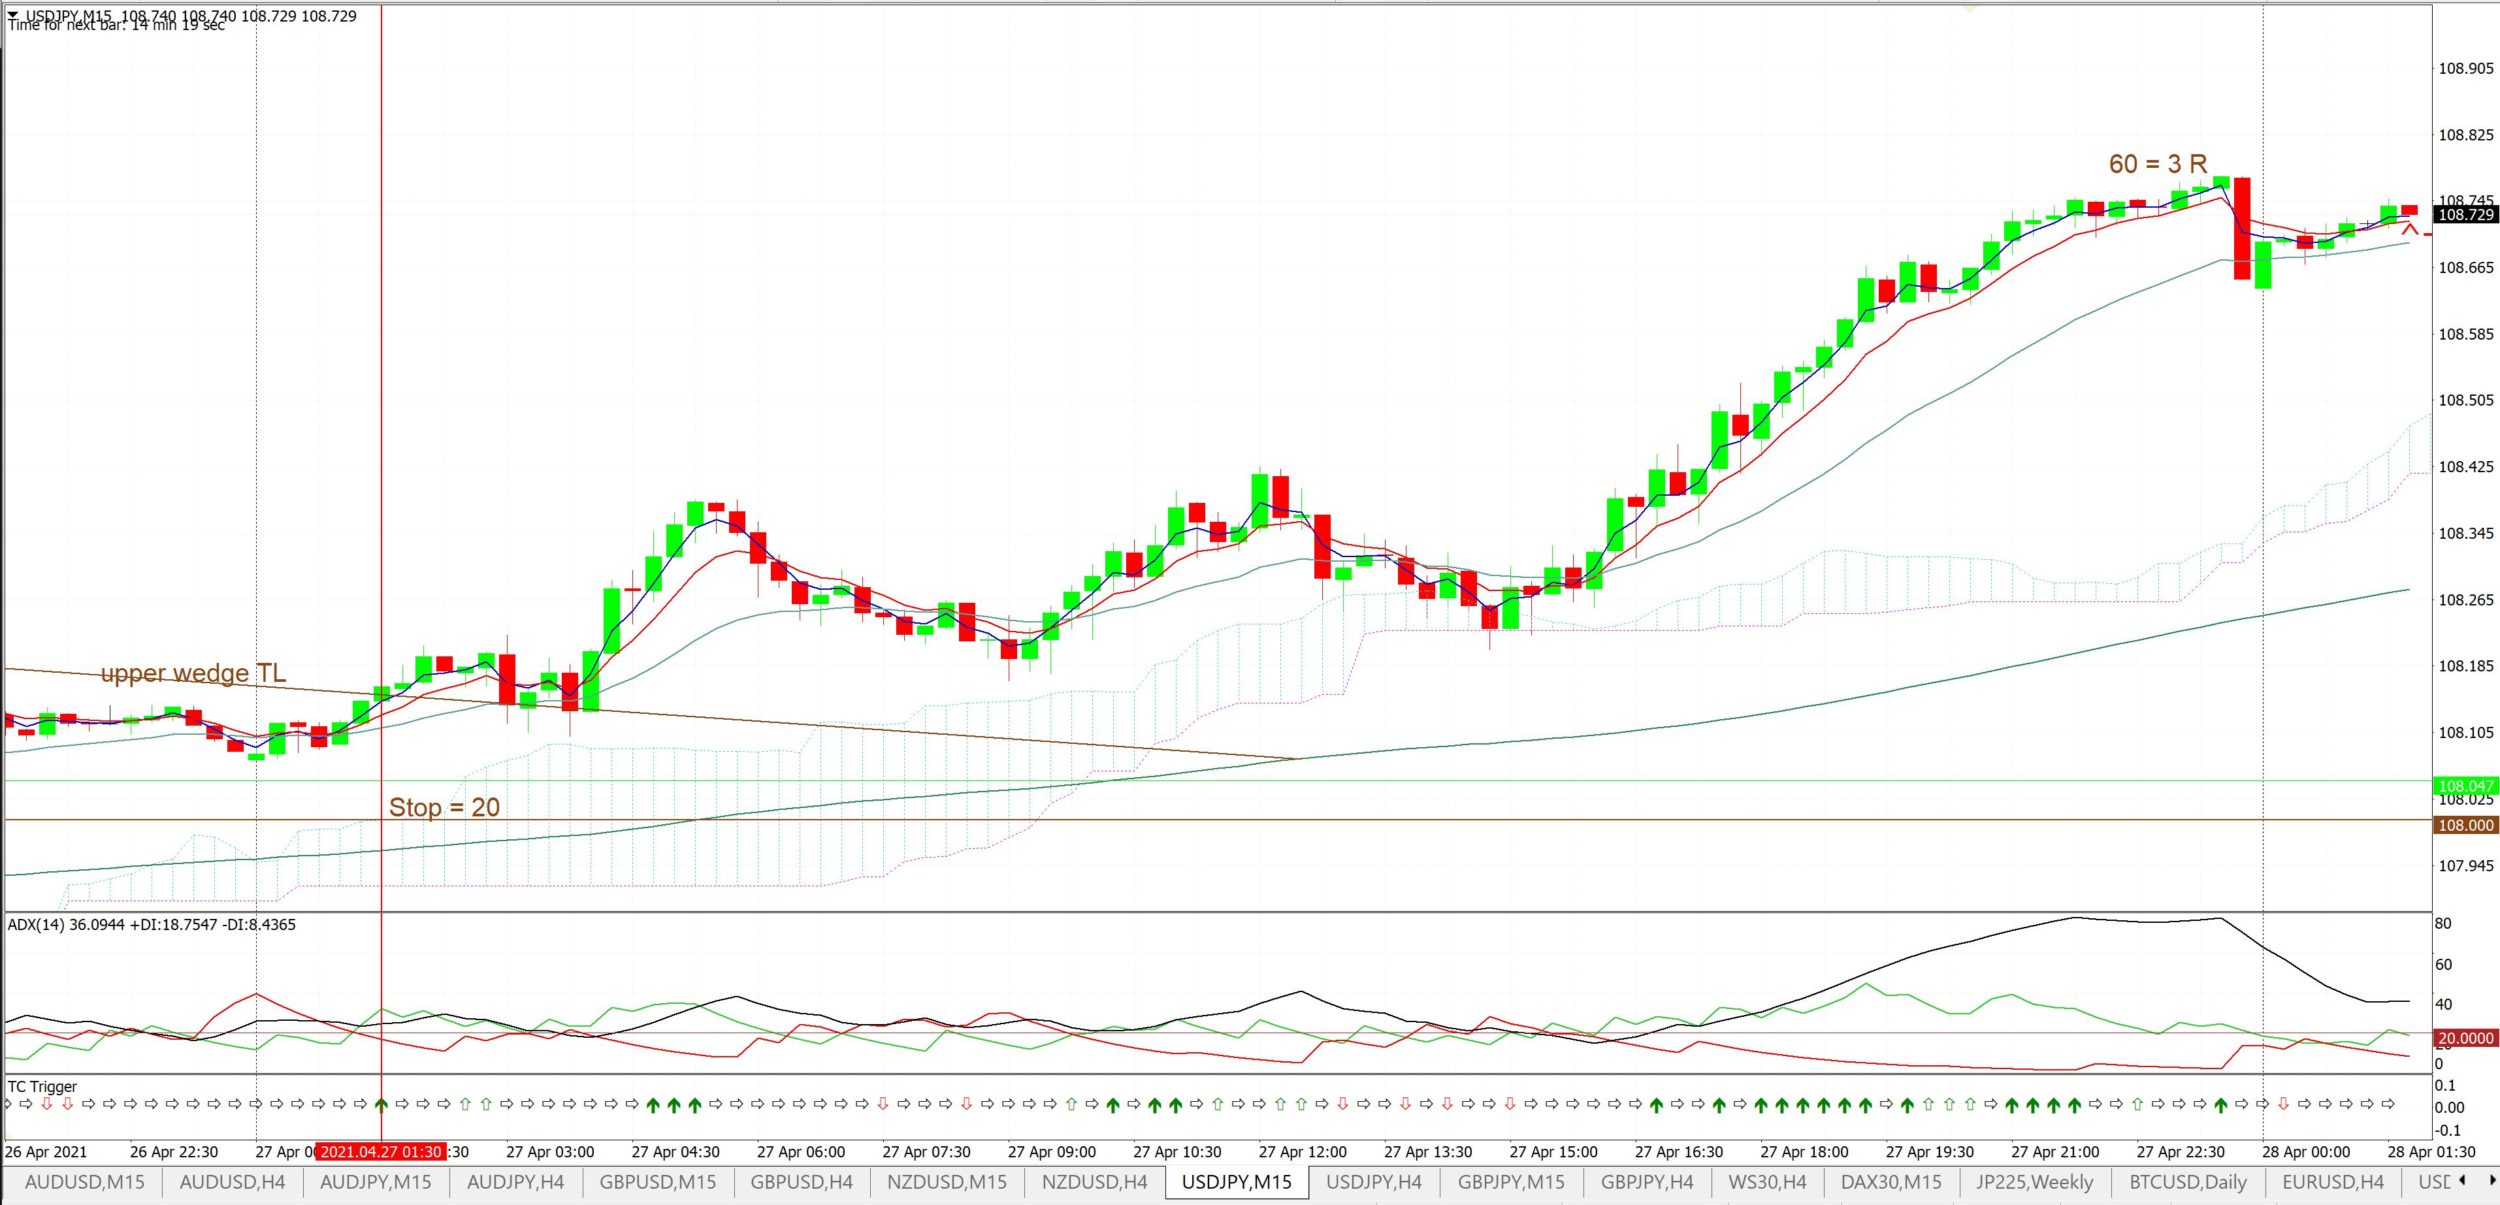
USD/JPY 15 min: This April 27th breakout triggered during the Asian session and note how this move could have been easily tracked on the lower time-frame 15 min chart. Dropping down to lower time frames can help traders to locate a trade entry and, possibly, one with a lower initial Risk. For example, this new breakout on the 15 min chart could have been entered with a 20 pip STOP as this represented the lower range of recent price action.
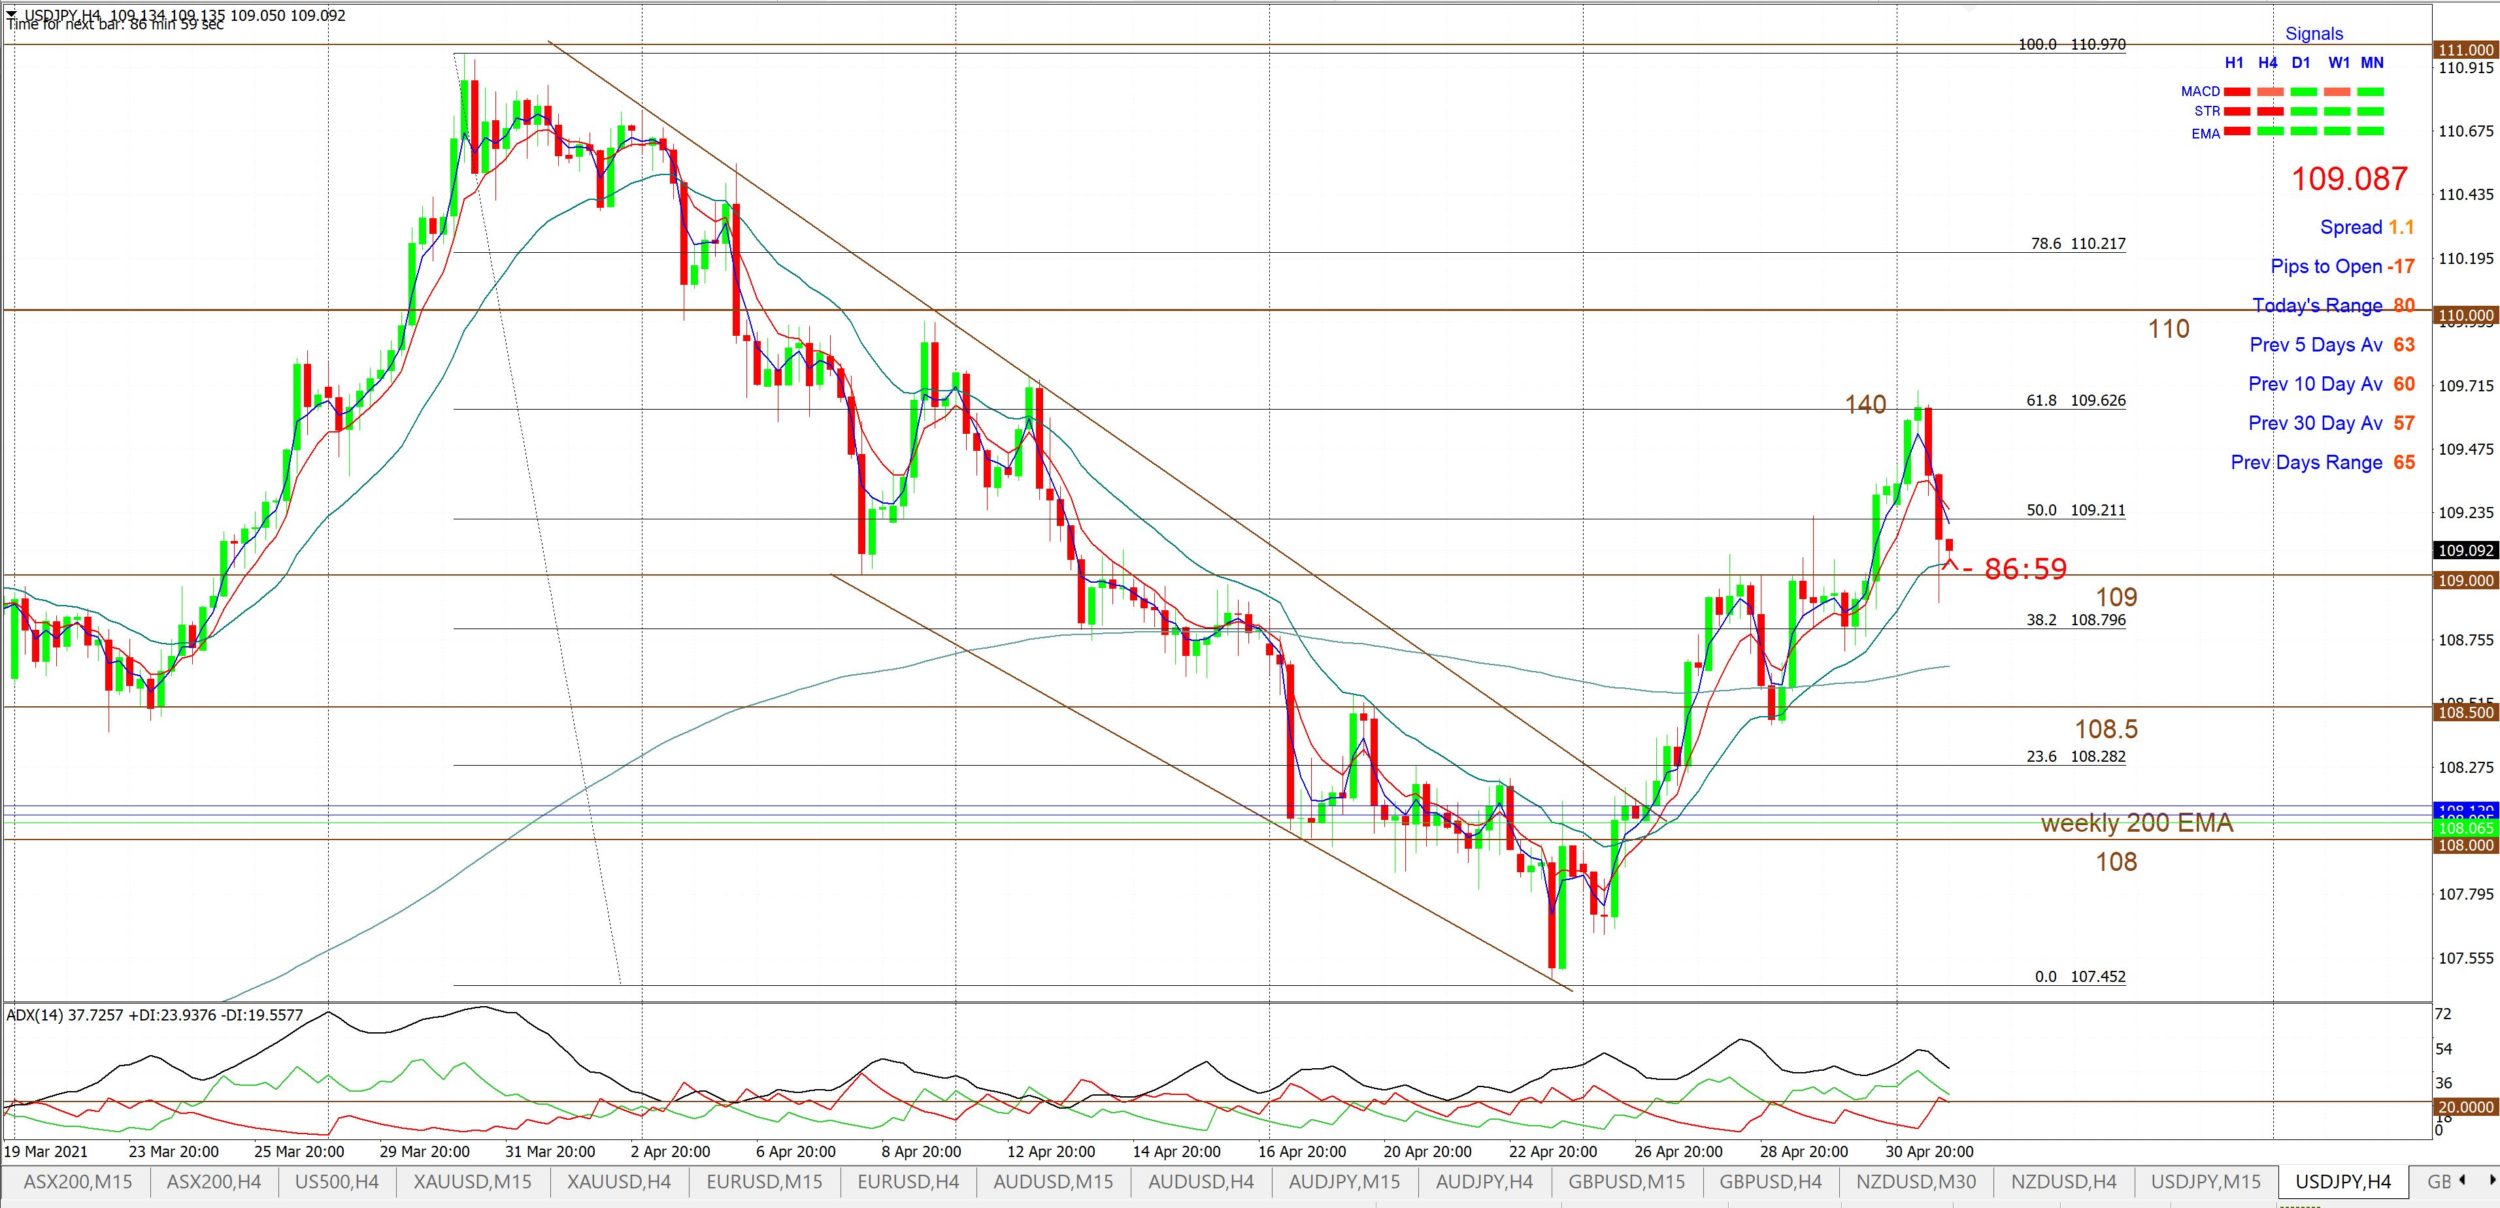
USD/JPY 4hr: This chart was posted on Twitter on May 3rd 2021. Note how price action had reached the target 61.8% Fibonacci level.
It was at this point that I warned active traders to watch for any pause with price action here given that this Profit Target 61.8% Fibonacci resistance level had been reached. There is nothing at all magical about this particular Fibonacci level; it is just that the USD/JPY is a popularly traded currency pair and I would not have been the only analyst stalking this particular breakout move. Many traders would have been watching for this range-breakout and the 61.8% level is a popular level and this target would have been applied by many traders. This is nothing more than an example of herd mentality at work.
USD/JPY 4hr: This chart was posted on Twitter on May 4th 2021. Note how price action did pause right at the 61.8% Fibonacci and then reversed.
The overall gain from this wedge breakout move was about 140 pips. This represented an approximate 7-fold gain, assuming a STOP of 20 pips was used. This would have been a very satisfactory Risk: Reward trade for any trader who caught this particular breakout move.
Concluding comments: My experience has been that the Descending Wedge is one of the most reliable charting patterns. I encourage all traders and investors to consider searching for these congestion style patterns when carrying out any technical charting analysis. Practice monitoring for any bullish mean-reversion breakout and mapping these with a Fibonacci retracement tool.
Watching for Descending Wedge trend line breakouts and applying Fibonacci retracement, to help identify potential targets, can be a very successful way to exercise Technical Analysis.