The following examples show how the target 61.8% Fibonacci was reached following breakouts from bullish-reversal descending wedge patterns.
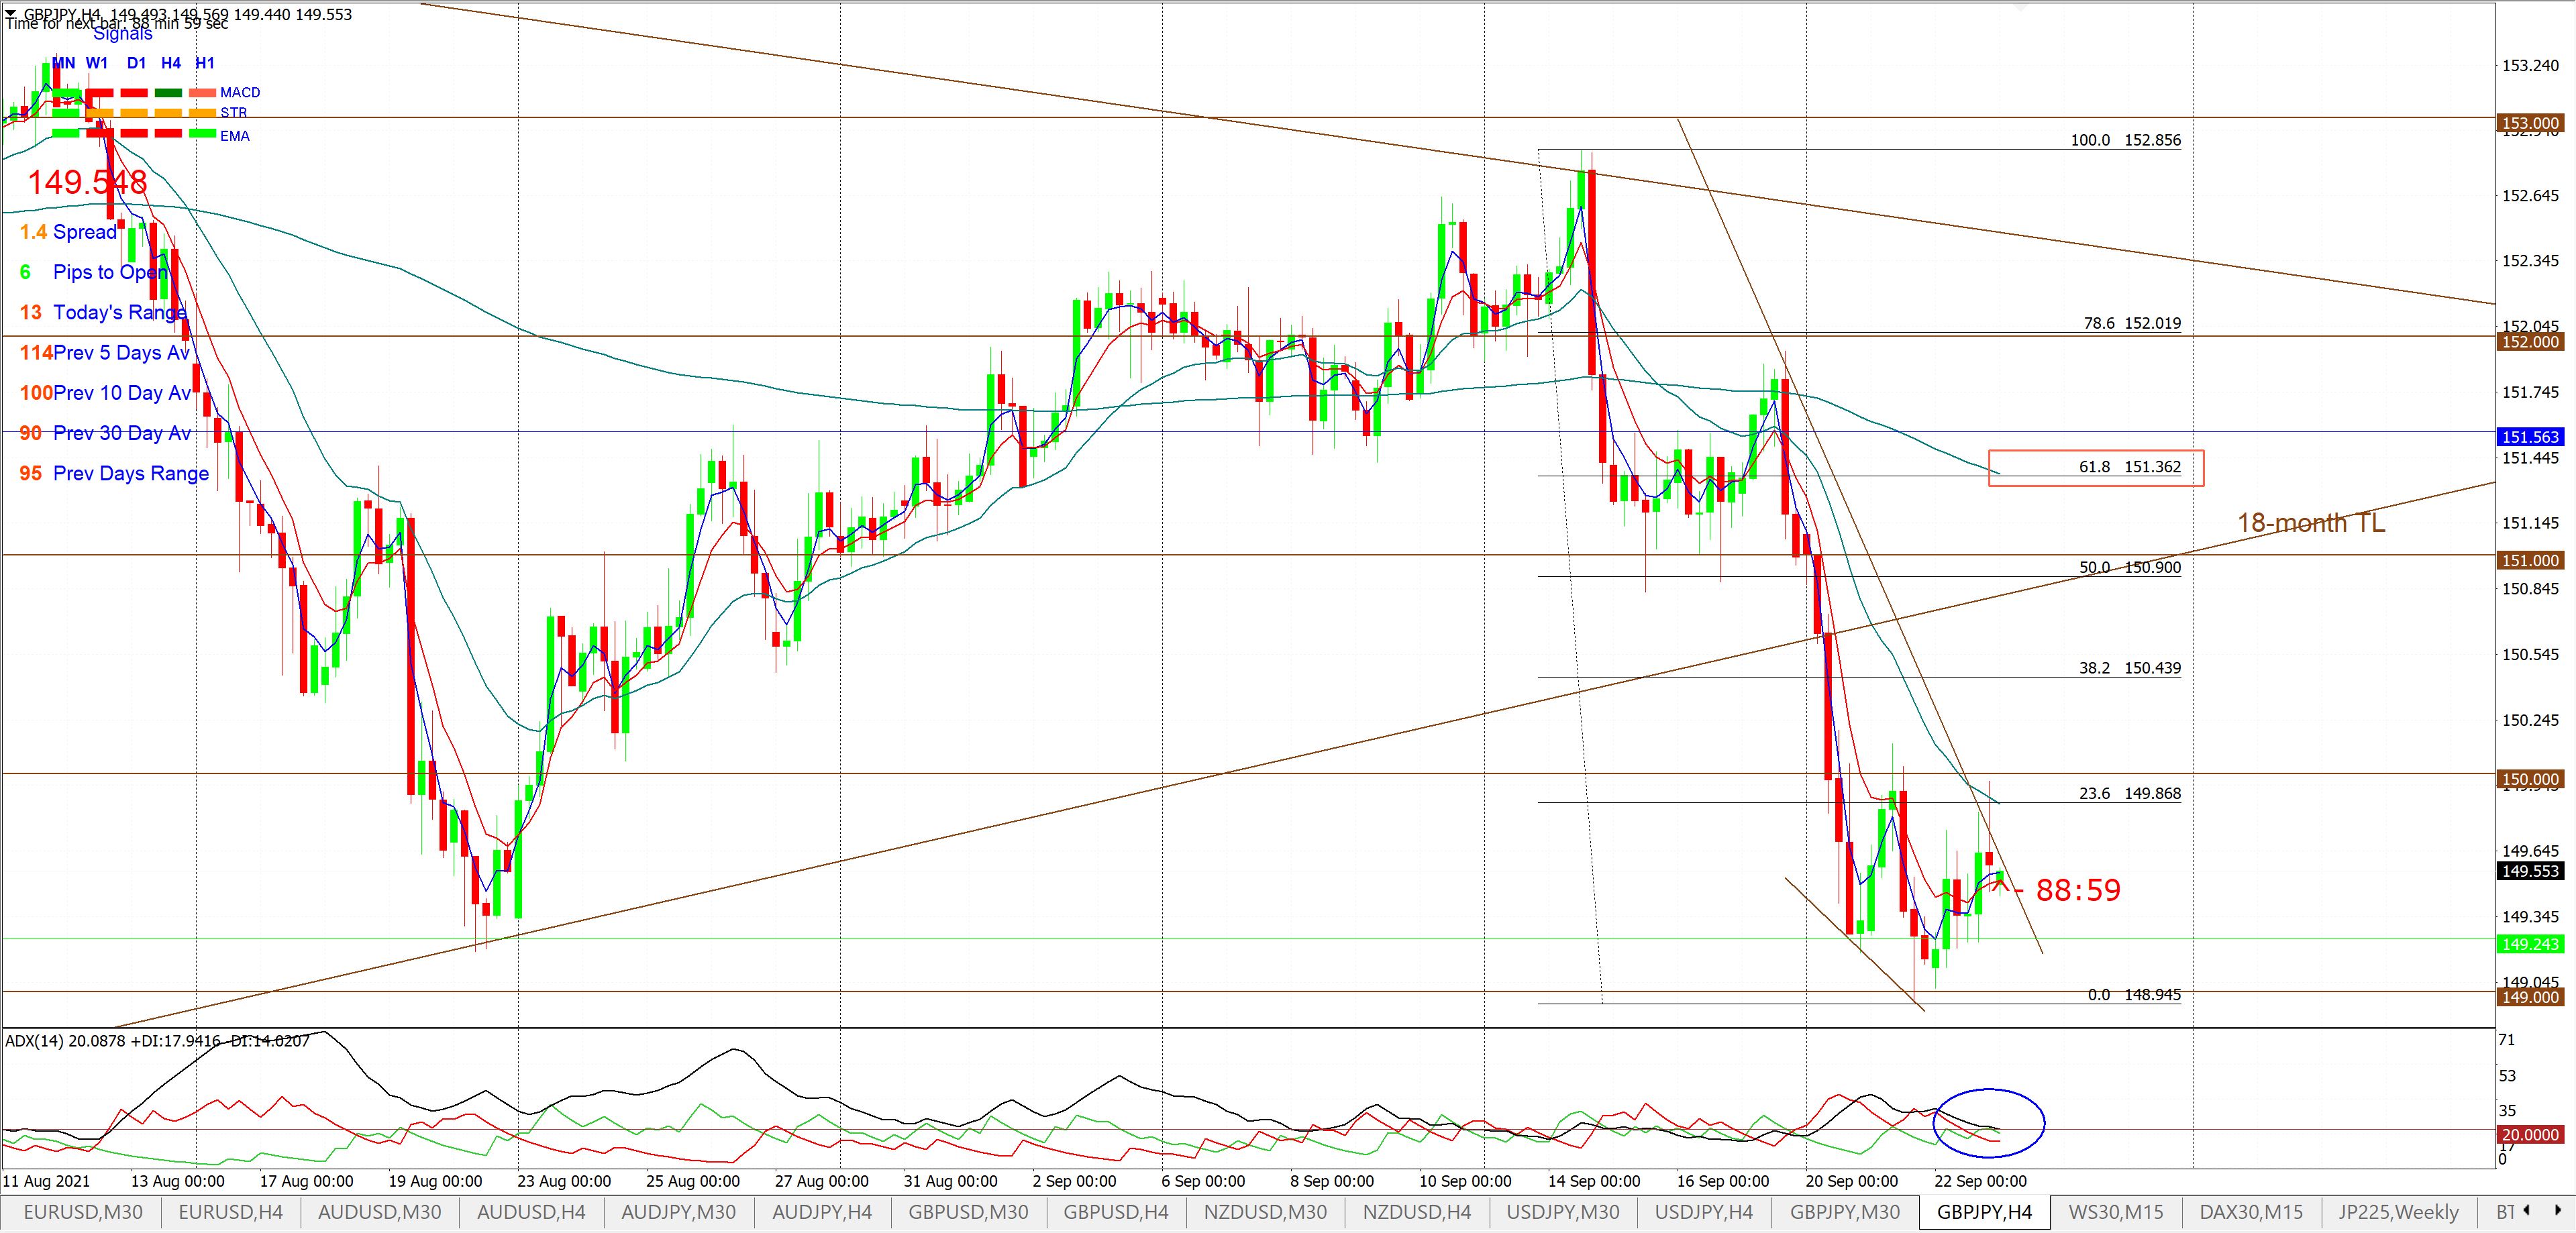
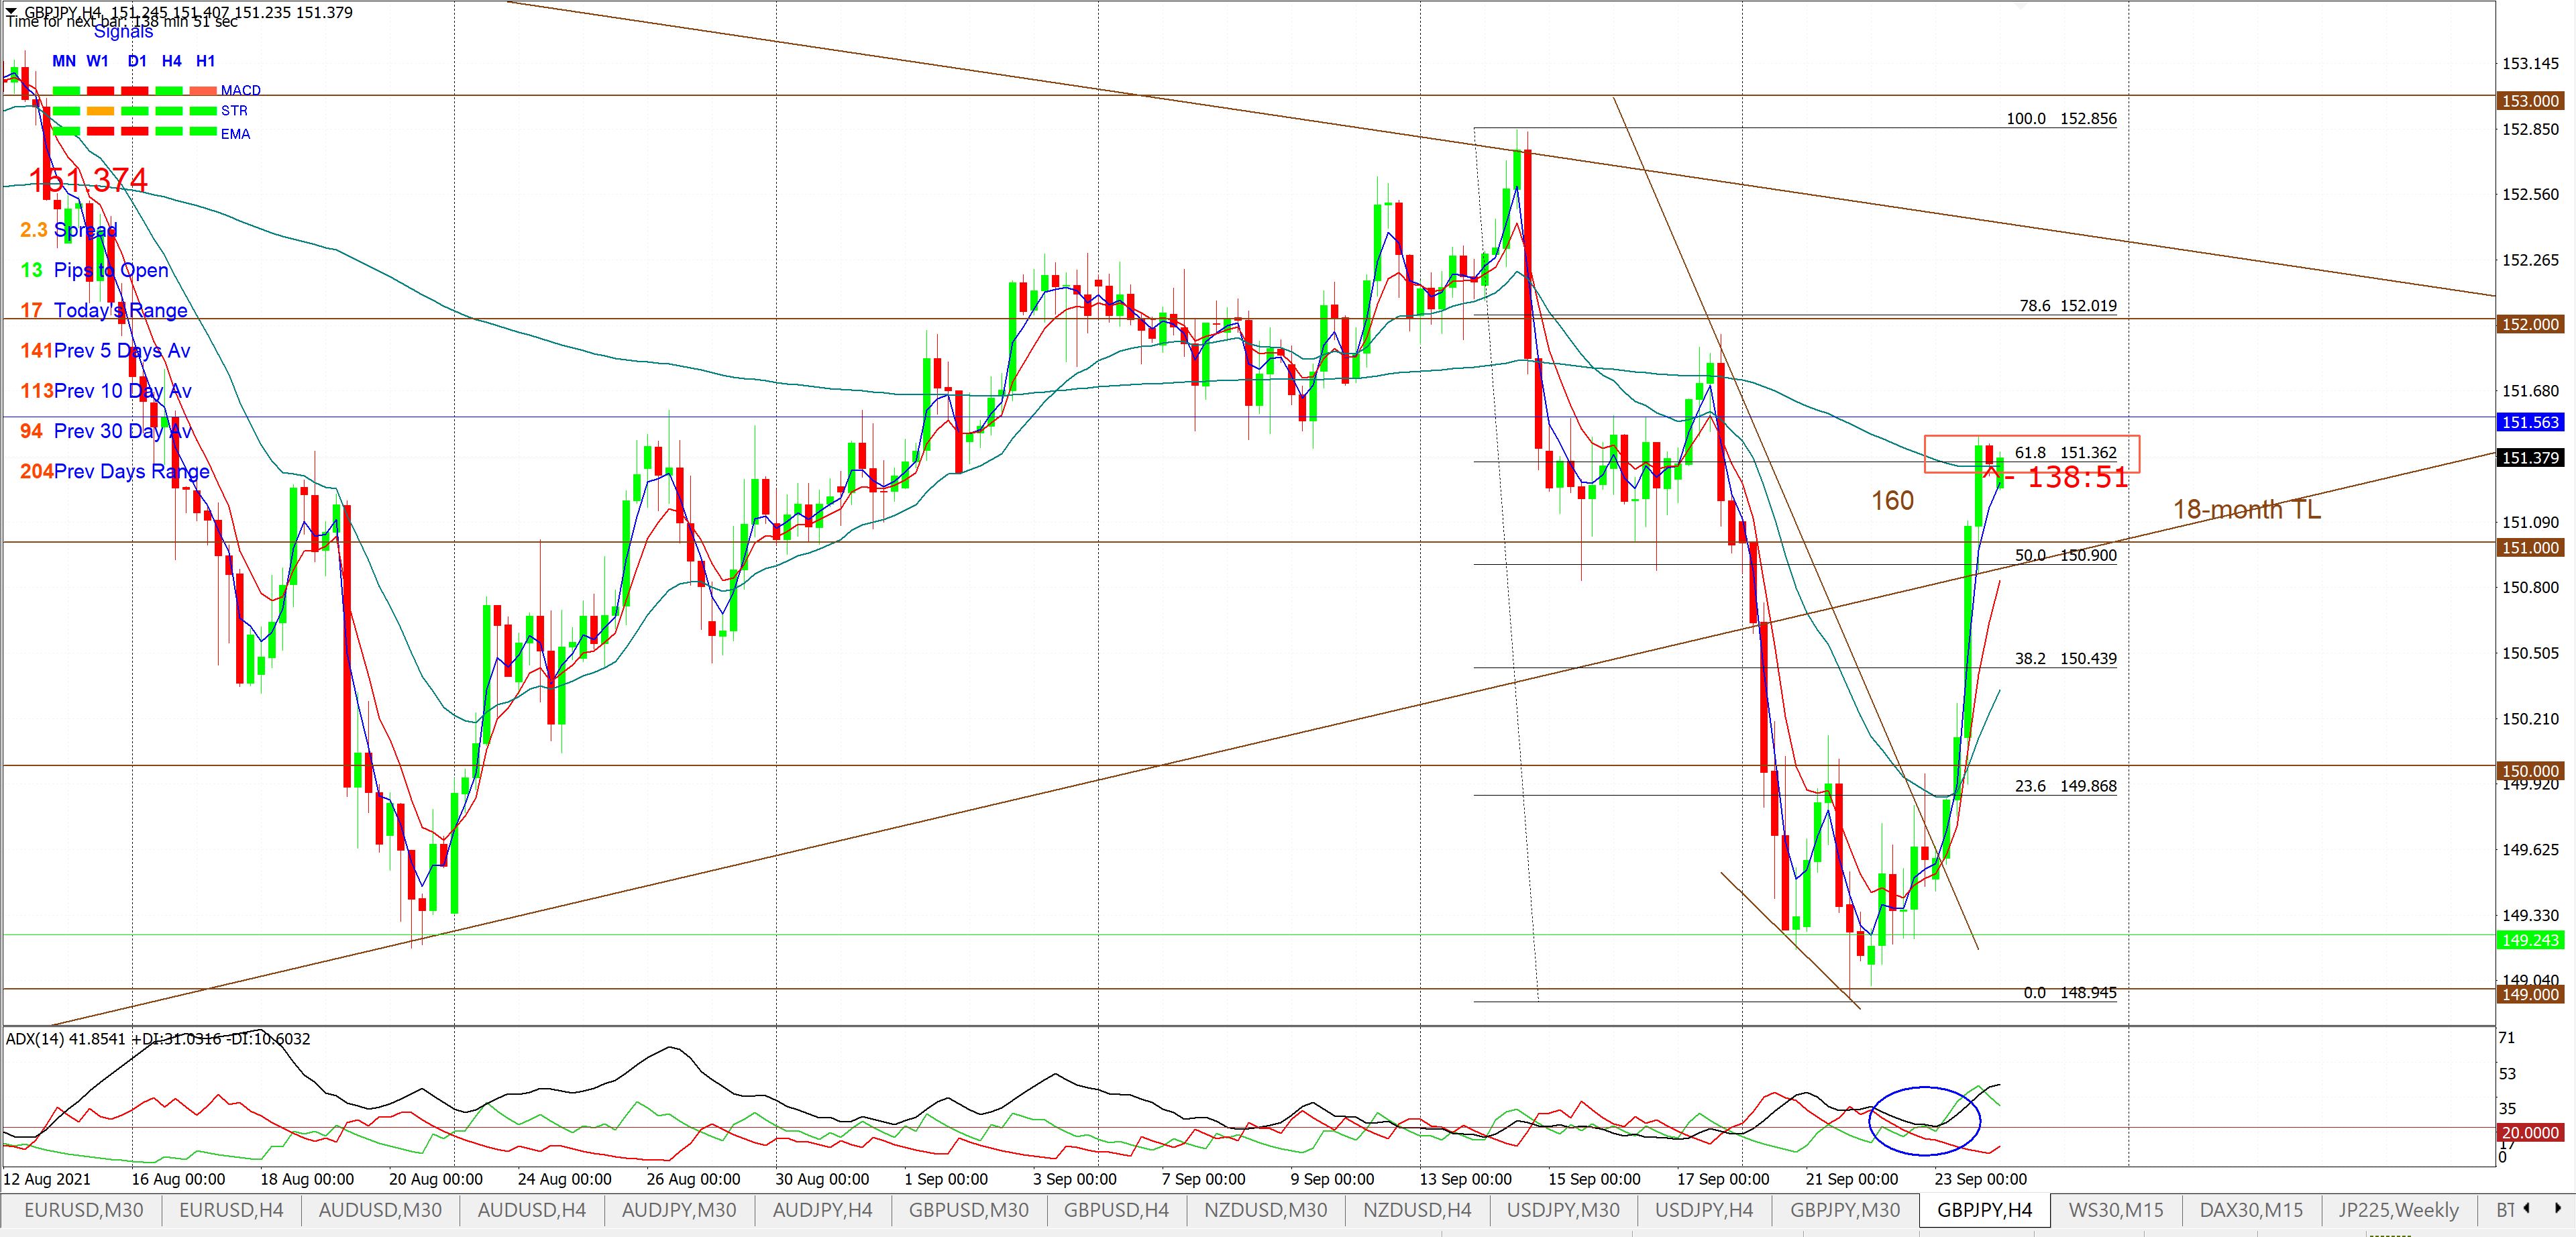
- GBP/JPY: This 4hr chart descending wedge was posted on Thursday 23rd September in daily update and on Twitter. The breakout came in the following trading session and look where price reached! The 61.8% Fibonacci target!
GBP/JPY 4hr: the descending wedge as posted on Twitter:
GBP/JPY 4hr: the descending wedge b/o after reaching the 61.8% Fibonacci:
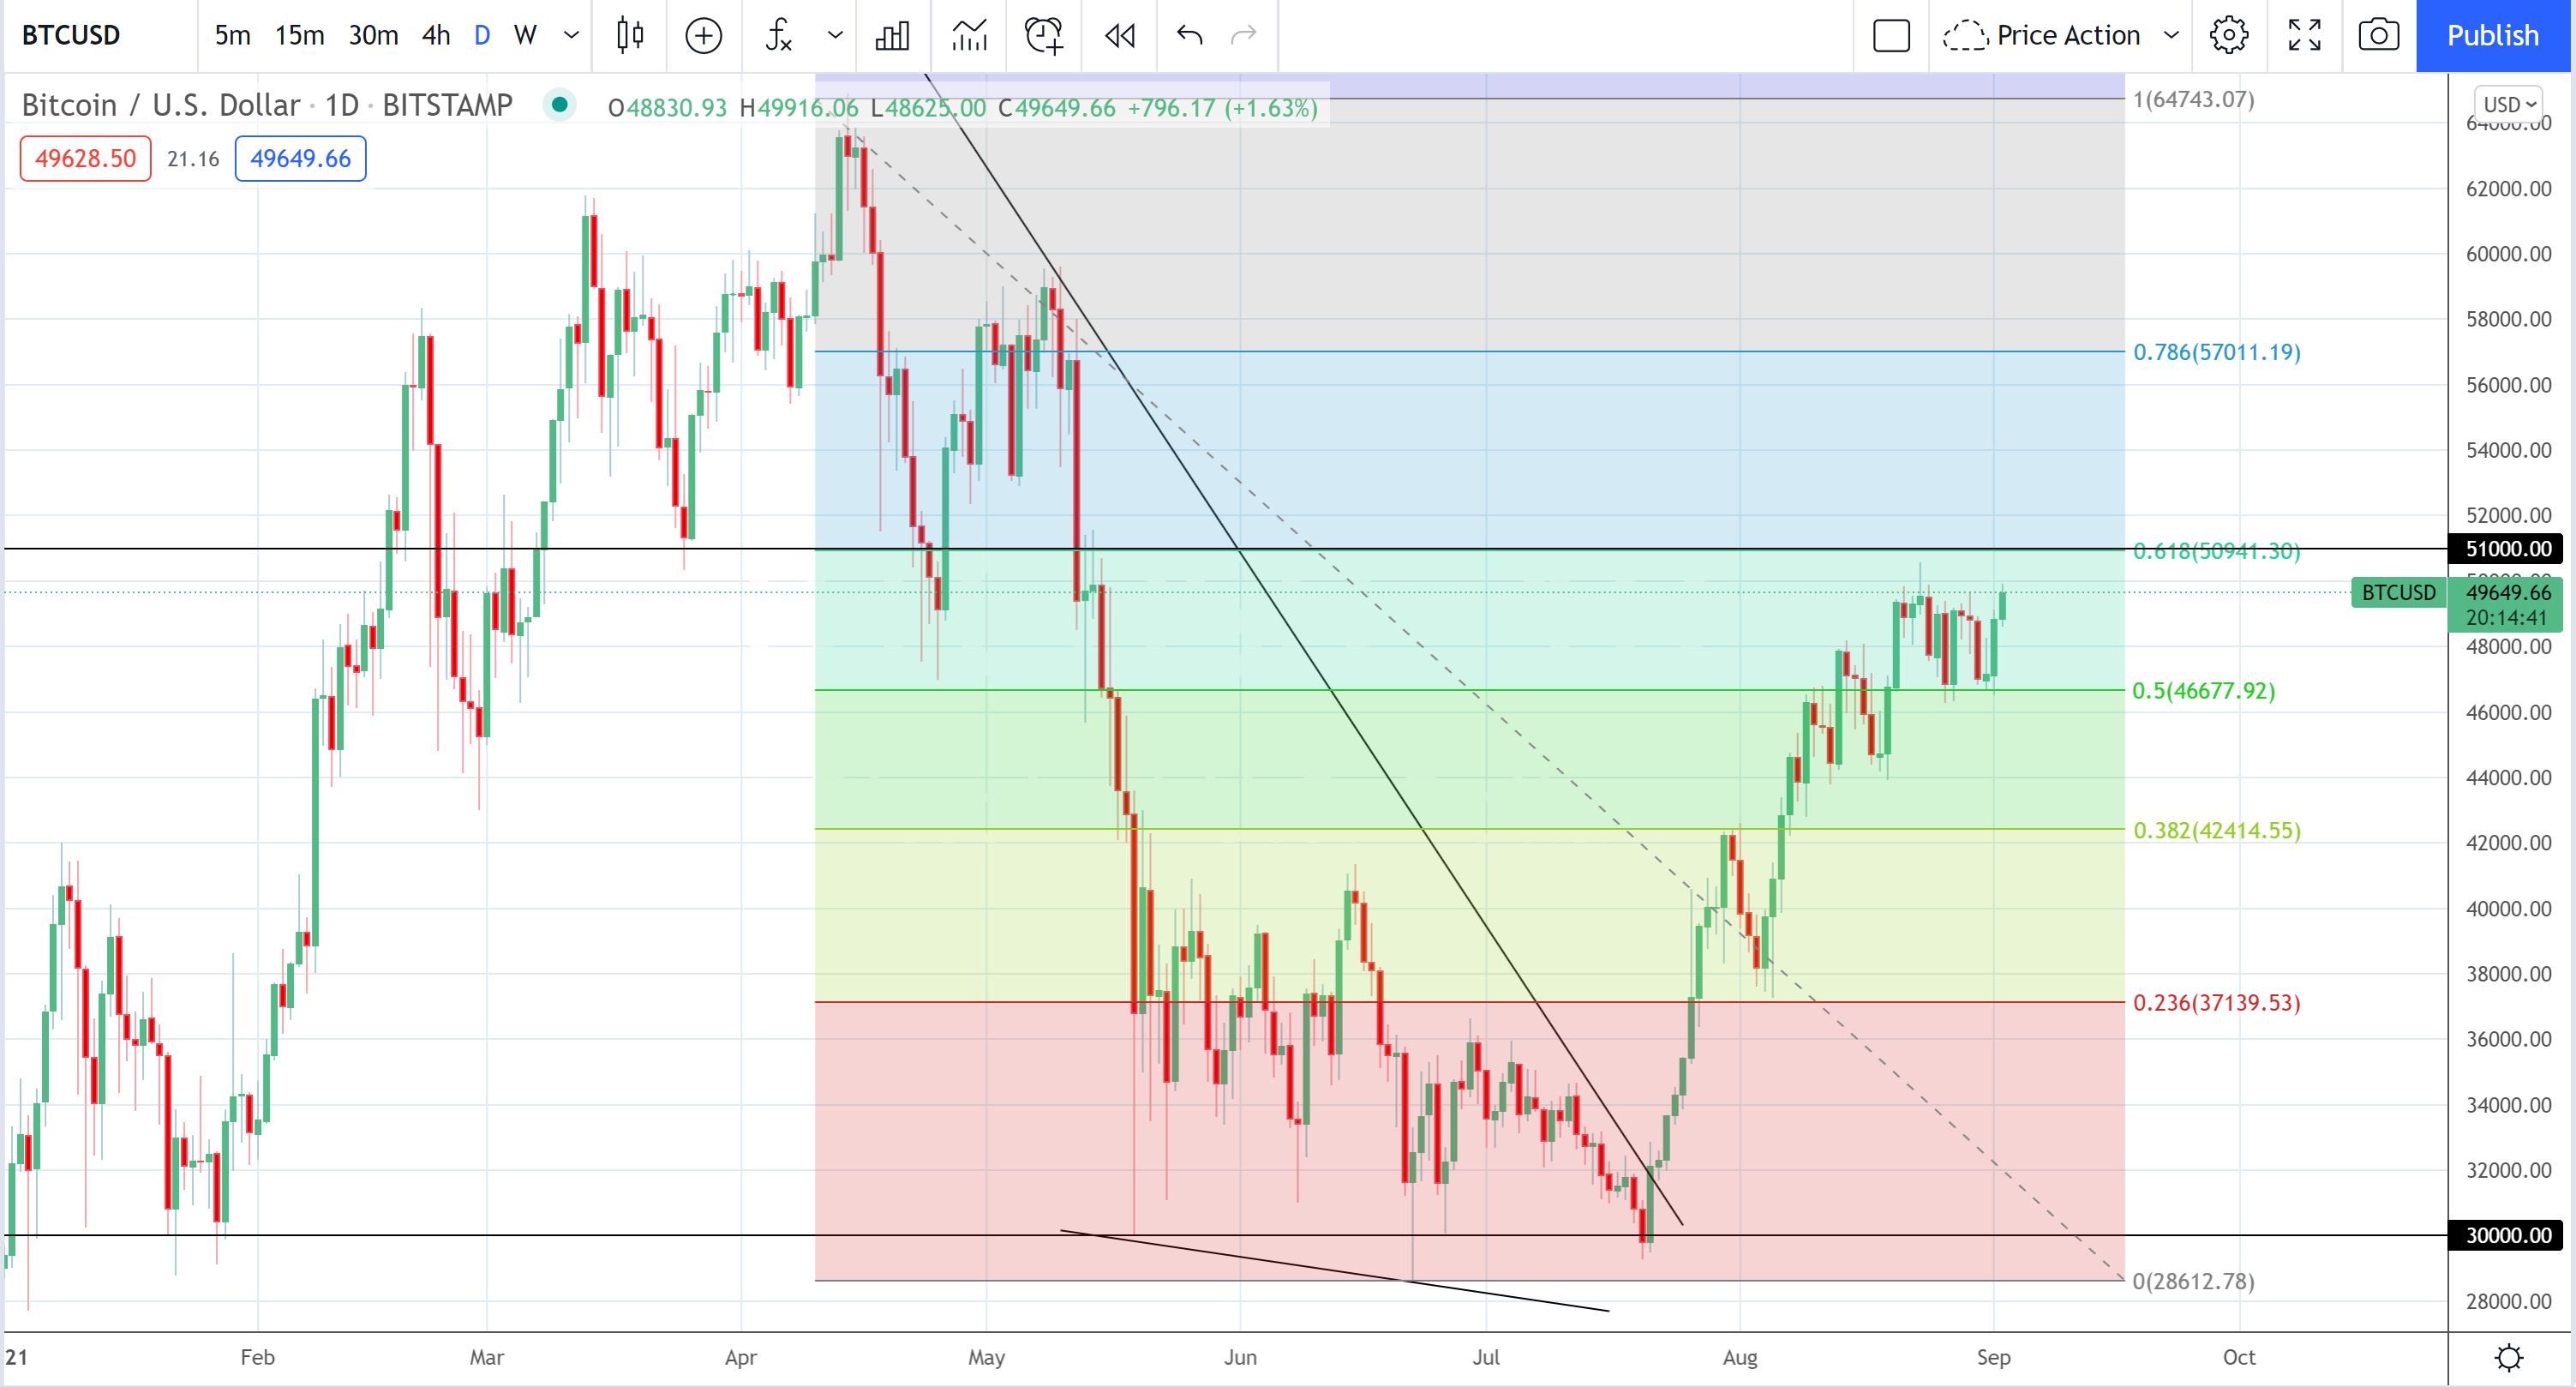
- BTC/USD: A Descending Wedge shaped up on BTC/USD during early 2021 as the weekly chart below reveals. Note how this pullback paused just above the weekly 61.8% Fibonacci level. The wedge breakout triggered in late July and was supported by a Volume breakout as well:
BTC/USD weekly: a descending wedge formed here during early 2021:
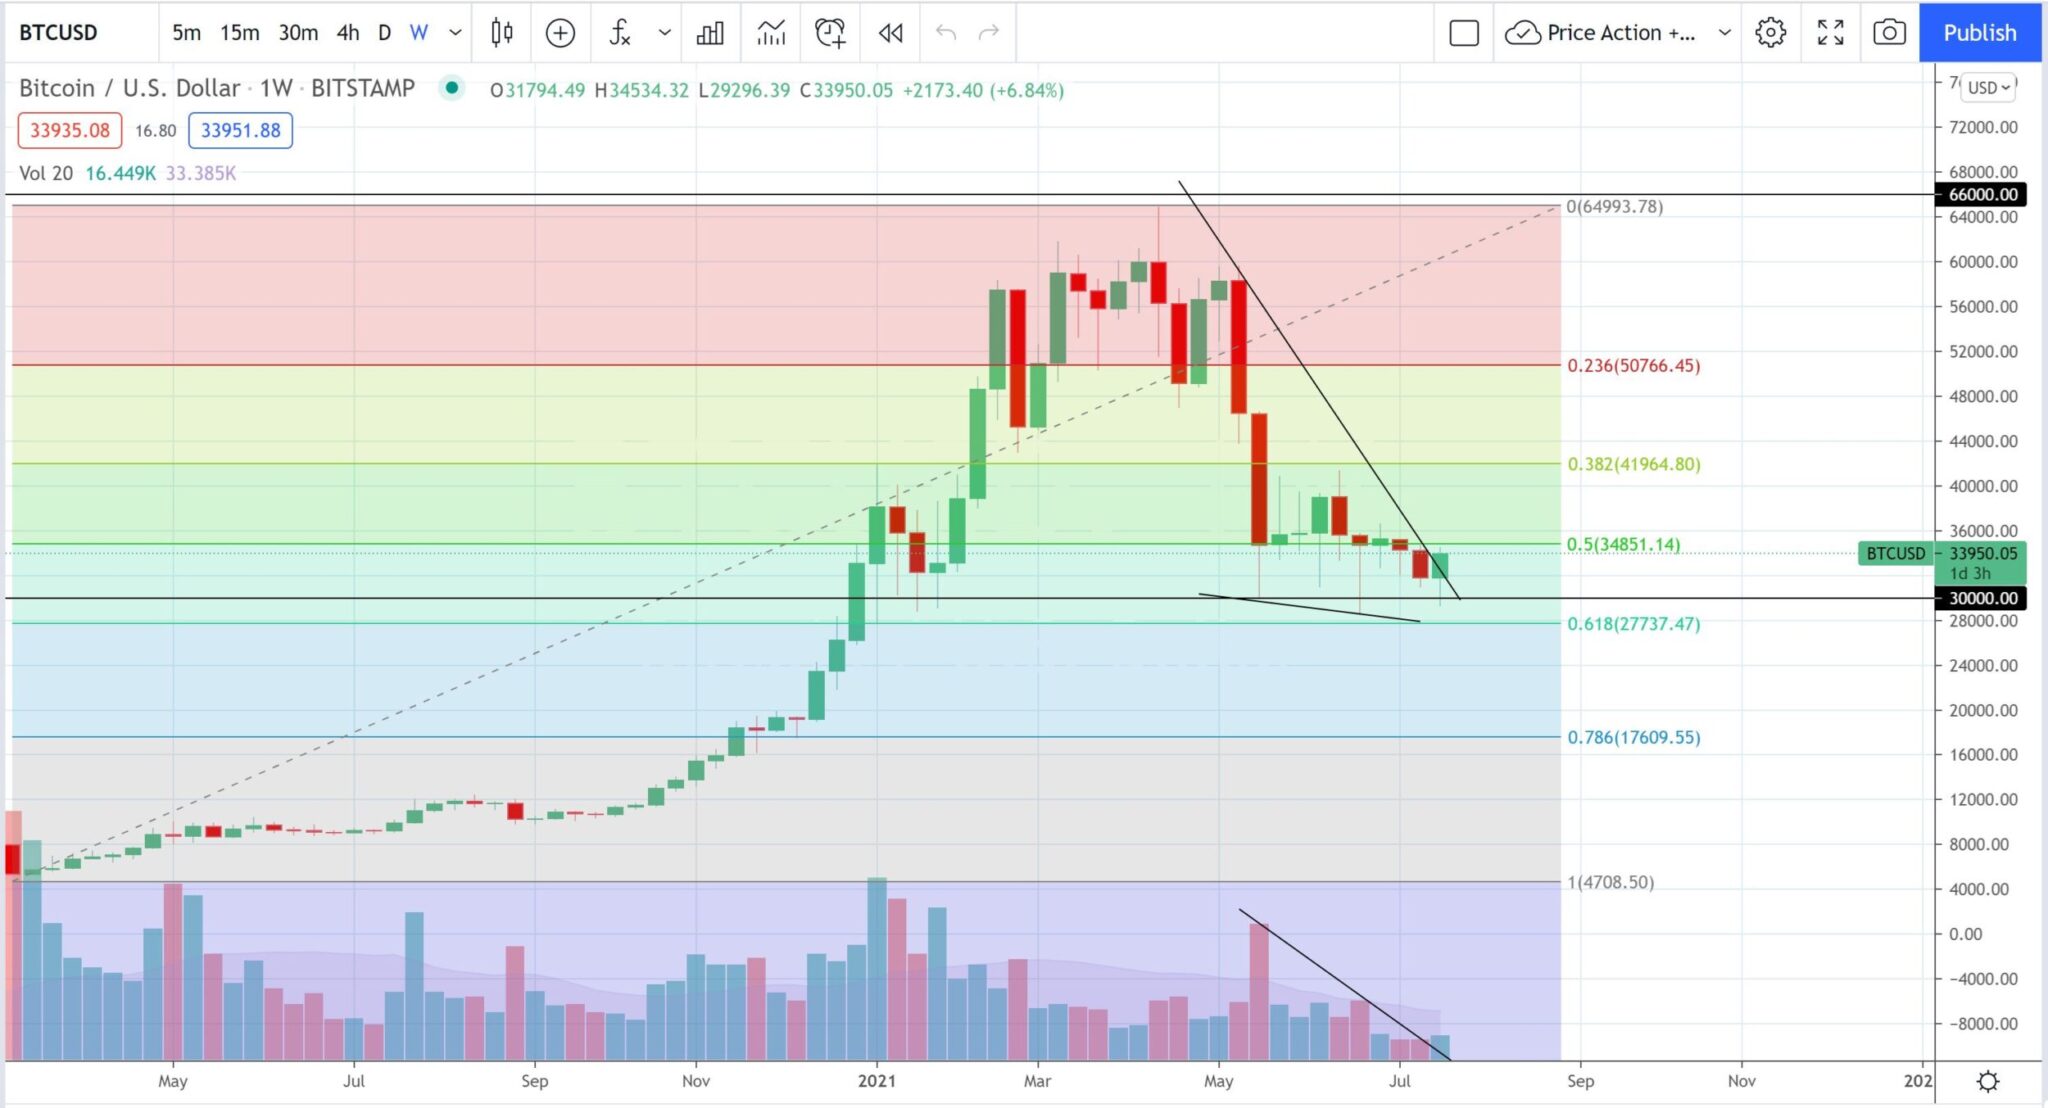
BTC/USD daily: note how this wedge b/o paused at daily 61.8% Fibonacci:
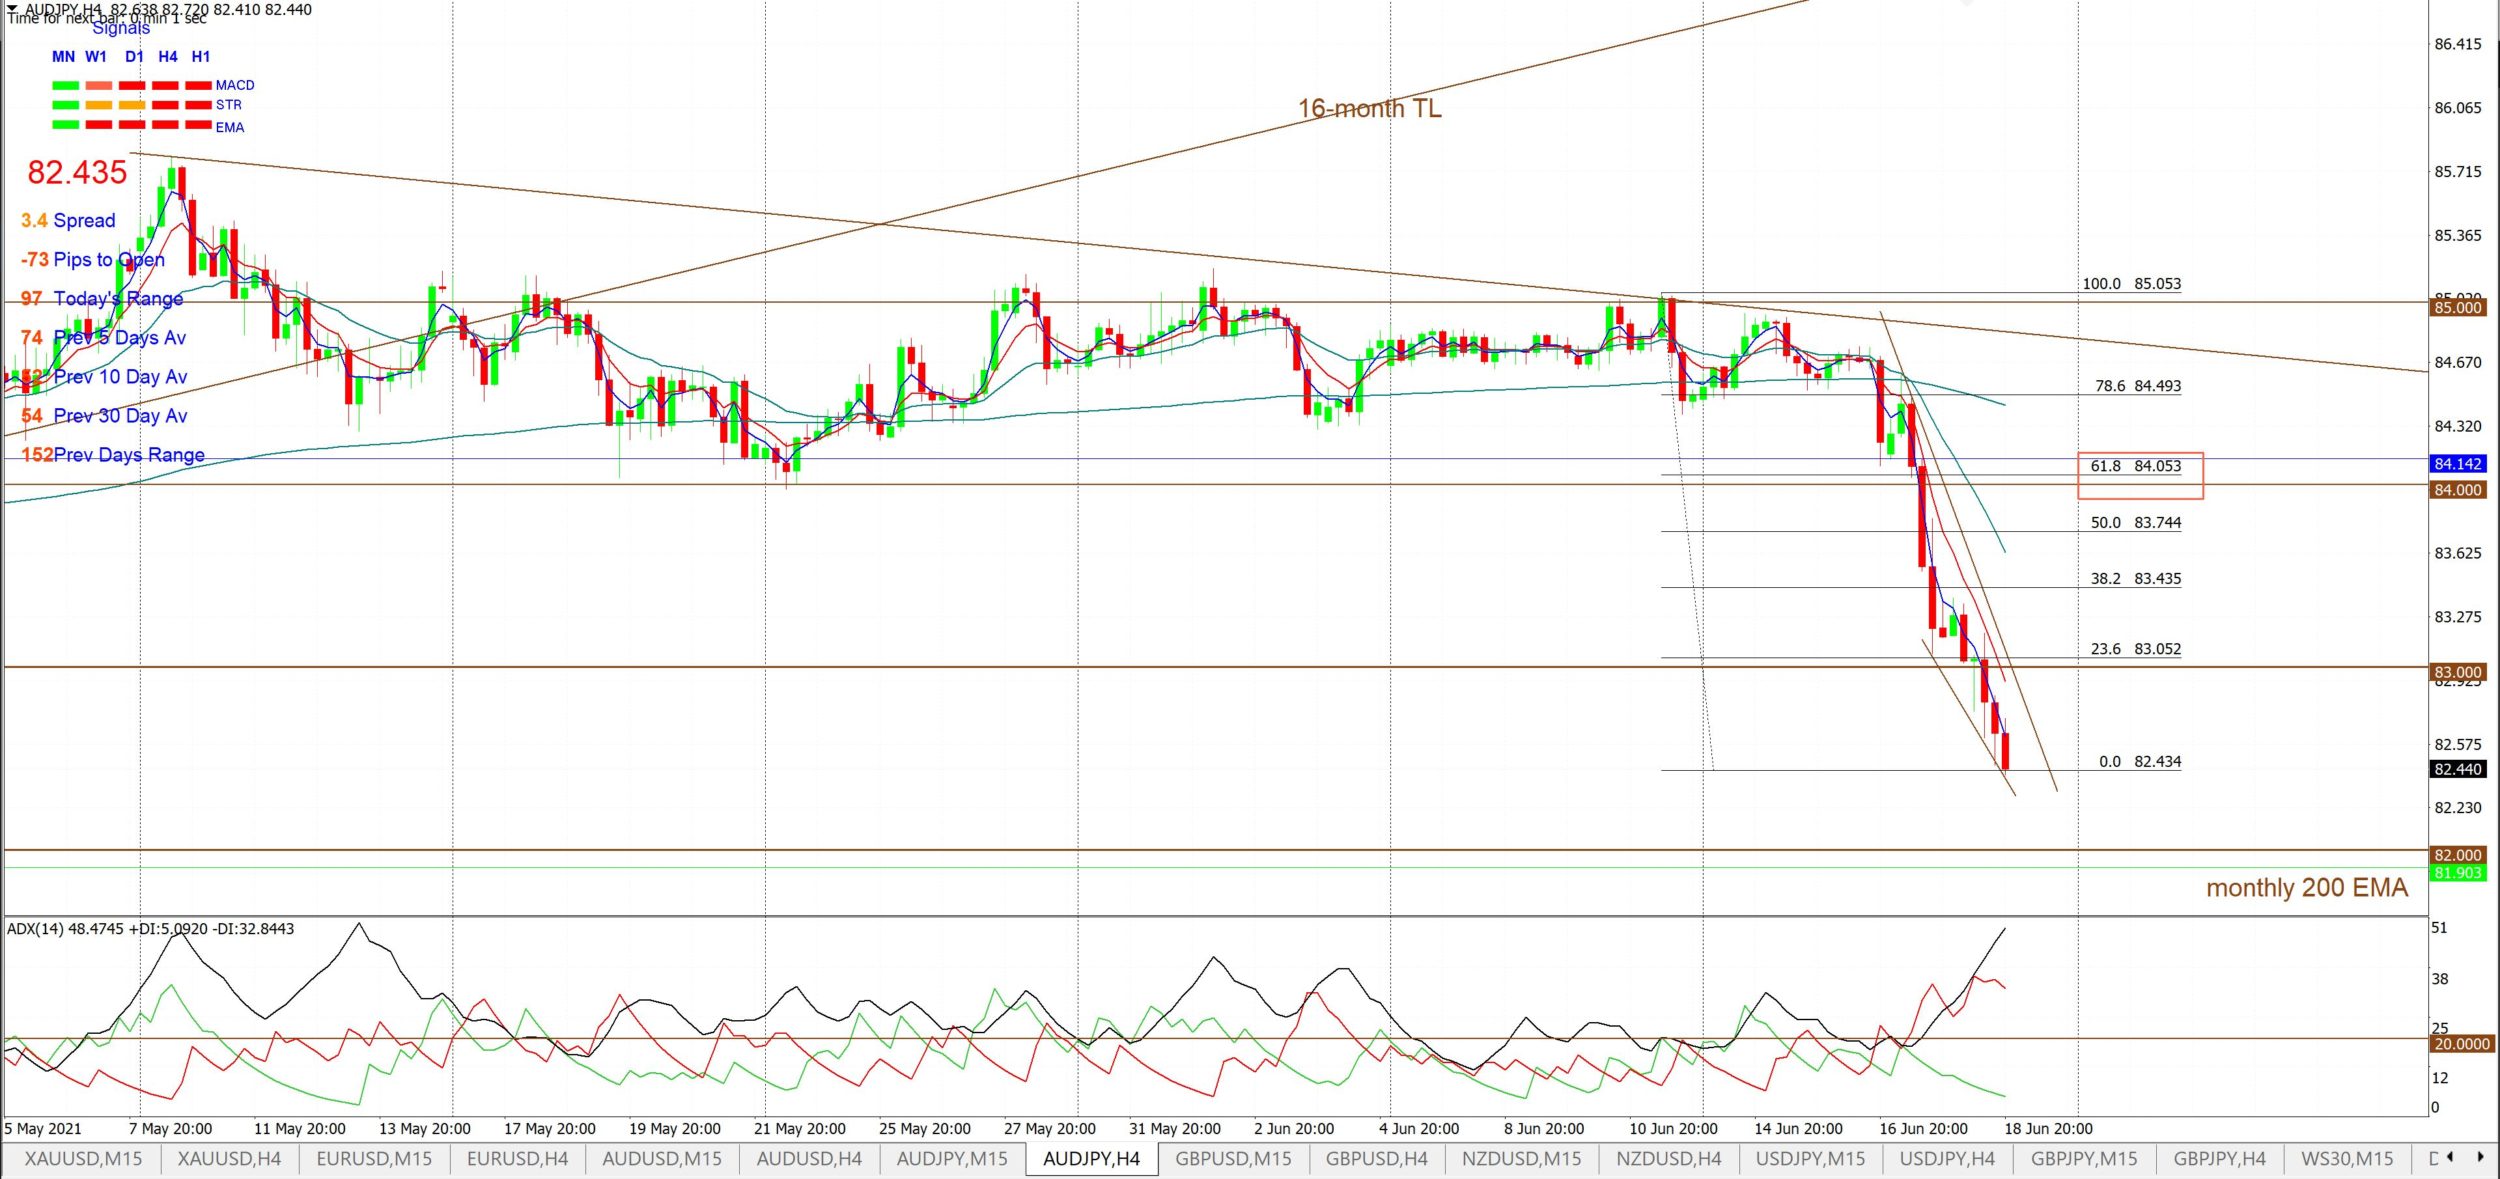
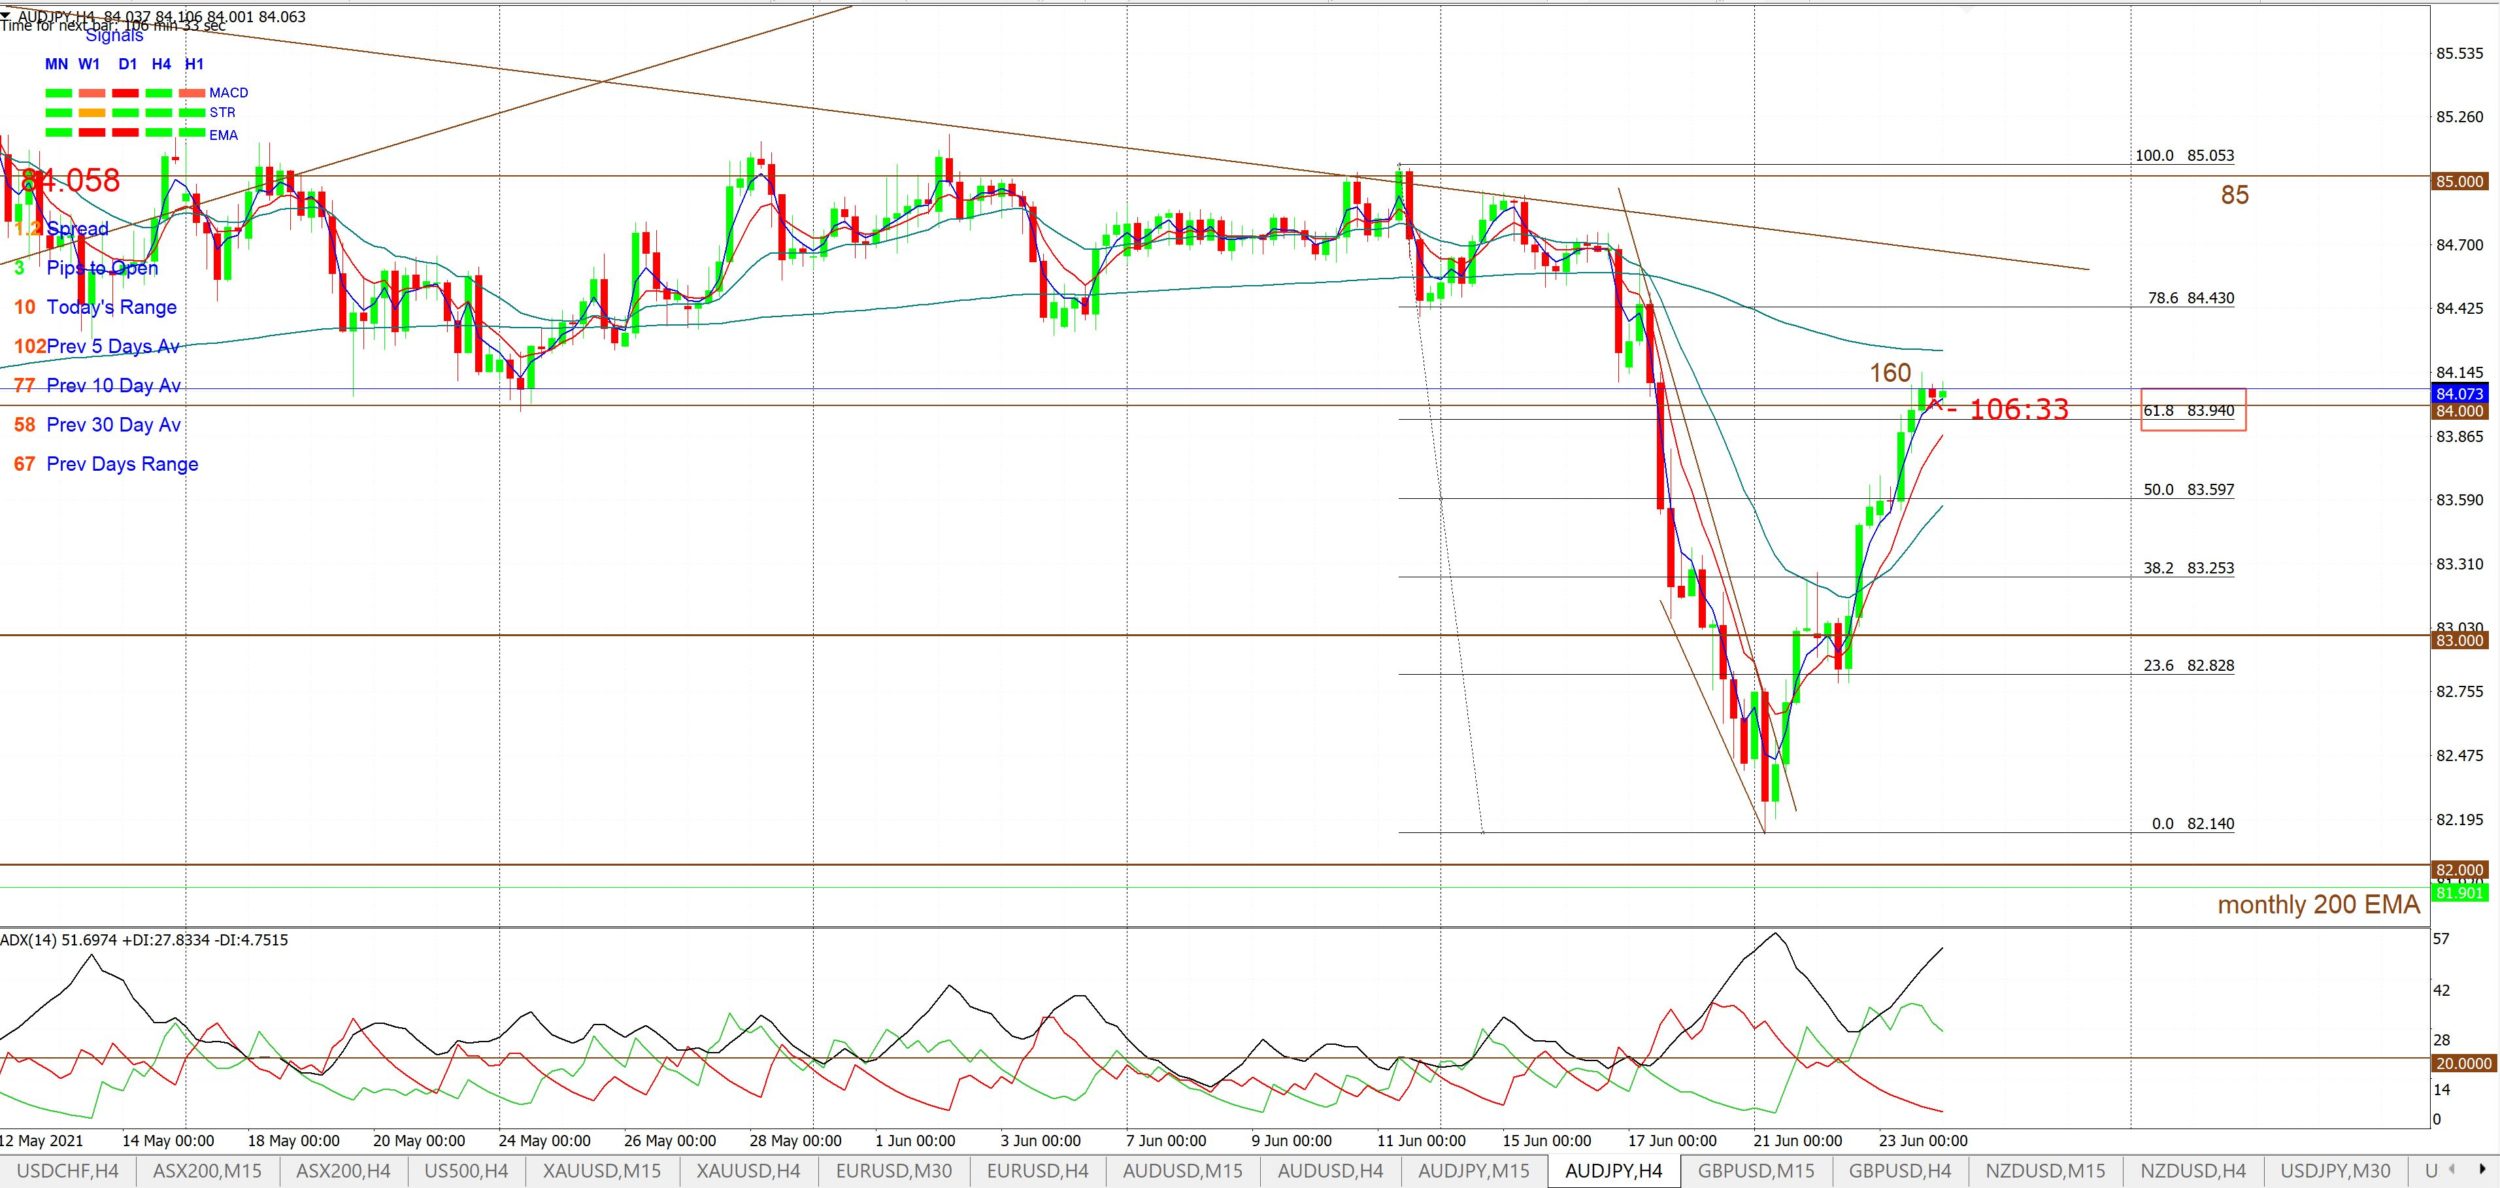
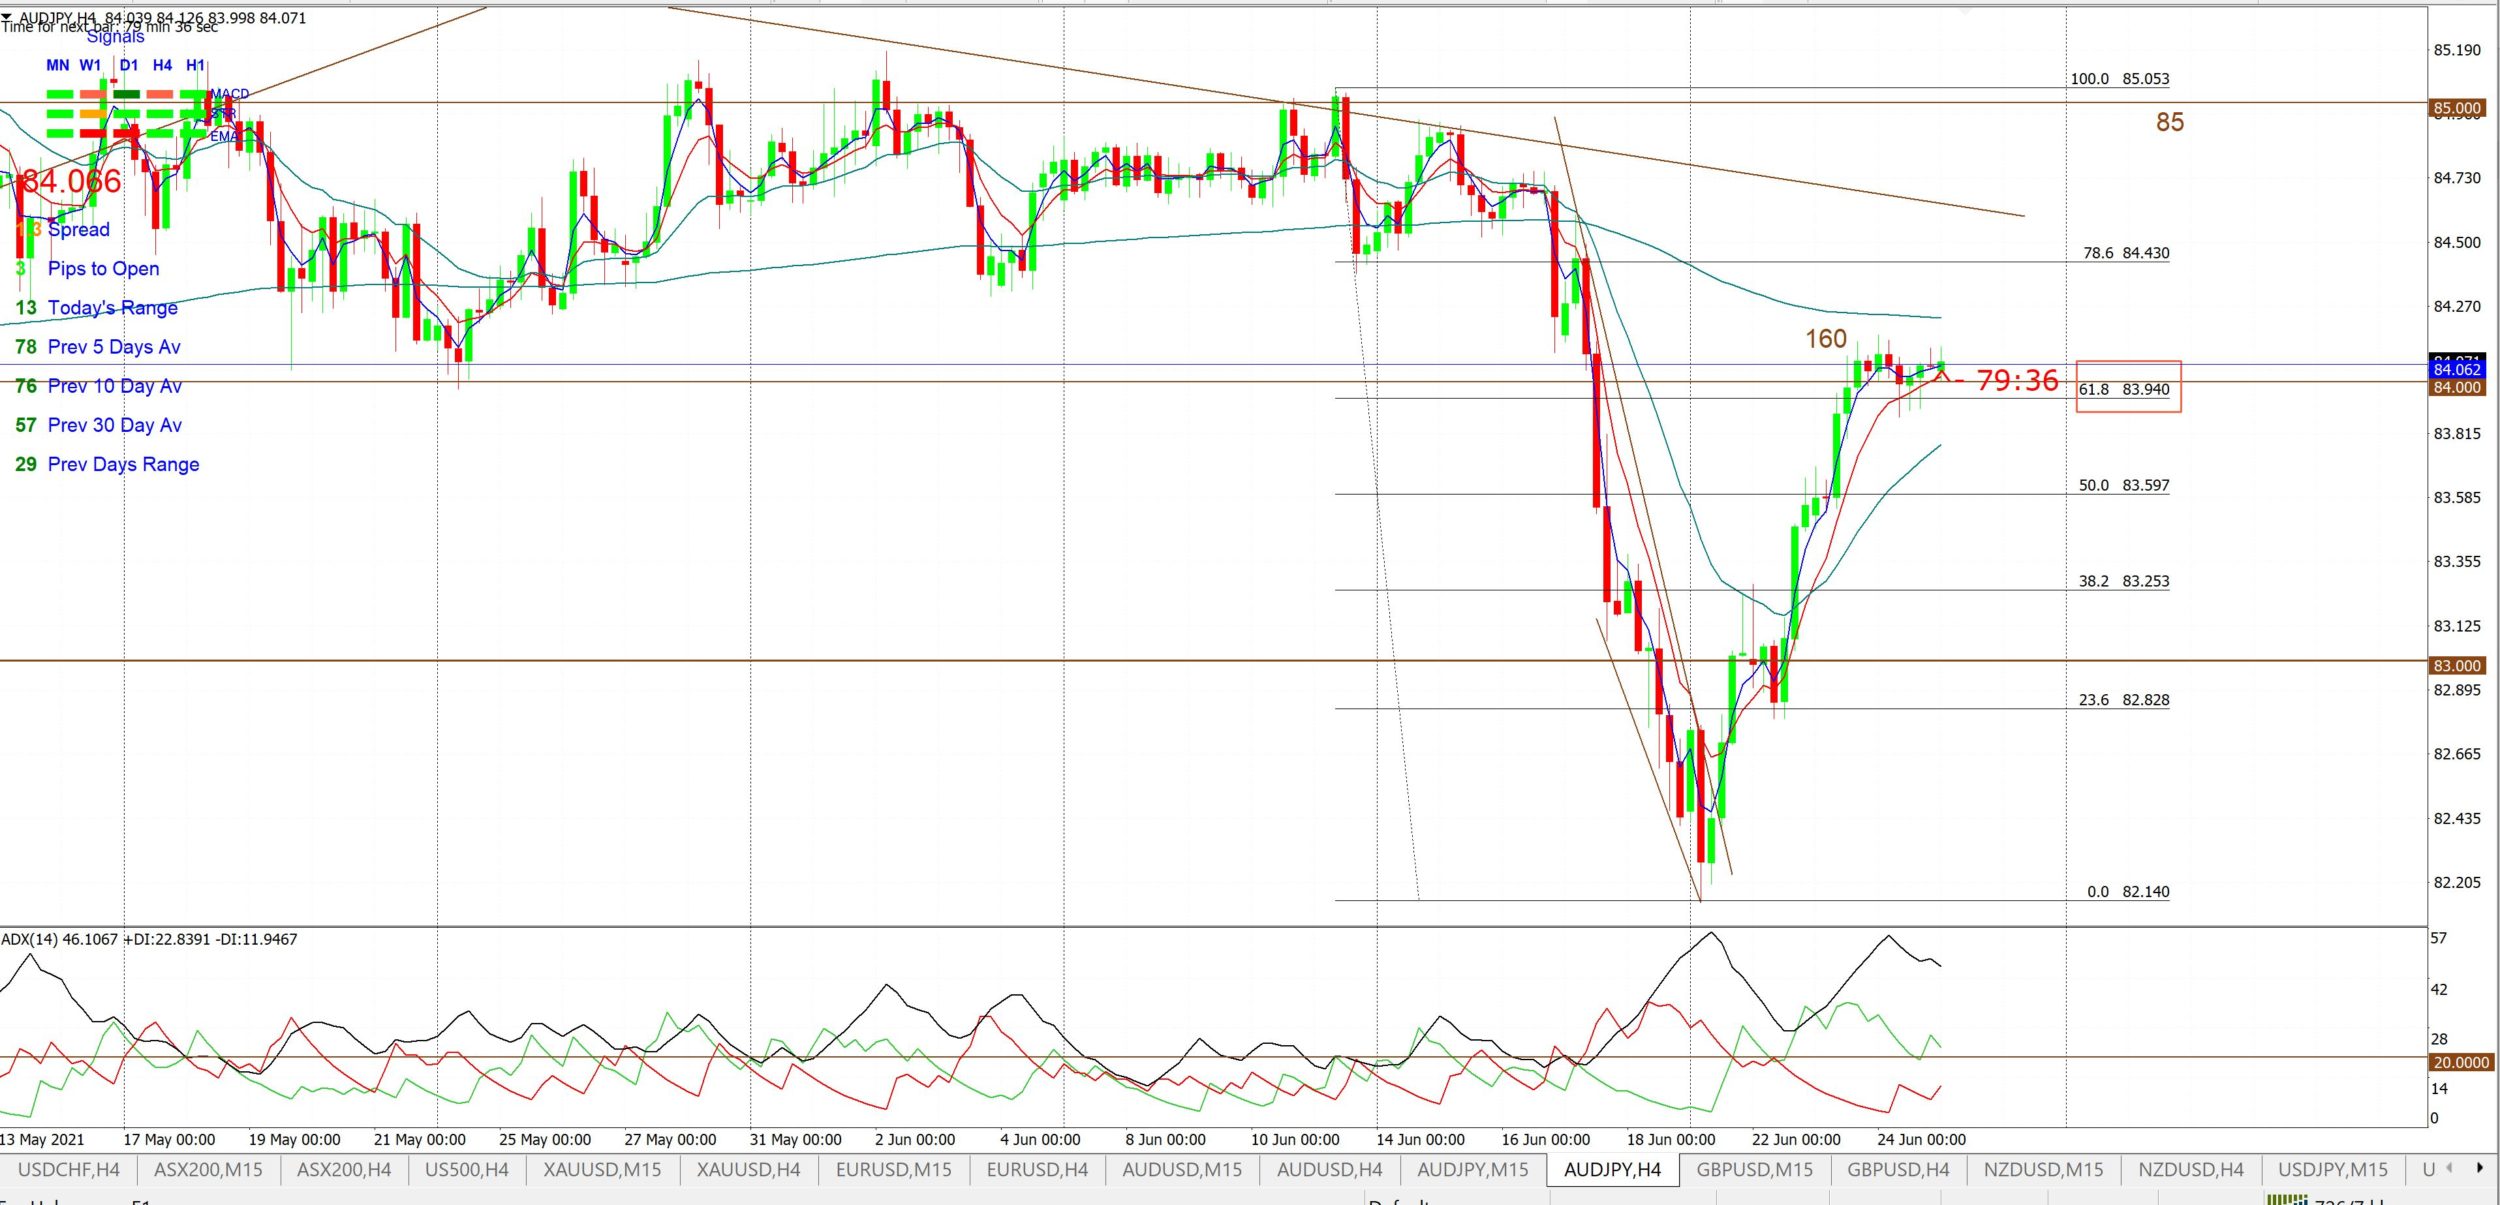
- AUD/JPY: note how this descending wedge retraced to the 61.8% Fibonacci; for around 160 pips. Almost text book!
A/J 4hr: chart from the weekend update:
A/J 4hr: chart after the target 61.8% Fibonacci retracement was reached:
A/J 4hr: this is the chart on the following day showing how much clout the target 61.8% Fibonacci retracement can wield:
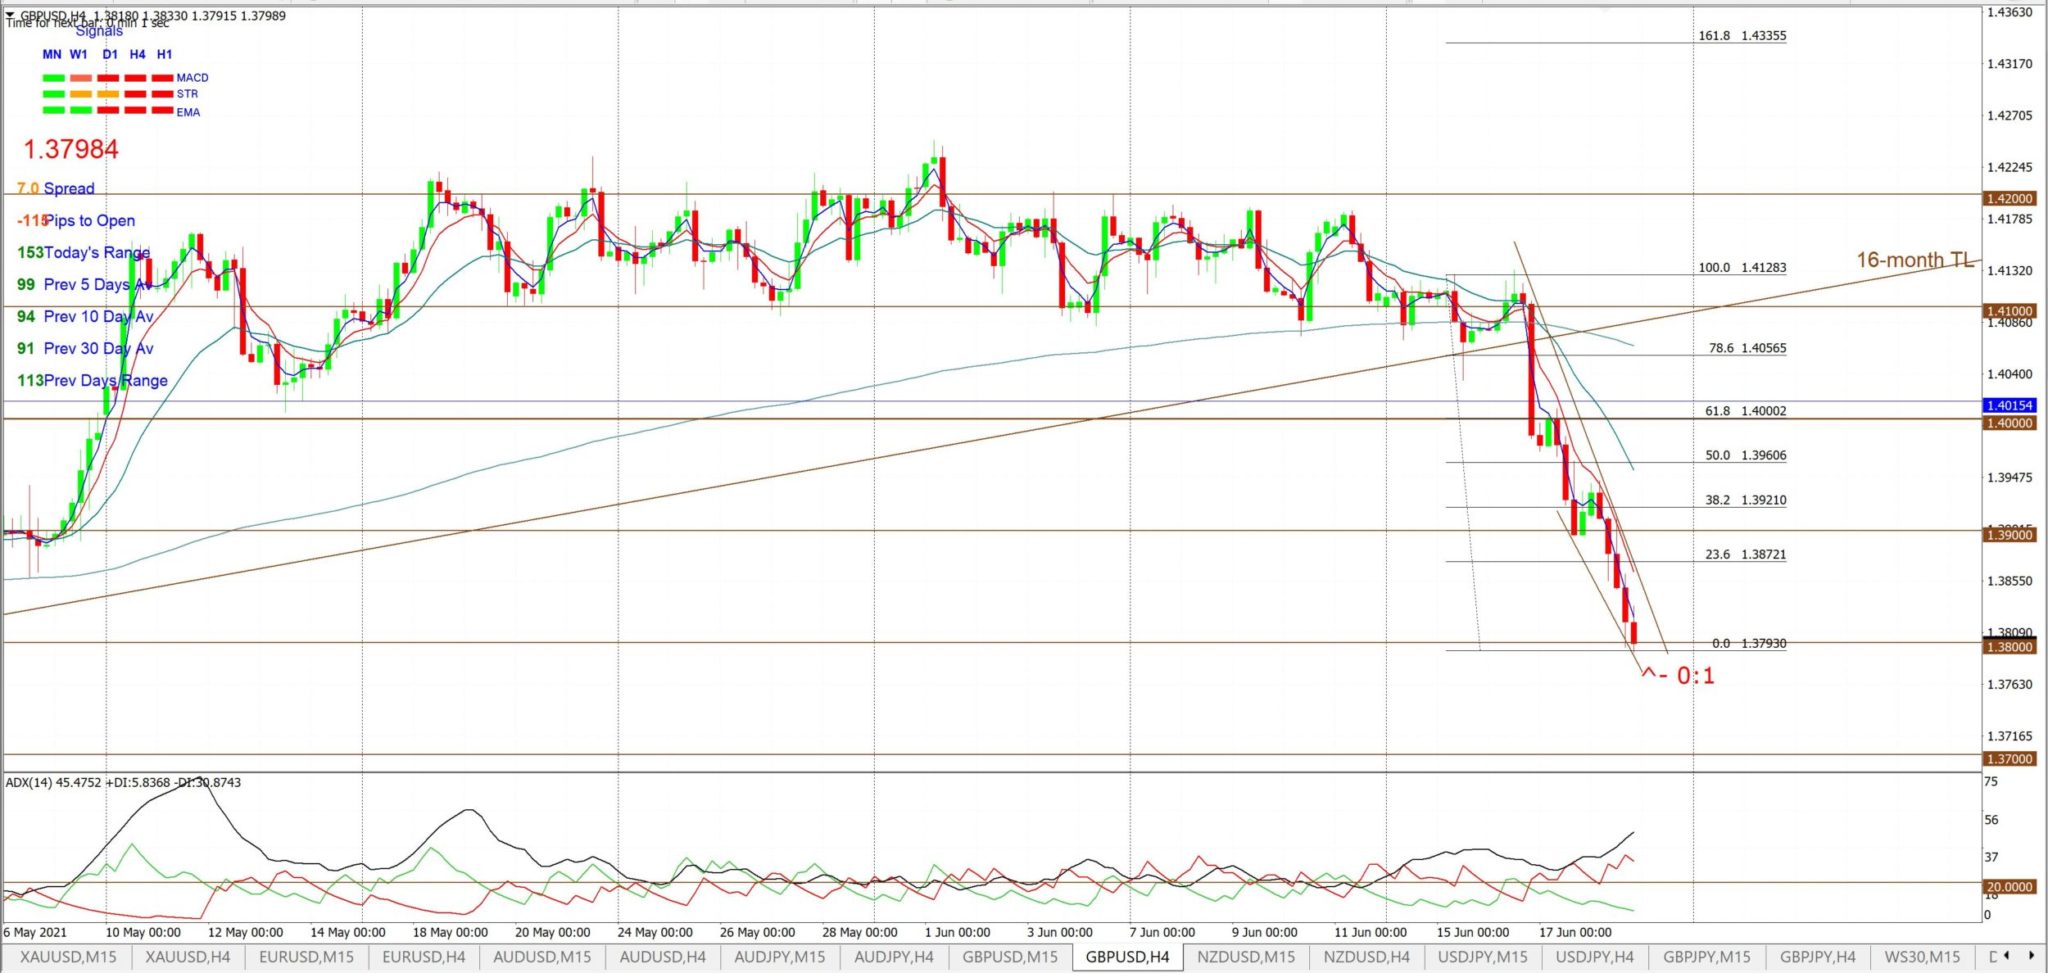
- GBP/USD: note how this descending wedge retraced to the 61.8% Fibonacci; for around 190 pips.
G/U 4hr: chart from the weekend update:
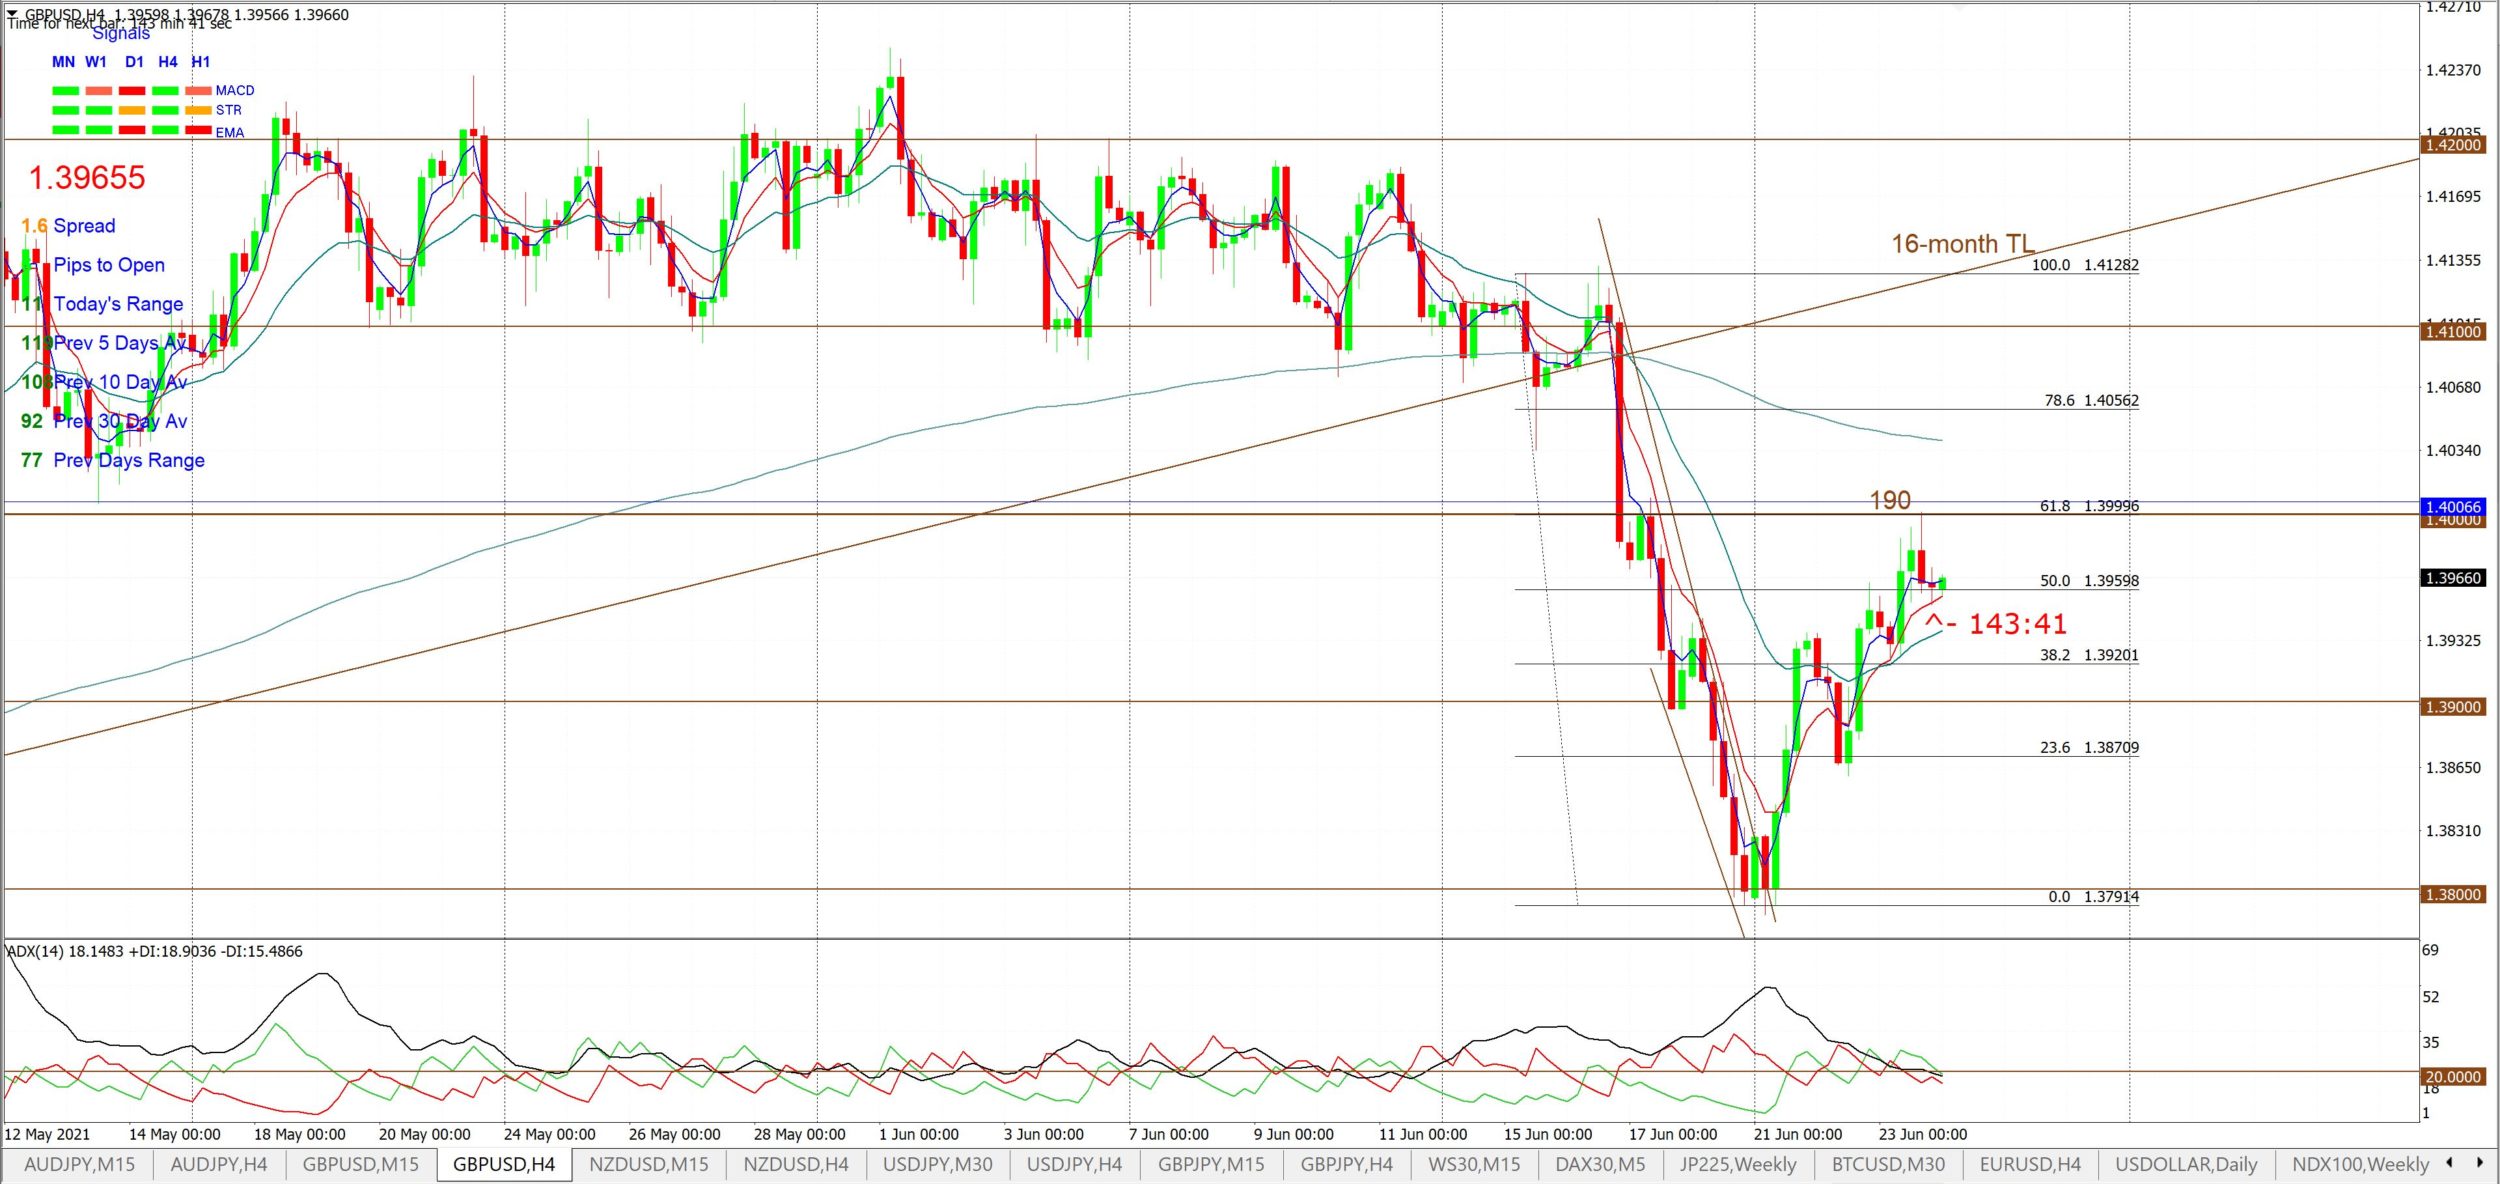
G/U 4hr: chart after the target 61.8% Fibonacci retracement was reached.
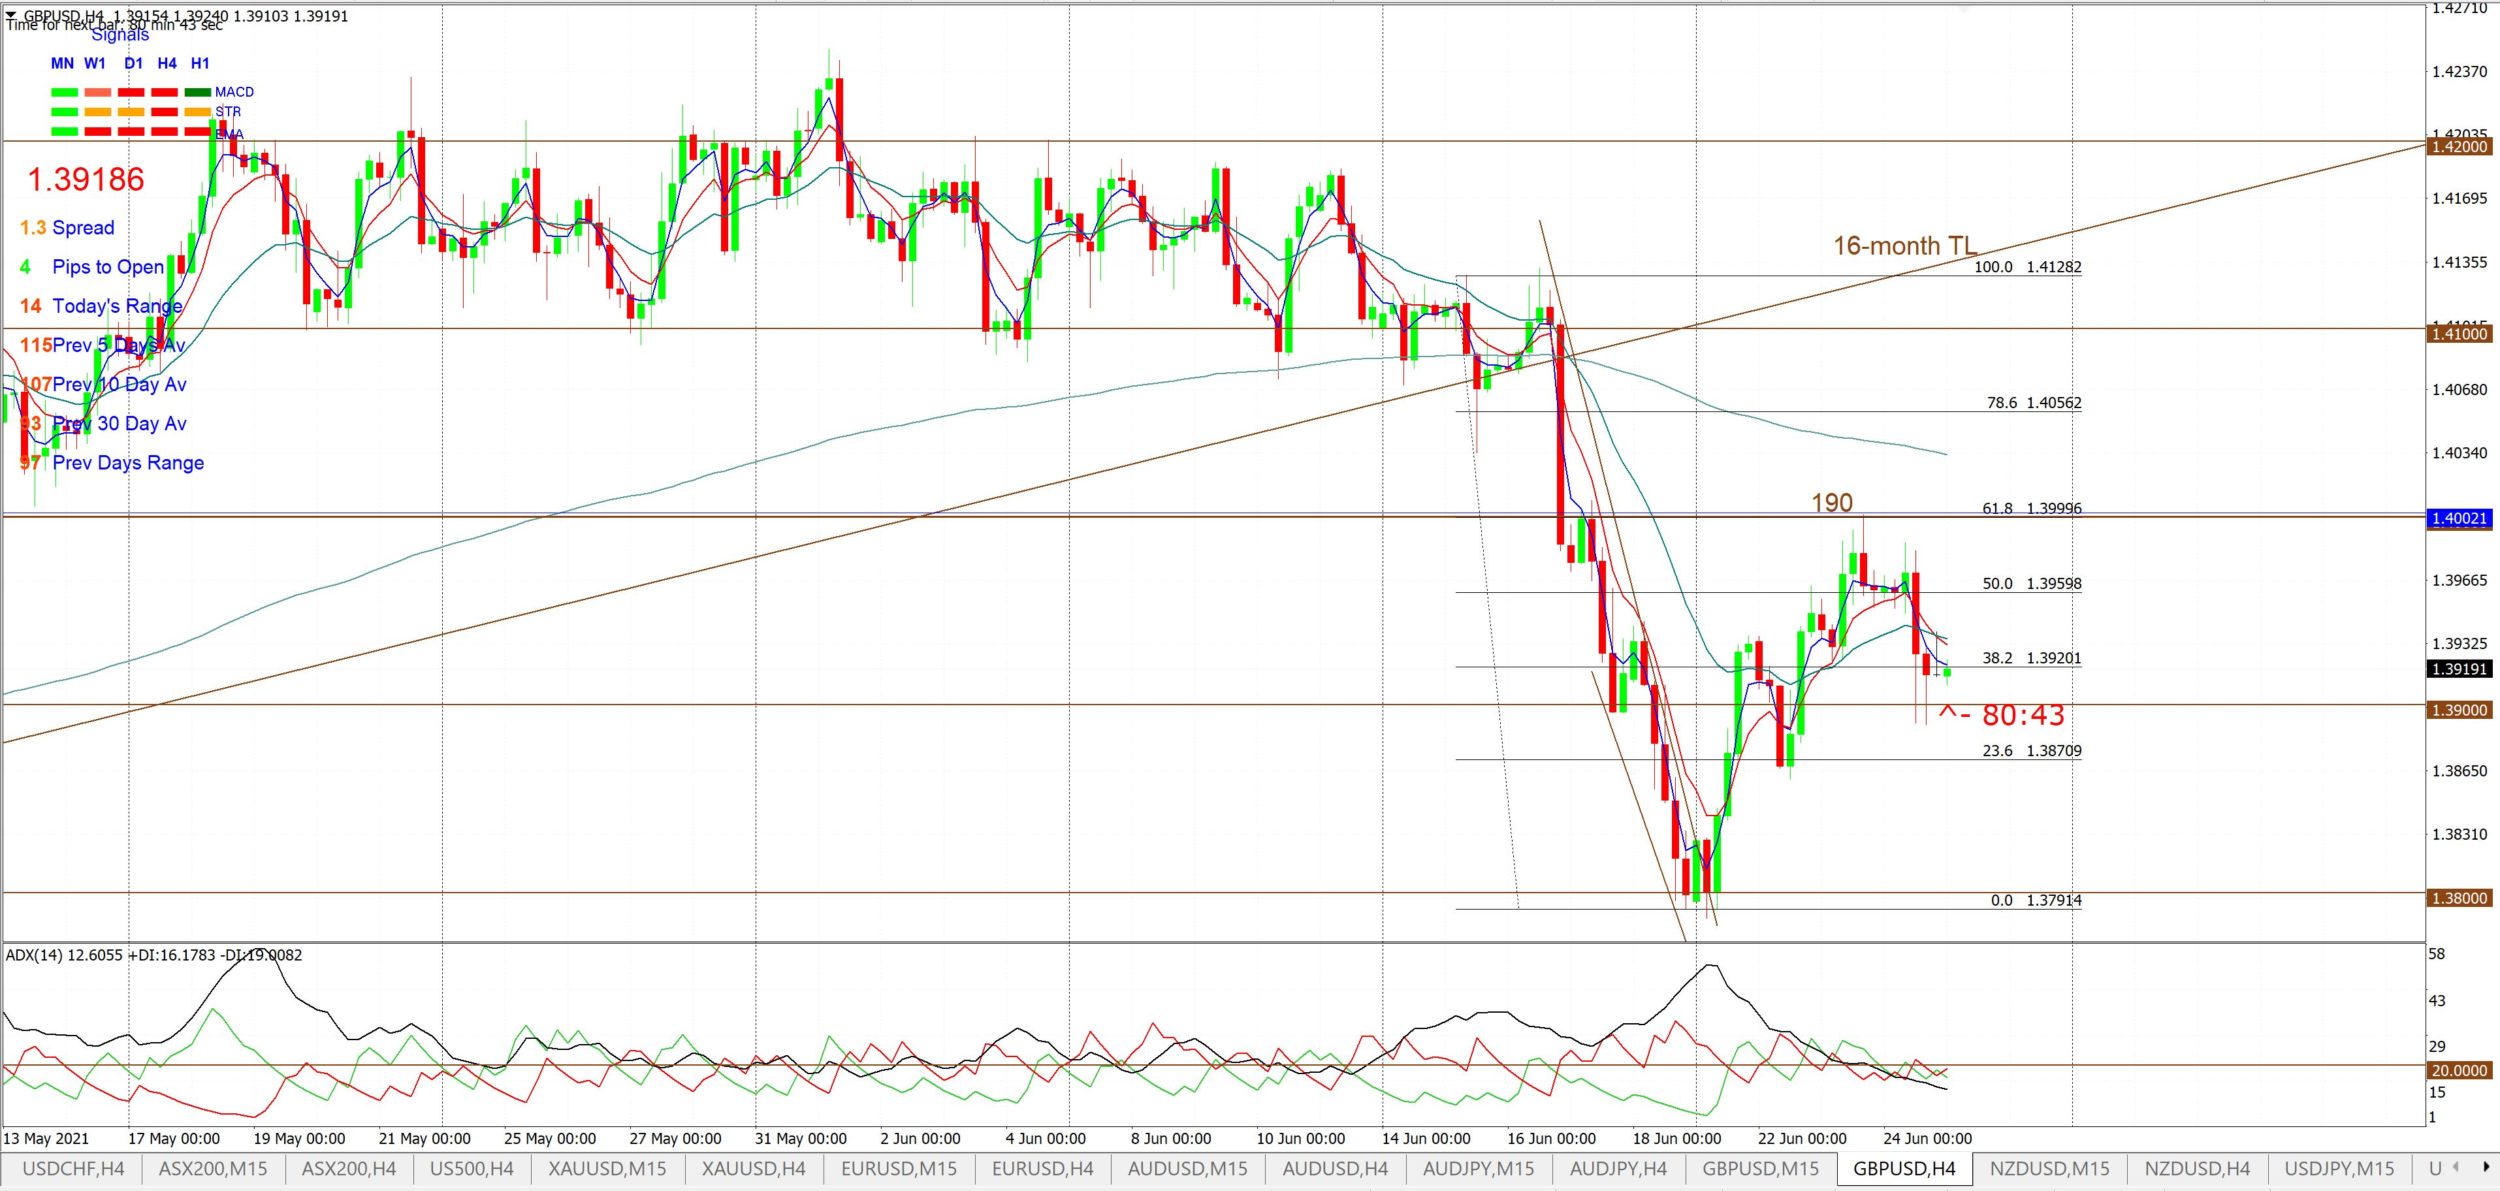
G/U 4hr: this is the chart on the following day showing how price retraced after testing the target 61.8% Fibonacci retracement.
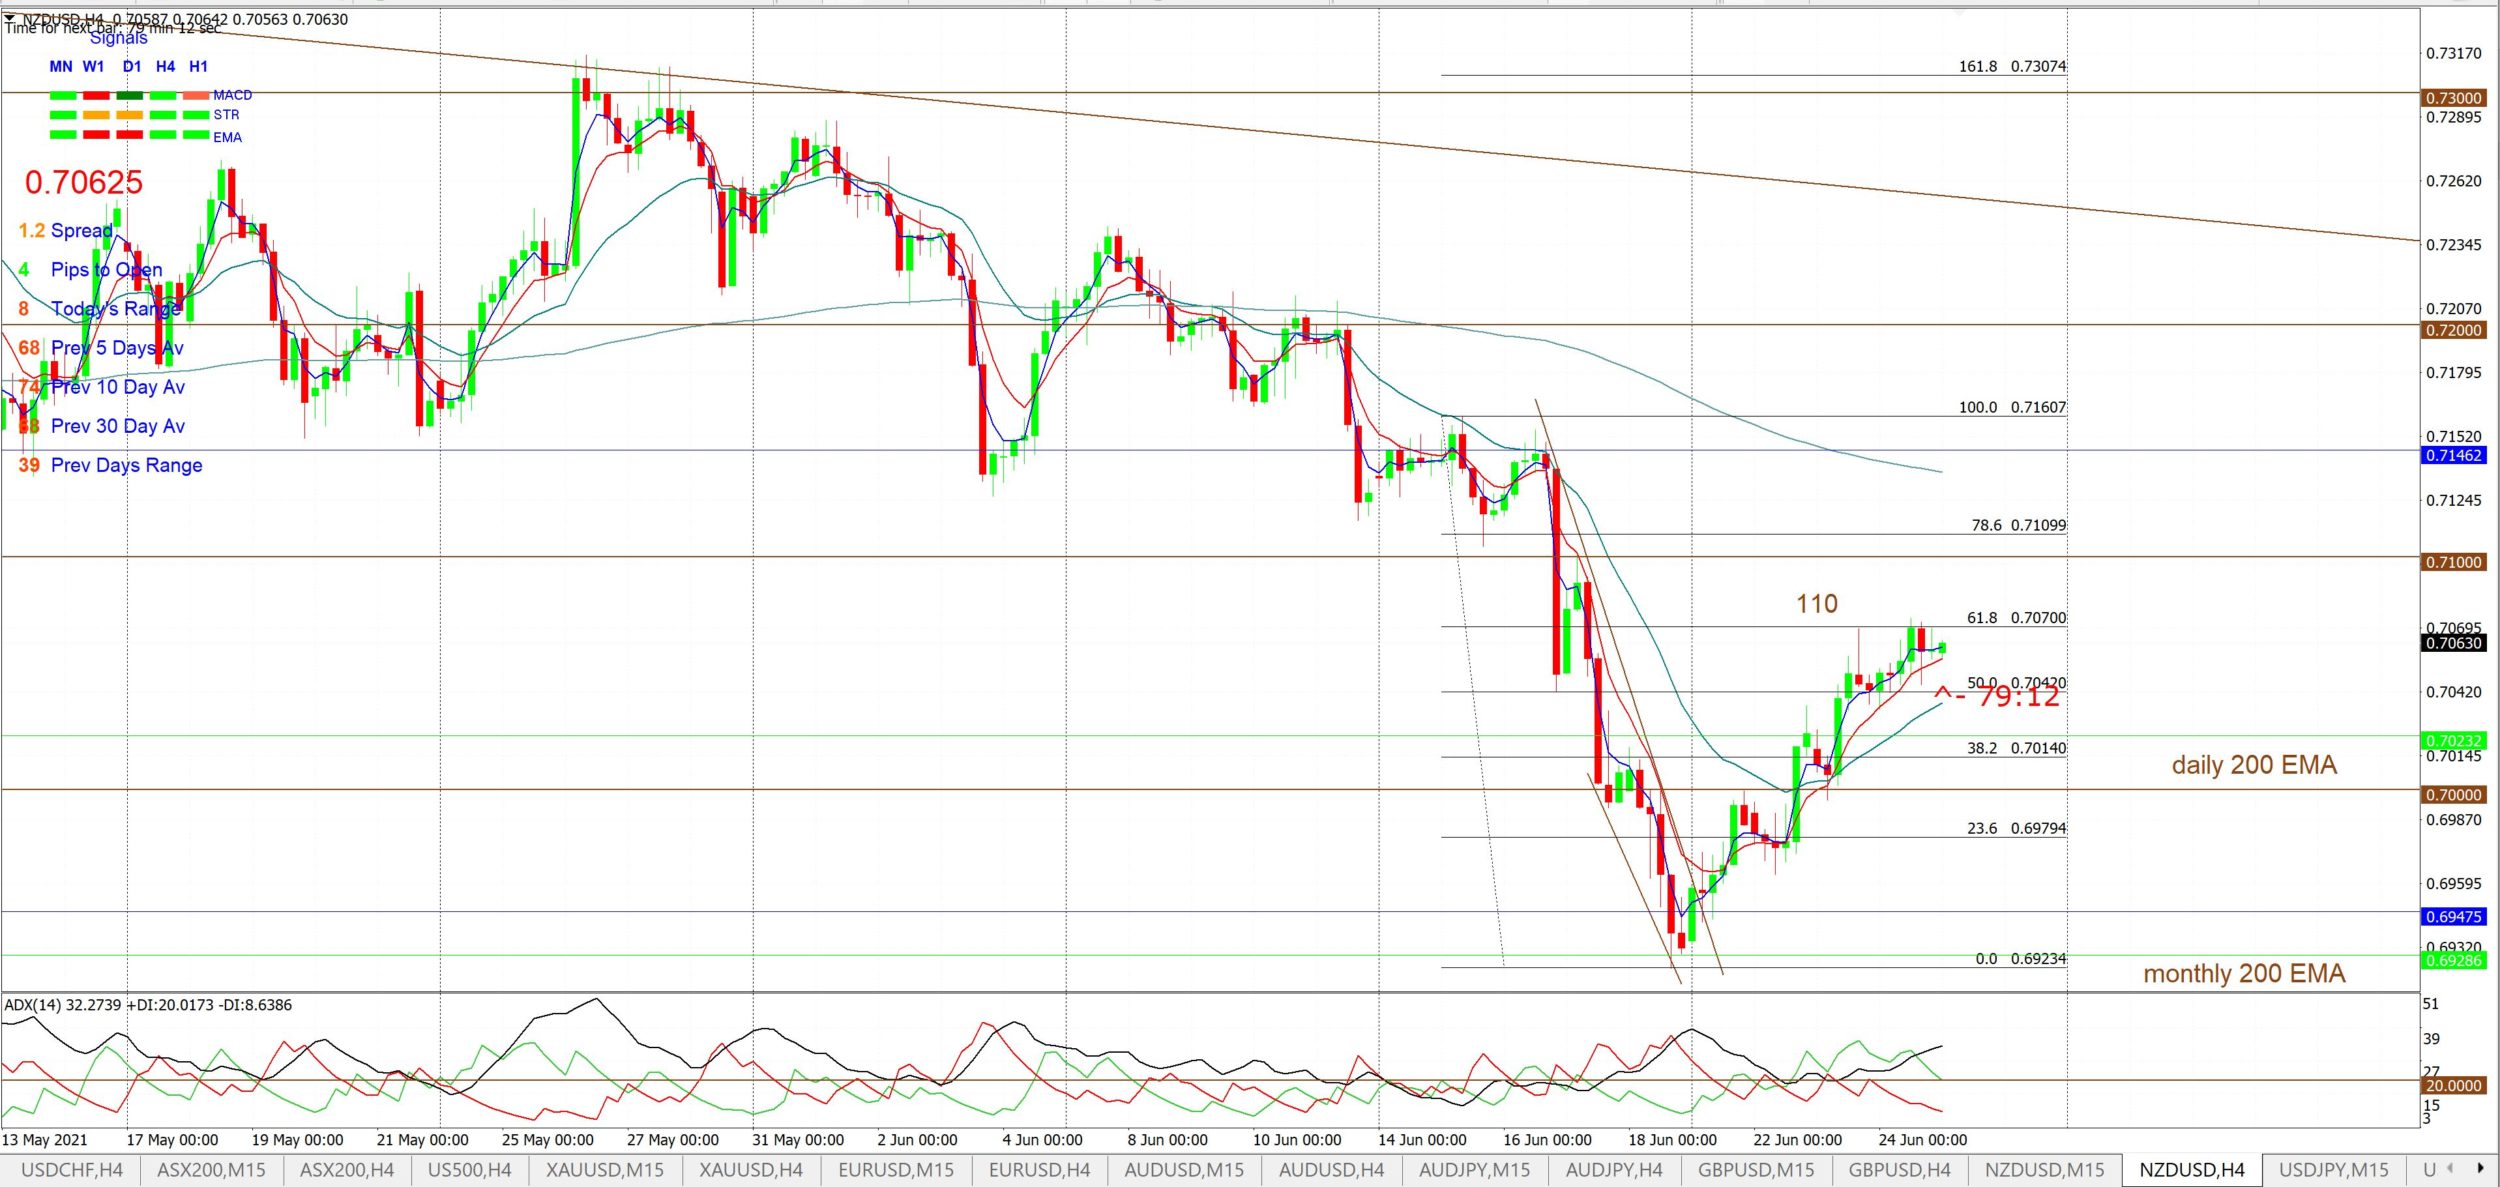
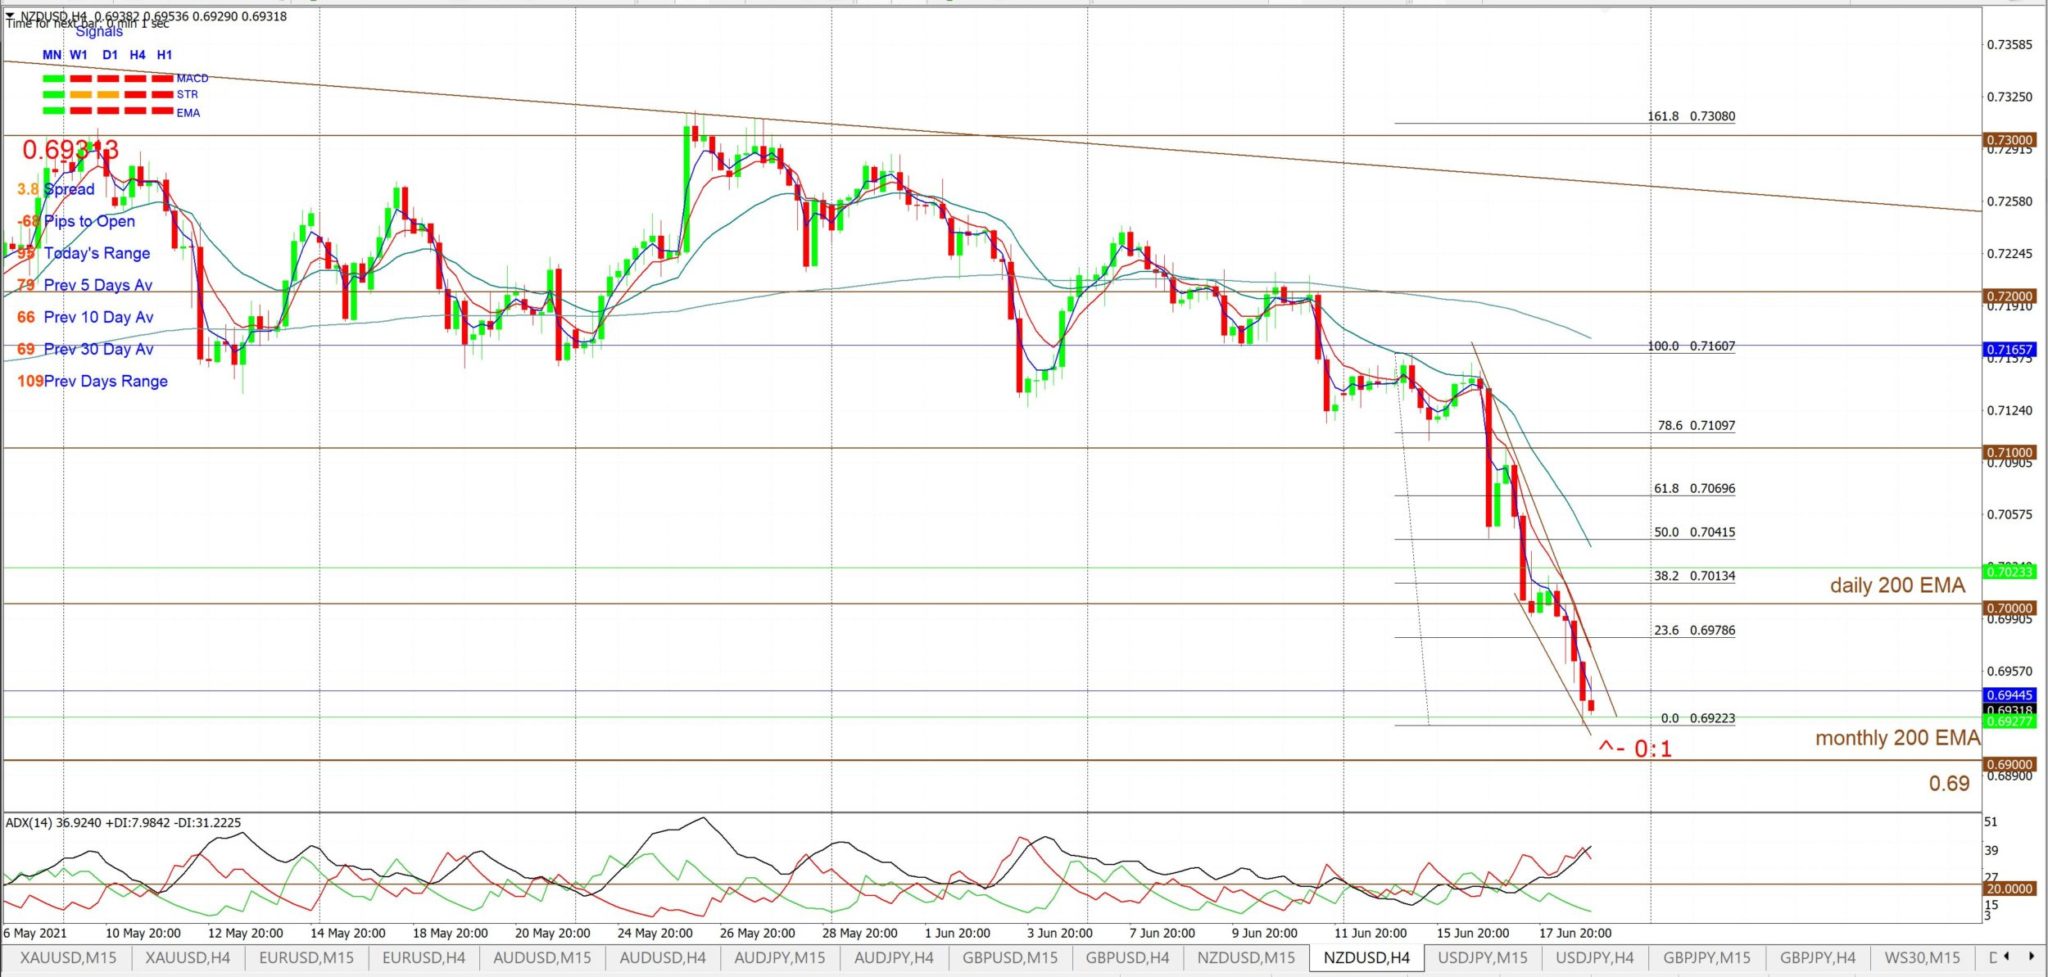
- NZD/USD: note how this descending wedge retraced to the 61.8% Fibonacci; for around 110 pips.
Kiwi 4hr: chart from the weekend update:
Kiwi 4hr: chart after the target 61.8% Fibonacci retracement was reached:
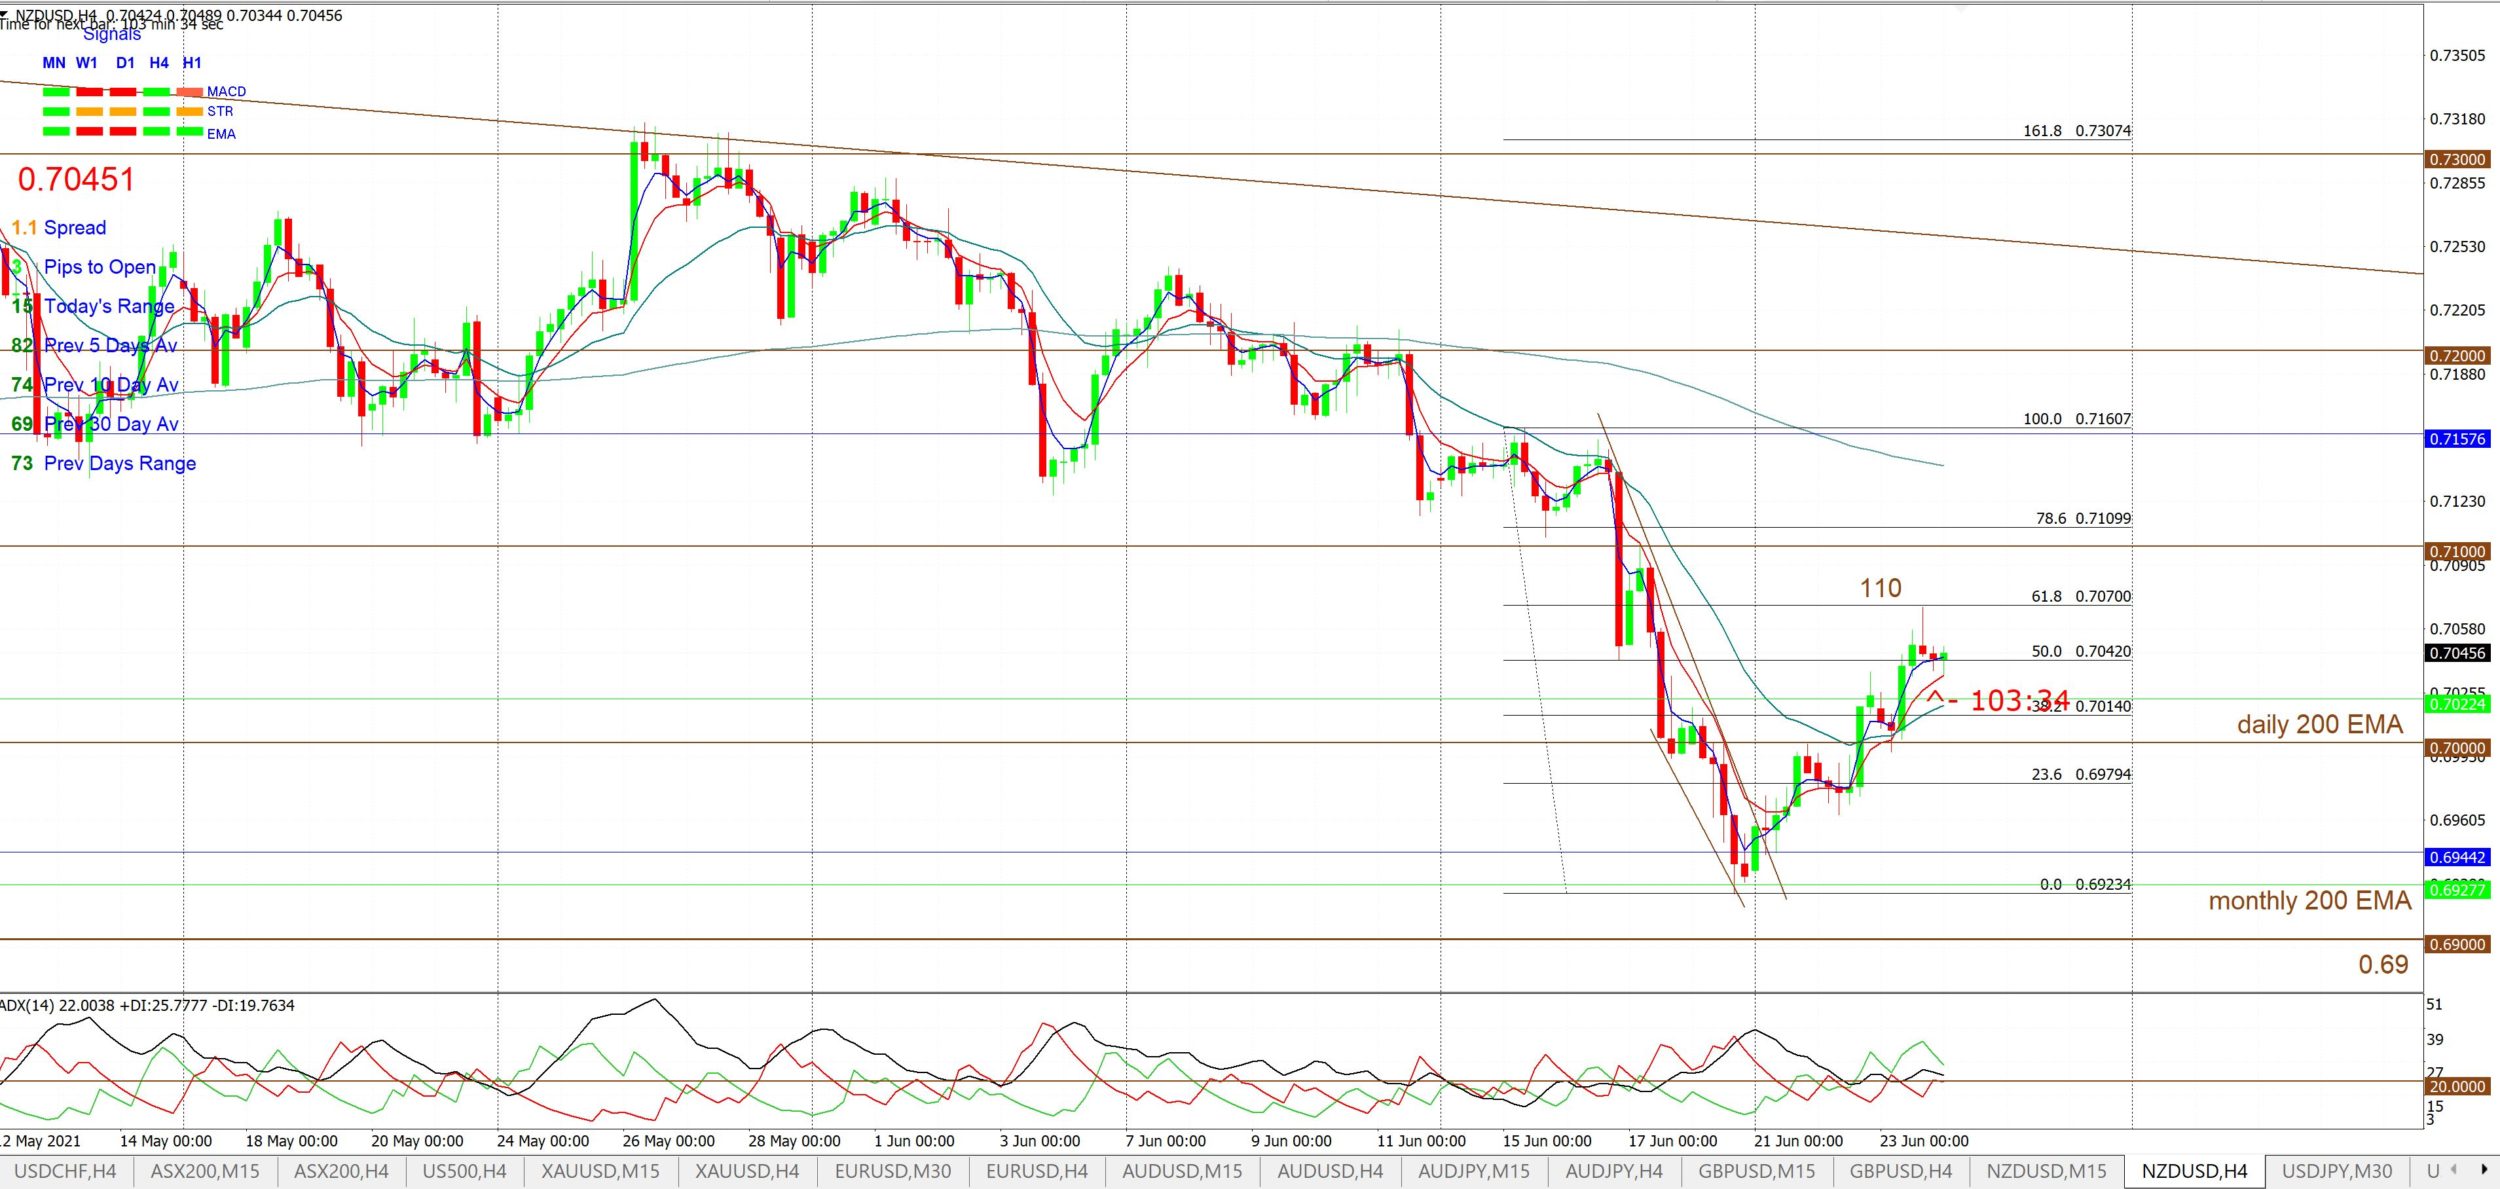
Kiwi 4hr: this is the chart on the following day showing how price continued to test the target 61.8% Fibonacci retracement.