


Introduction
Technical Analysis is a discipline where data about price action is gathered from information provided on the chart of an investment instrument. The technical analyst uses this information to search for any identifiable and repeatable patterns that may help to better understand future price action. Metrics such as trading volume, the amount of price movement and momentum are three examples of data that might interest a Technical Analyst.
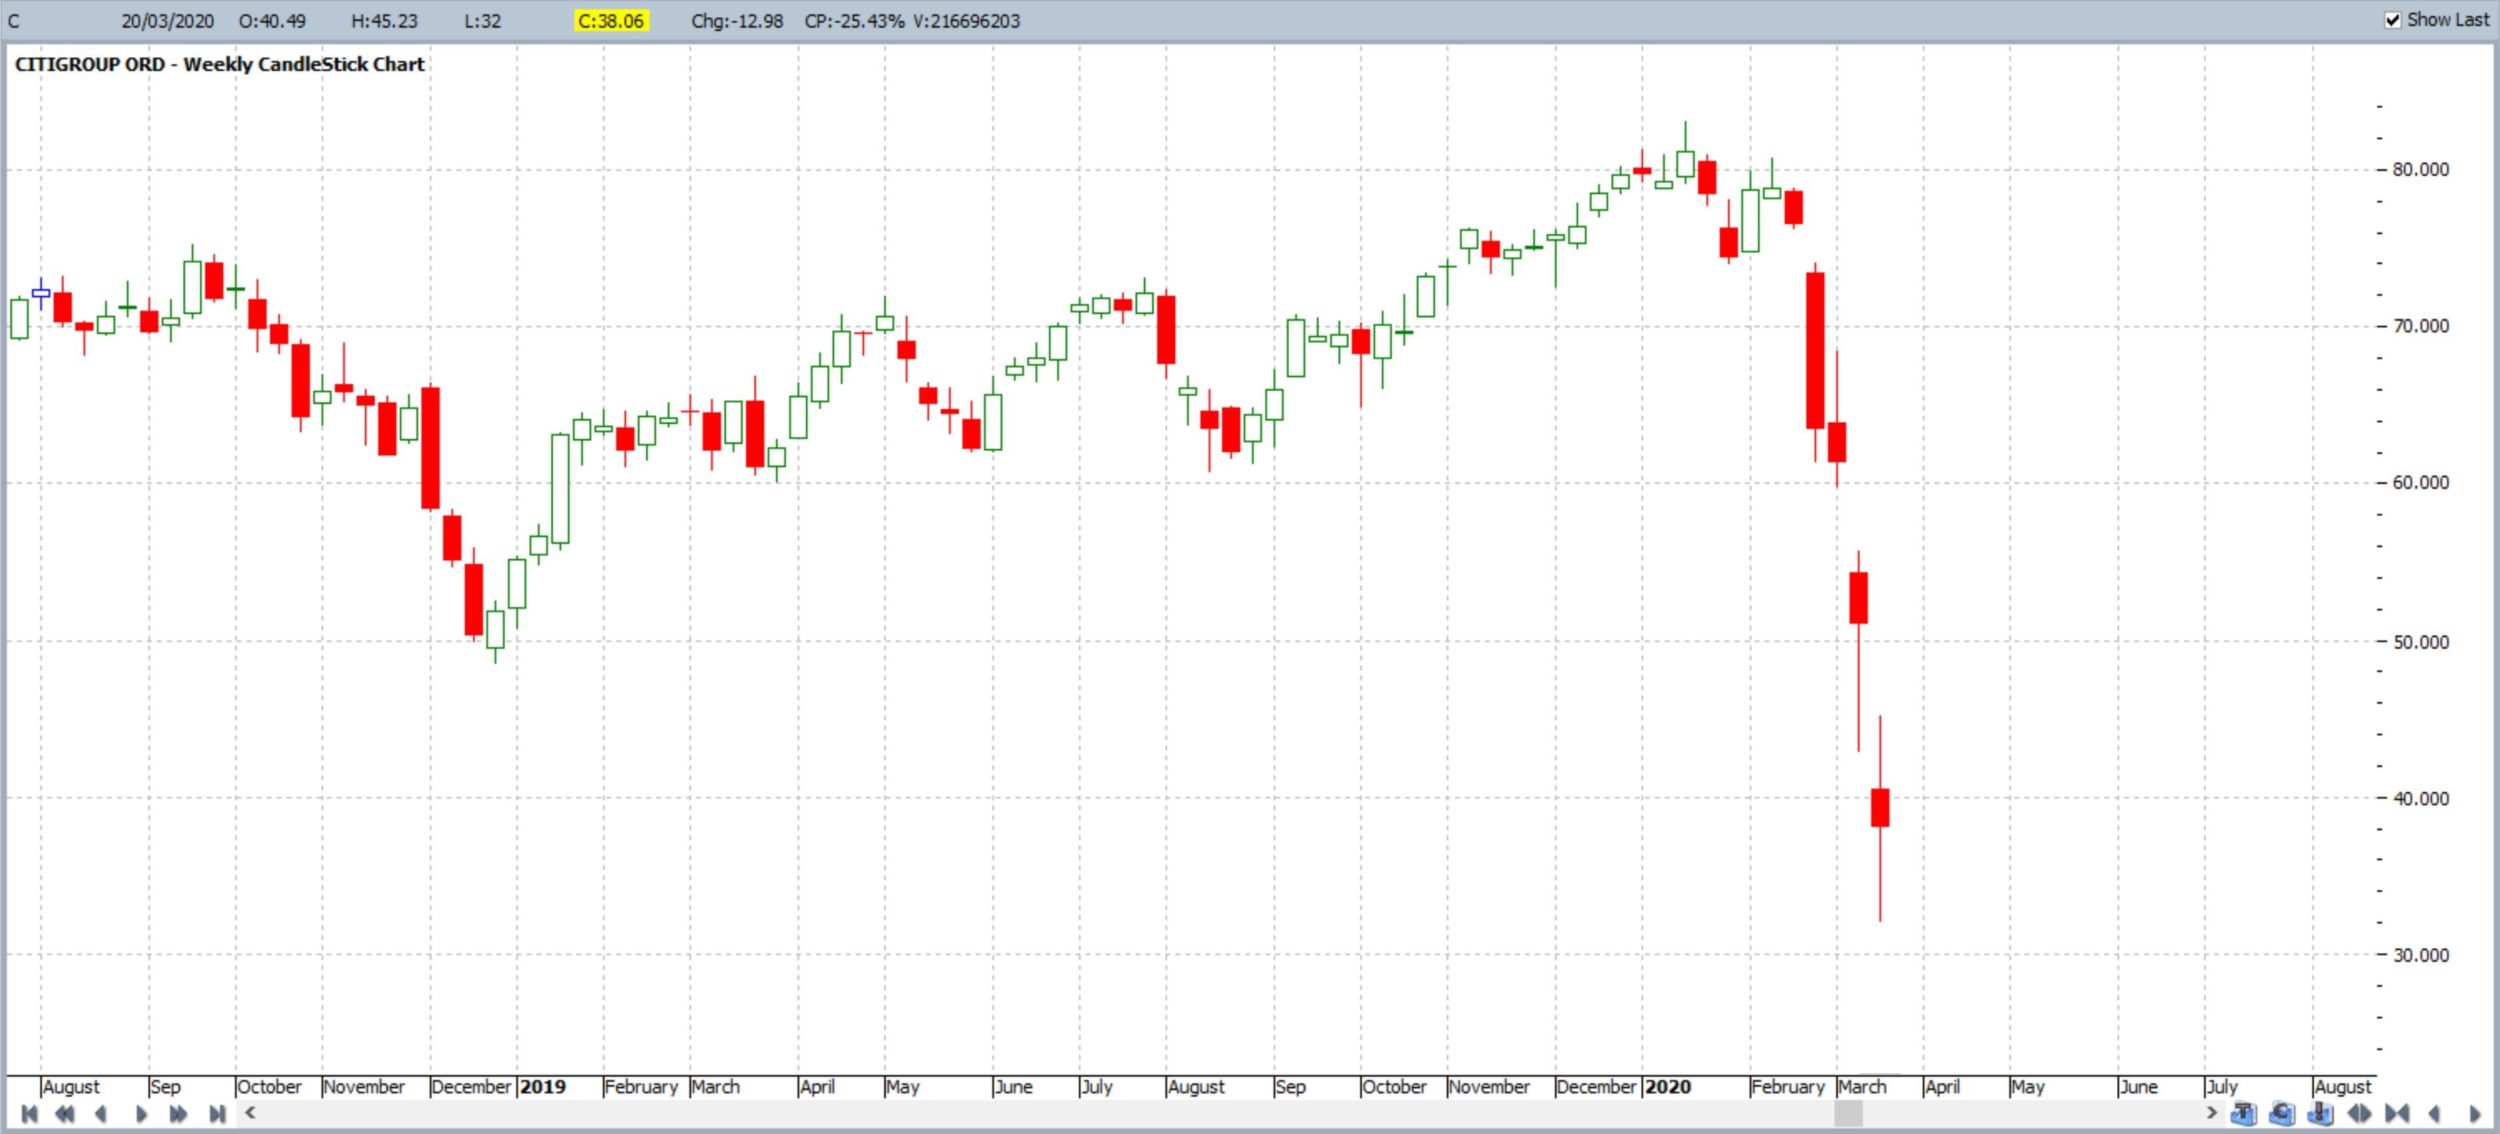
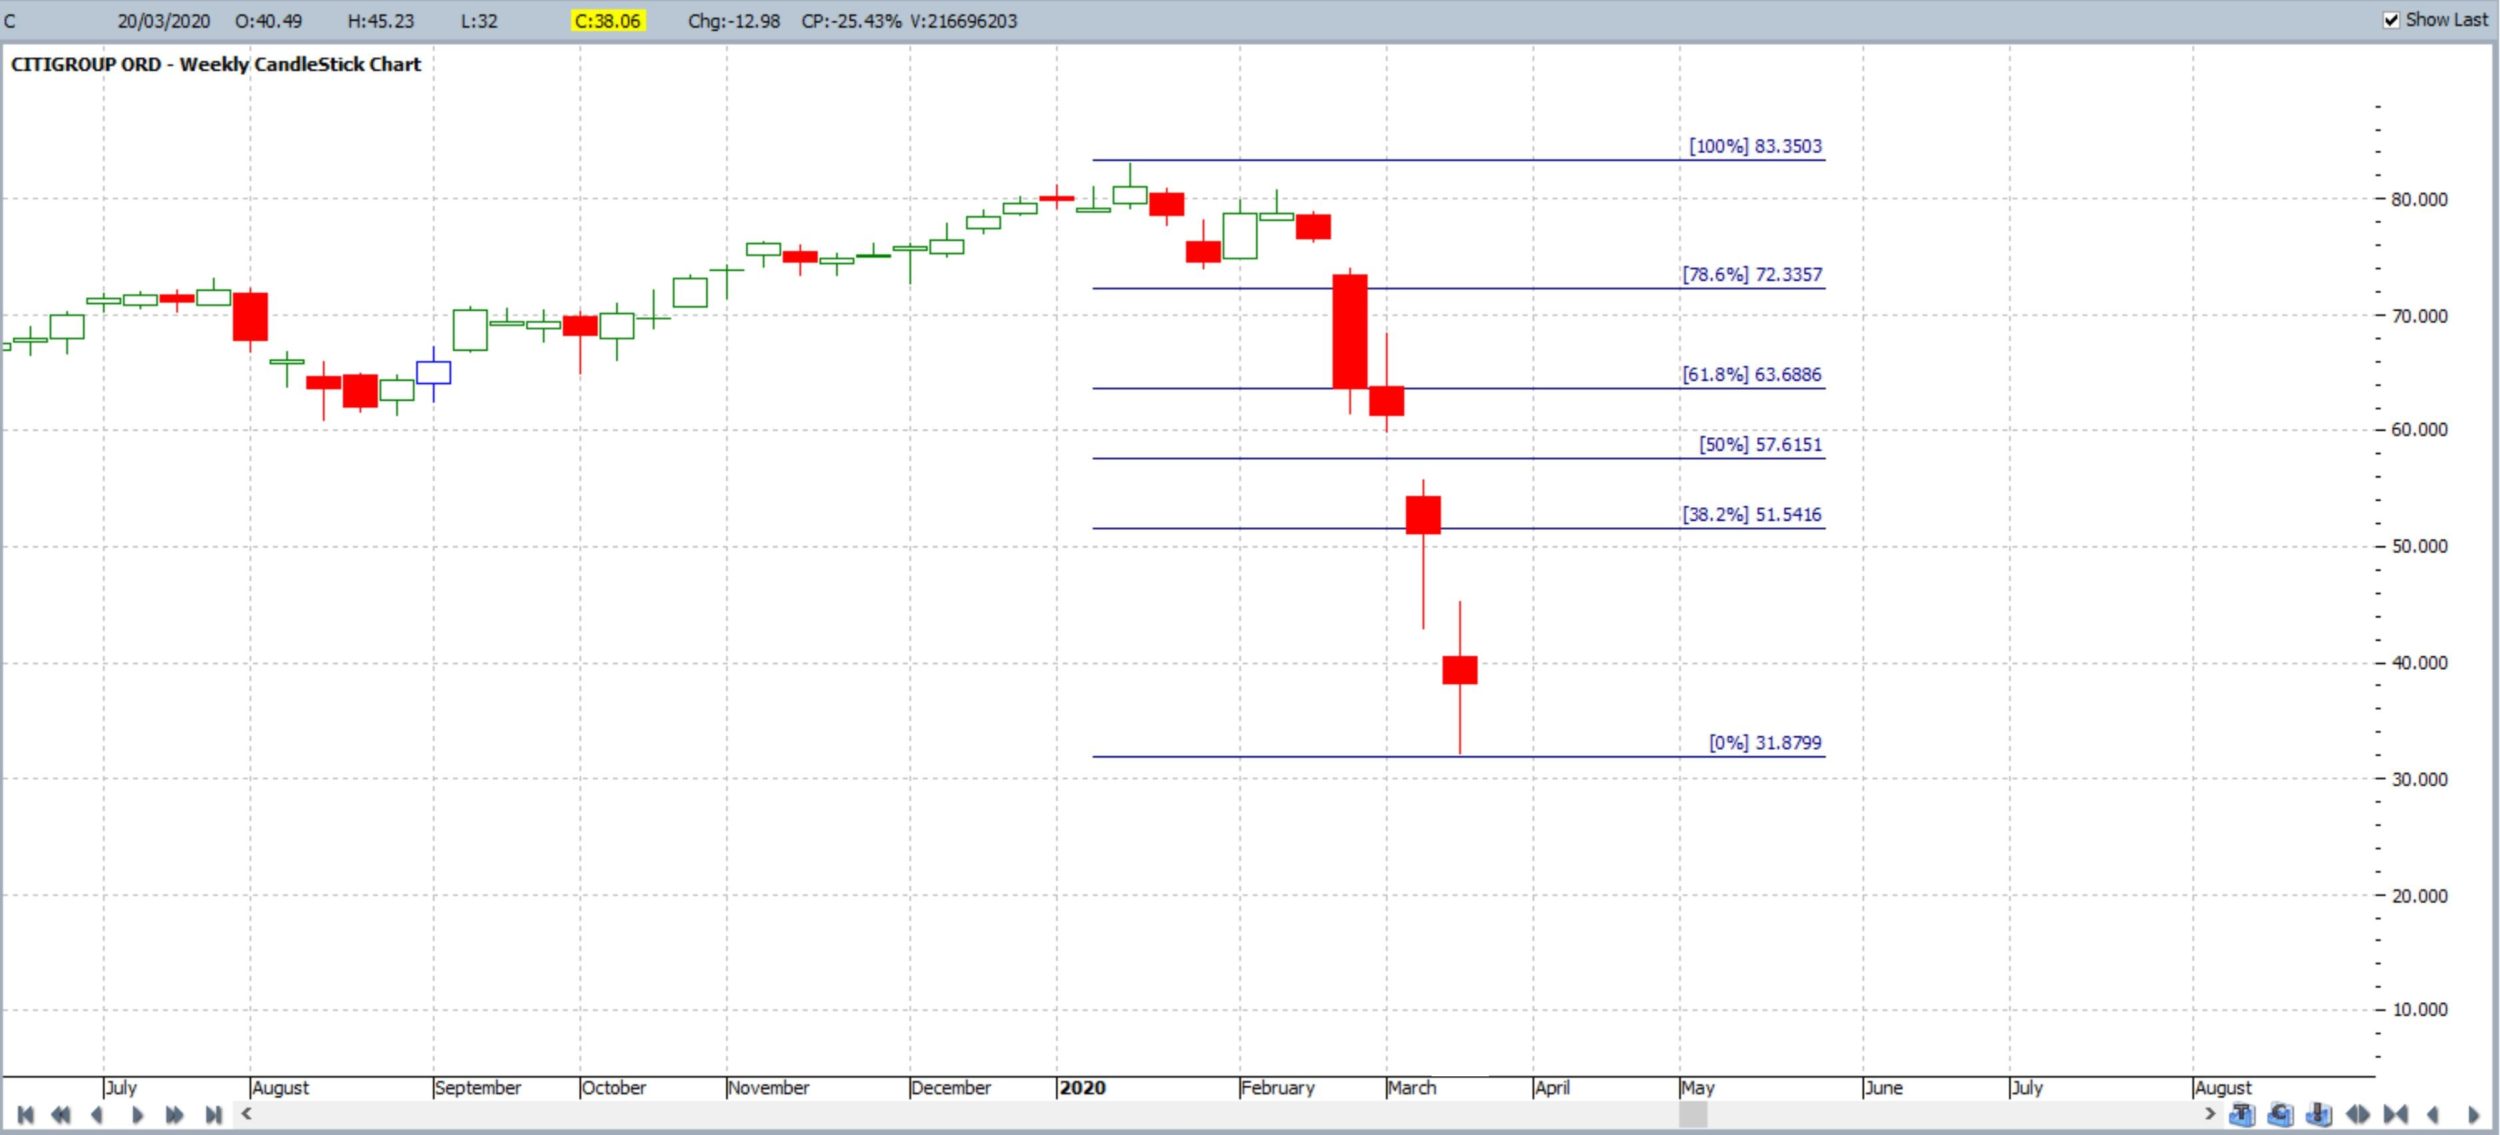
Price movement, up or down, is one obvious metric of particular focus for traders and investors. To illustrate this point I have included the chart of Citigroup from March 2020 in Figure 1. This chart shows that price action made a significant decline, from just above $80 in January 2020 to just above $30 by March 2020, with the Covid-19 inspired sell-off.
A Technical Analyst would be interested in mapping out various options for how price action might move forward following the print of this March 2020 Low. They would be interested in identifying potential targets if:
- price continued lower or
- if price bounces and start to retrace back higher.
Fig 1: Citigroup weekly:
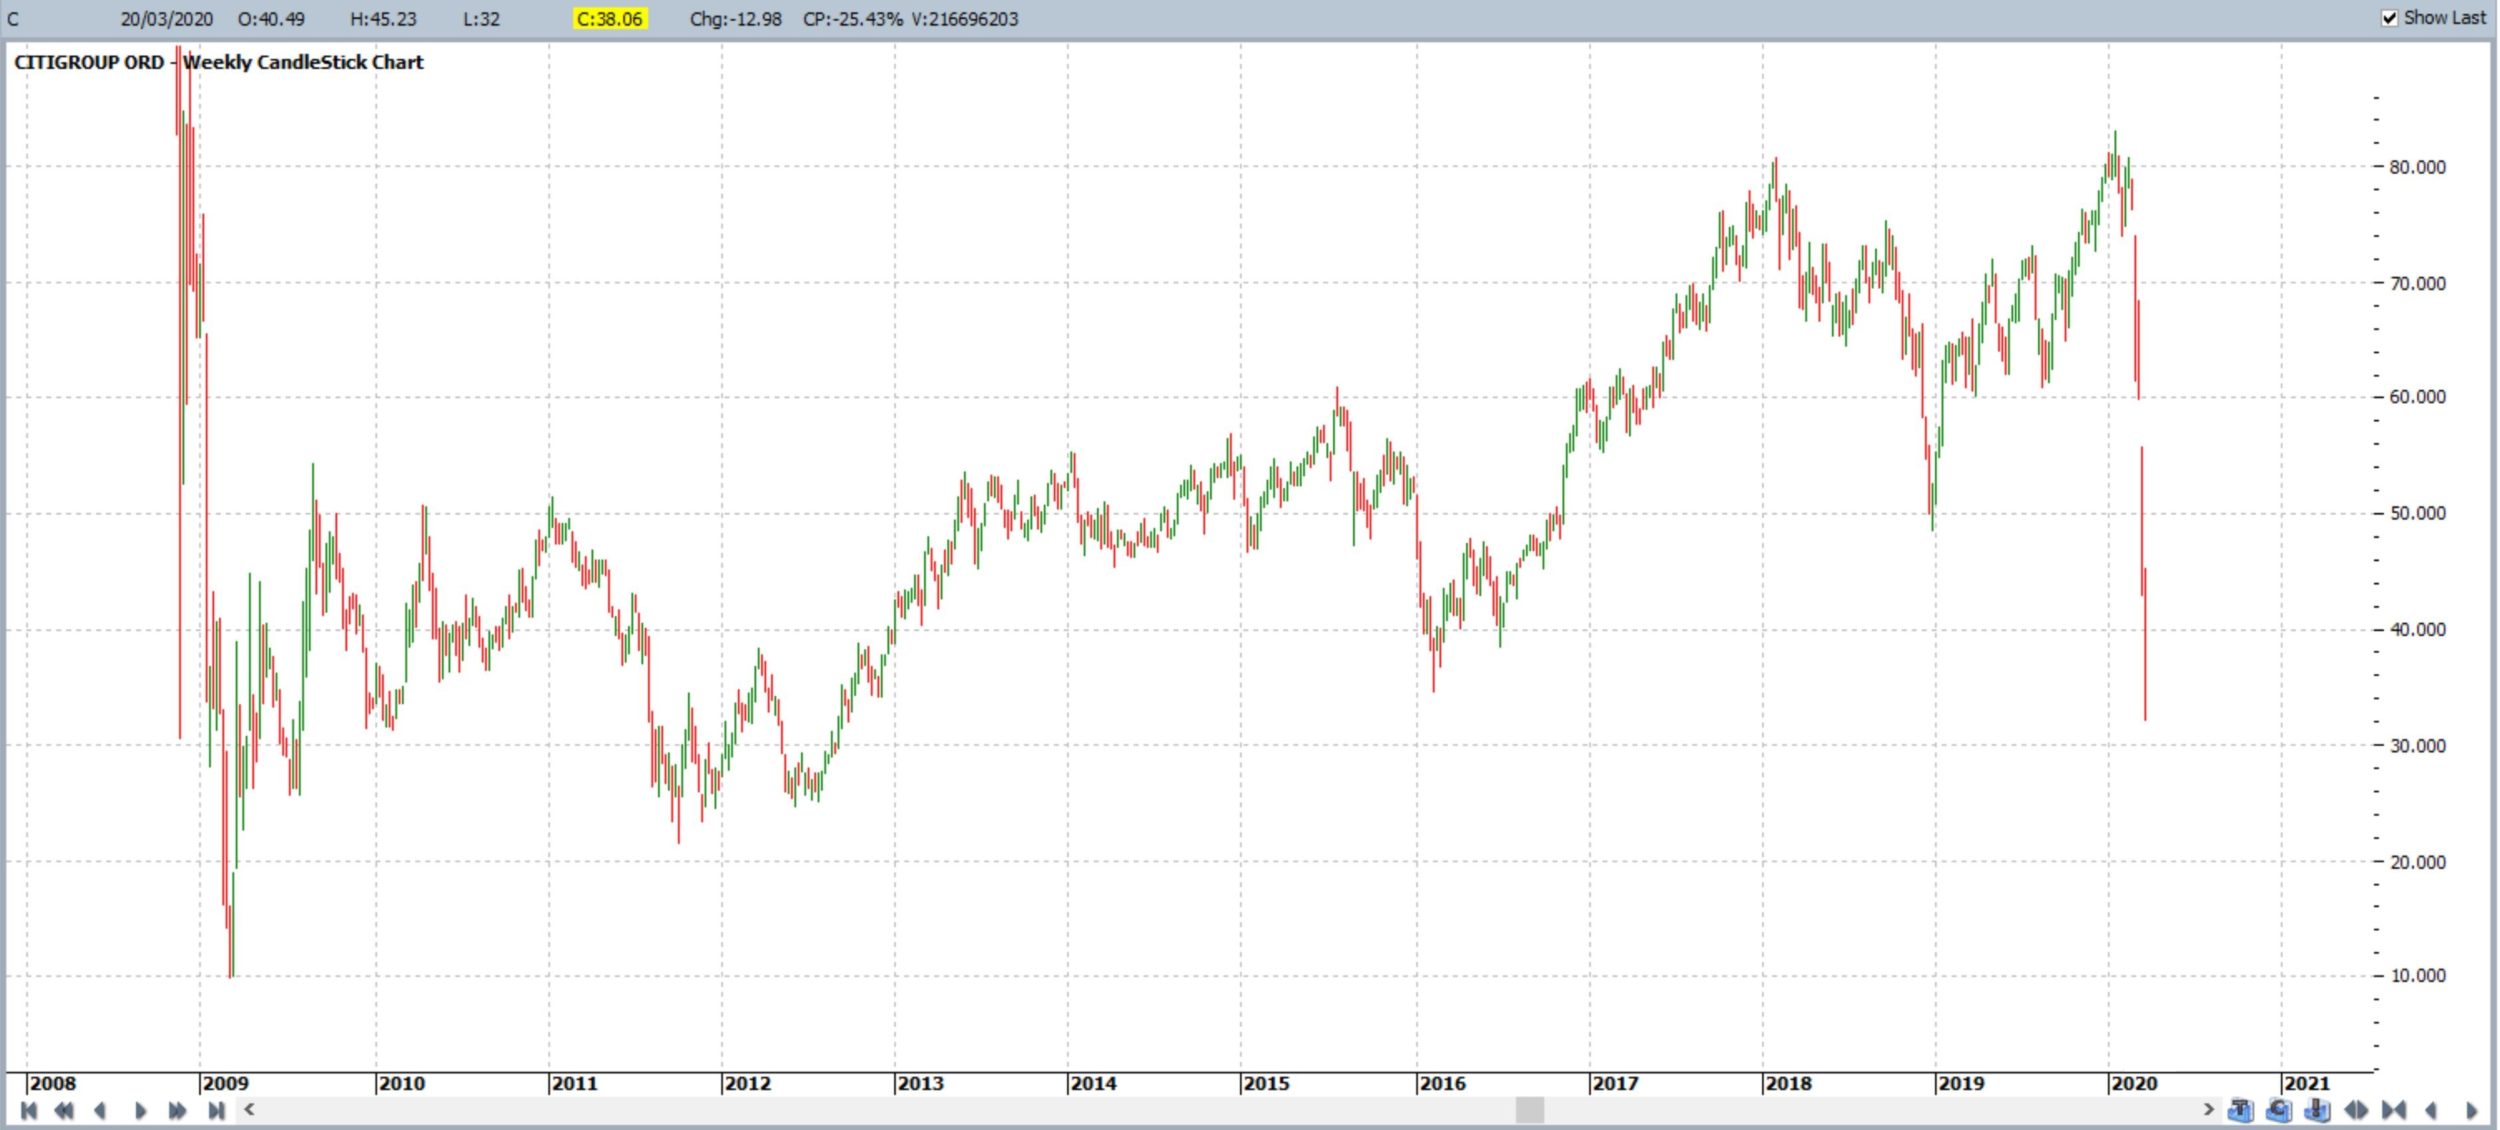
The chart in Figure 2 shows a more condensed version of the Citigroup weekly chart. One obvious target for a lower price action target would be near the $10 level as this region acted as Support following the Global Financial Crisis (GFC) sell off. Identifying Support and Resistance zones, or areas of significant price reaction, is one method a trader can use to identify potential price movement targets. I have written more about tracking Support and Resistance levels and this page can be found through this link.
Fig 2: Citigroup weekly condensed:
How would we identify any potential retracement to the upside though? One could use the metric of Support and Resistance zones, as we used for the lower target derived from the chart in Figure 2. There is another tool that can be used though and this is derived from a mathematical sequence that is replicated widely in the natural world. This tool is referred to as Fibonacci Retracement and is derived from the Fibonacci sequence of numbers. At this point we will take leave of the Citigroup chart and delve into the world of Fibonacci.
Fibonacci
Leonardo Fibonacci was a 12th Century Mathematician who identified a repeatable pattern of numbers found in nature. The mathematics underpinning his finding is quite fascinating and is a discipline in itself. My main purpose here, however, is explaining how this particular pattern of numbers, and ratios derived from these numbers, are applied to Fibonacci Retracement tools; tools for mapping retracement price action charts.
The Fibonacci sequence of numbers is as follows:
0, 1, 1, 2, 3, 5, 8, 13, 21, 34, 55, 89,144, 233, 377 etc.
This sequence is derived by adding the previous two numbers together as outlined below:
0 + 1= 1, 1 + 1 = 2, 1 + 2 = 3, 2 + 3 = 5, 3 + 5 = 8, 5 + 8 = 13, 8 + 13 = 21, 13 + 21 = 34 and so on.
Golden ratio
One important feature of the Fibonacci sequence is the phenomenon of the Golden Ratio. In the Fibonacci sequence, with the exception of the first couple of numbers, any given number is approximately 1.618 times the prior number. Another way of saying this is that each number is approximately 0.618 of the next number in the sequence. This math is set out in the sums below.
3/5 = 0.6 5/8 = 0.625 8/13 = 0.615 13/21 = 0.619
5/3 = 1.66 8/5 = 1.6 13/8 = 1.62 21/13 = 1.61
Fibonacci and the Golden Ratio in Nature
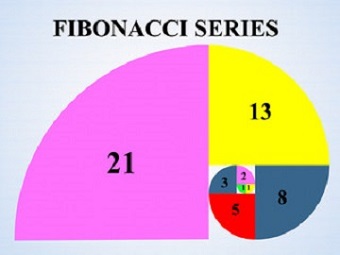
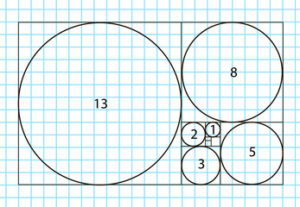
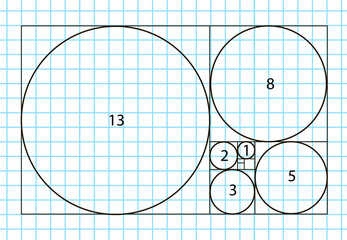
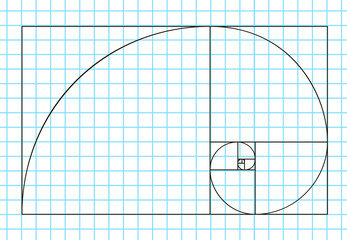
Arranging the Fibonacci sequence of numbers as shown in Figure 3 generates the spiral pattern as shown in Figure 4. It is this patterns that is so highly visible in the natural world:
-
- Fig 3
-
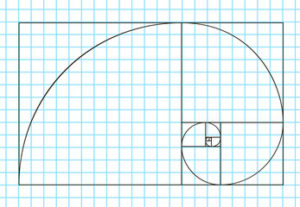
- Fig 4
This spiral pattern observed in Figure 4 appears widely in nature, and the man made world, as the images in Figure 5 reveal:


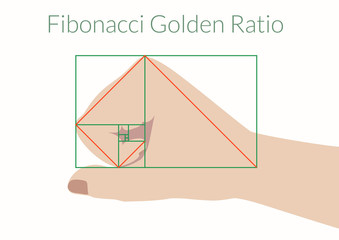

Figure 5: Fibonacci sequence observed in the natural and man made world
There are numerous video resource available on this topic and I have noted some below that may be of interest if you wish to expand your understanding of Fibonacci, the Fibonacci sequence and the Golden ratio.
Video Resources on Fibonacci:
Video 1: The Fibonacci Sequence (3 min)
Video 2: Golden ratio (10 min)
Video 3: The magic of Fibonacci numbers (6 min)
Video 4: sacred geometry taught by Donald Duck (28 min)
Applying Fibonacci to Technical Analysis
The Golden Ratio is widely applied in the field or Art, Photography and Design and the article available through this link gives an overview of this application. However, it is its application in the field of Technical Analysis that is the topic of this article.
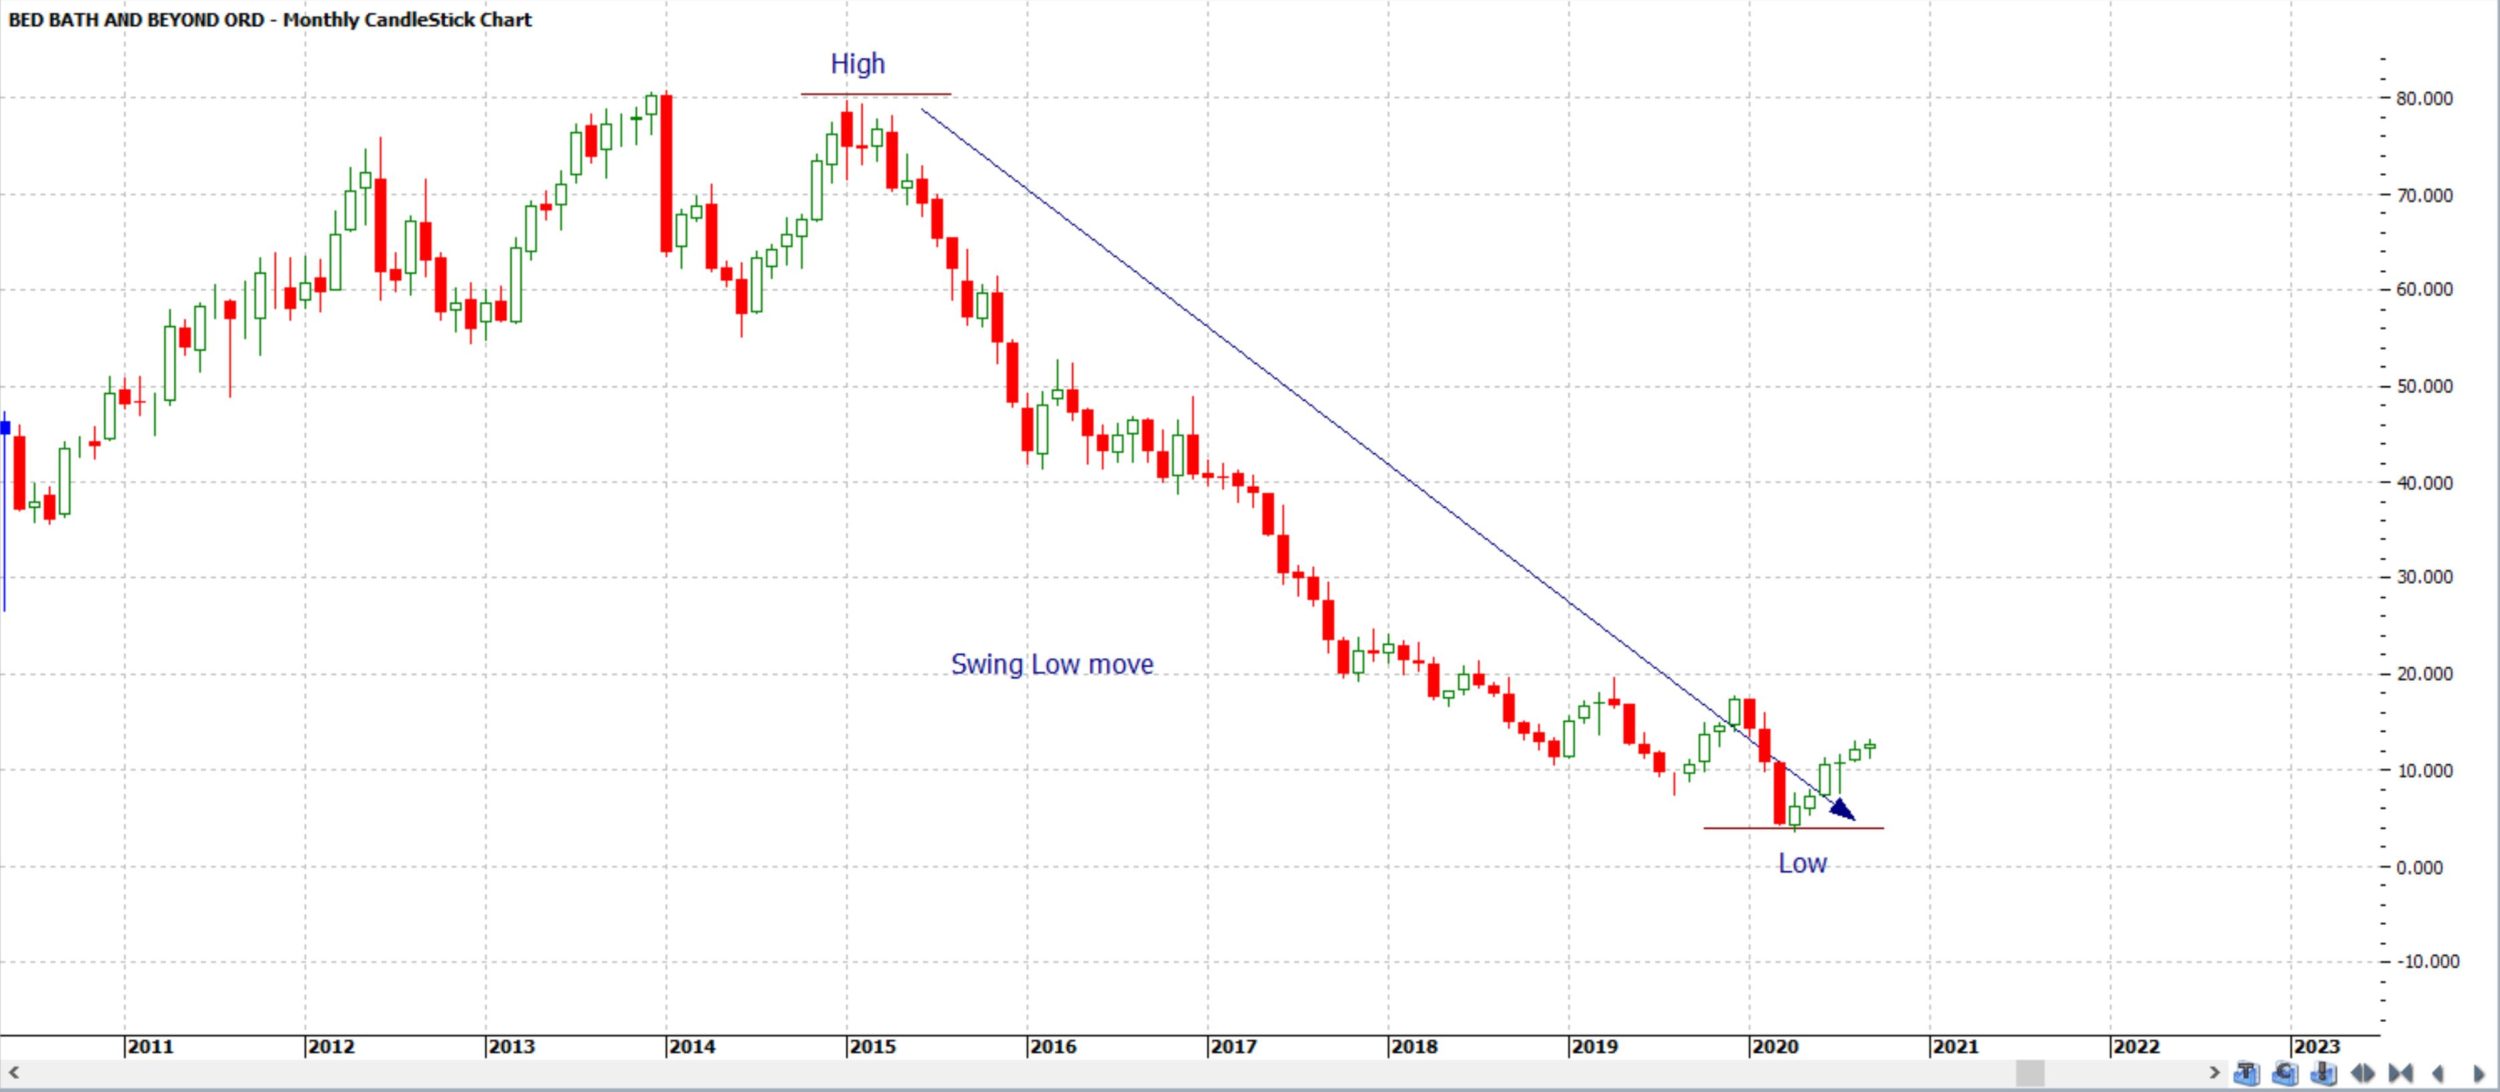
Fibonacci and the Golden Ratio are applied in Technical Analysis with the goal of helping traders identify potential future price movement for a trading instrument. Ratios, derived from the Fibonacci sequence, are applied to a particular chart’s price action move, usually from a high to a low, called a swing Low, or from a low to a high, called a swing High. Examples of a swing Low and swing High moves are shown in Figure 6.
-
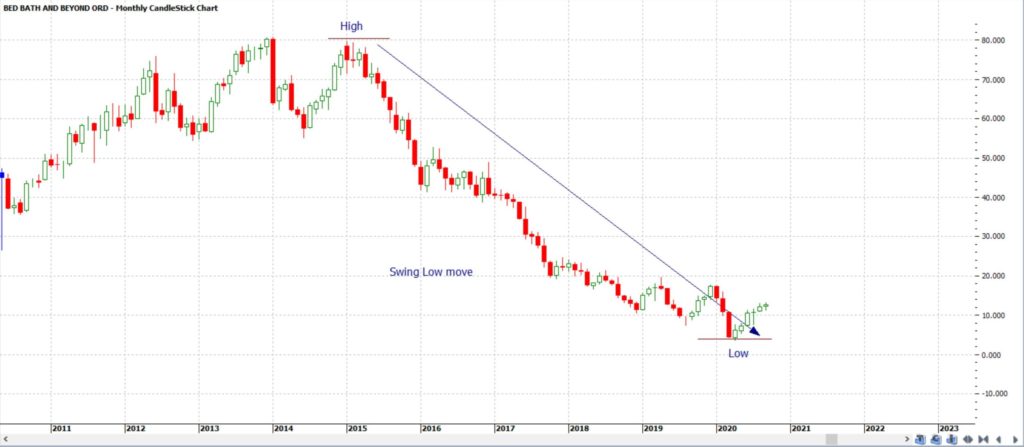
- Swing Low
-

- Swing High
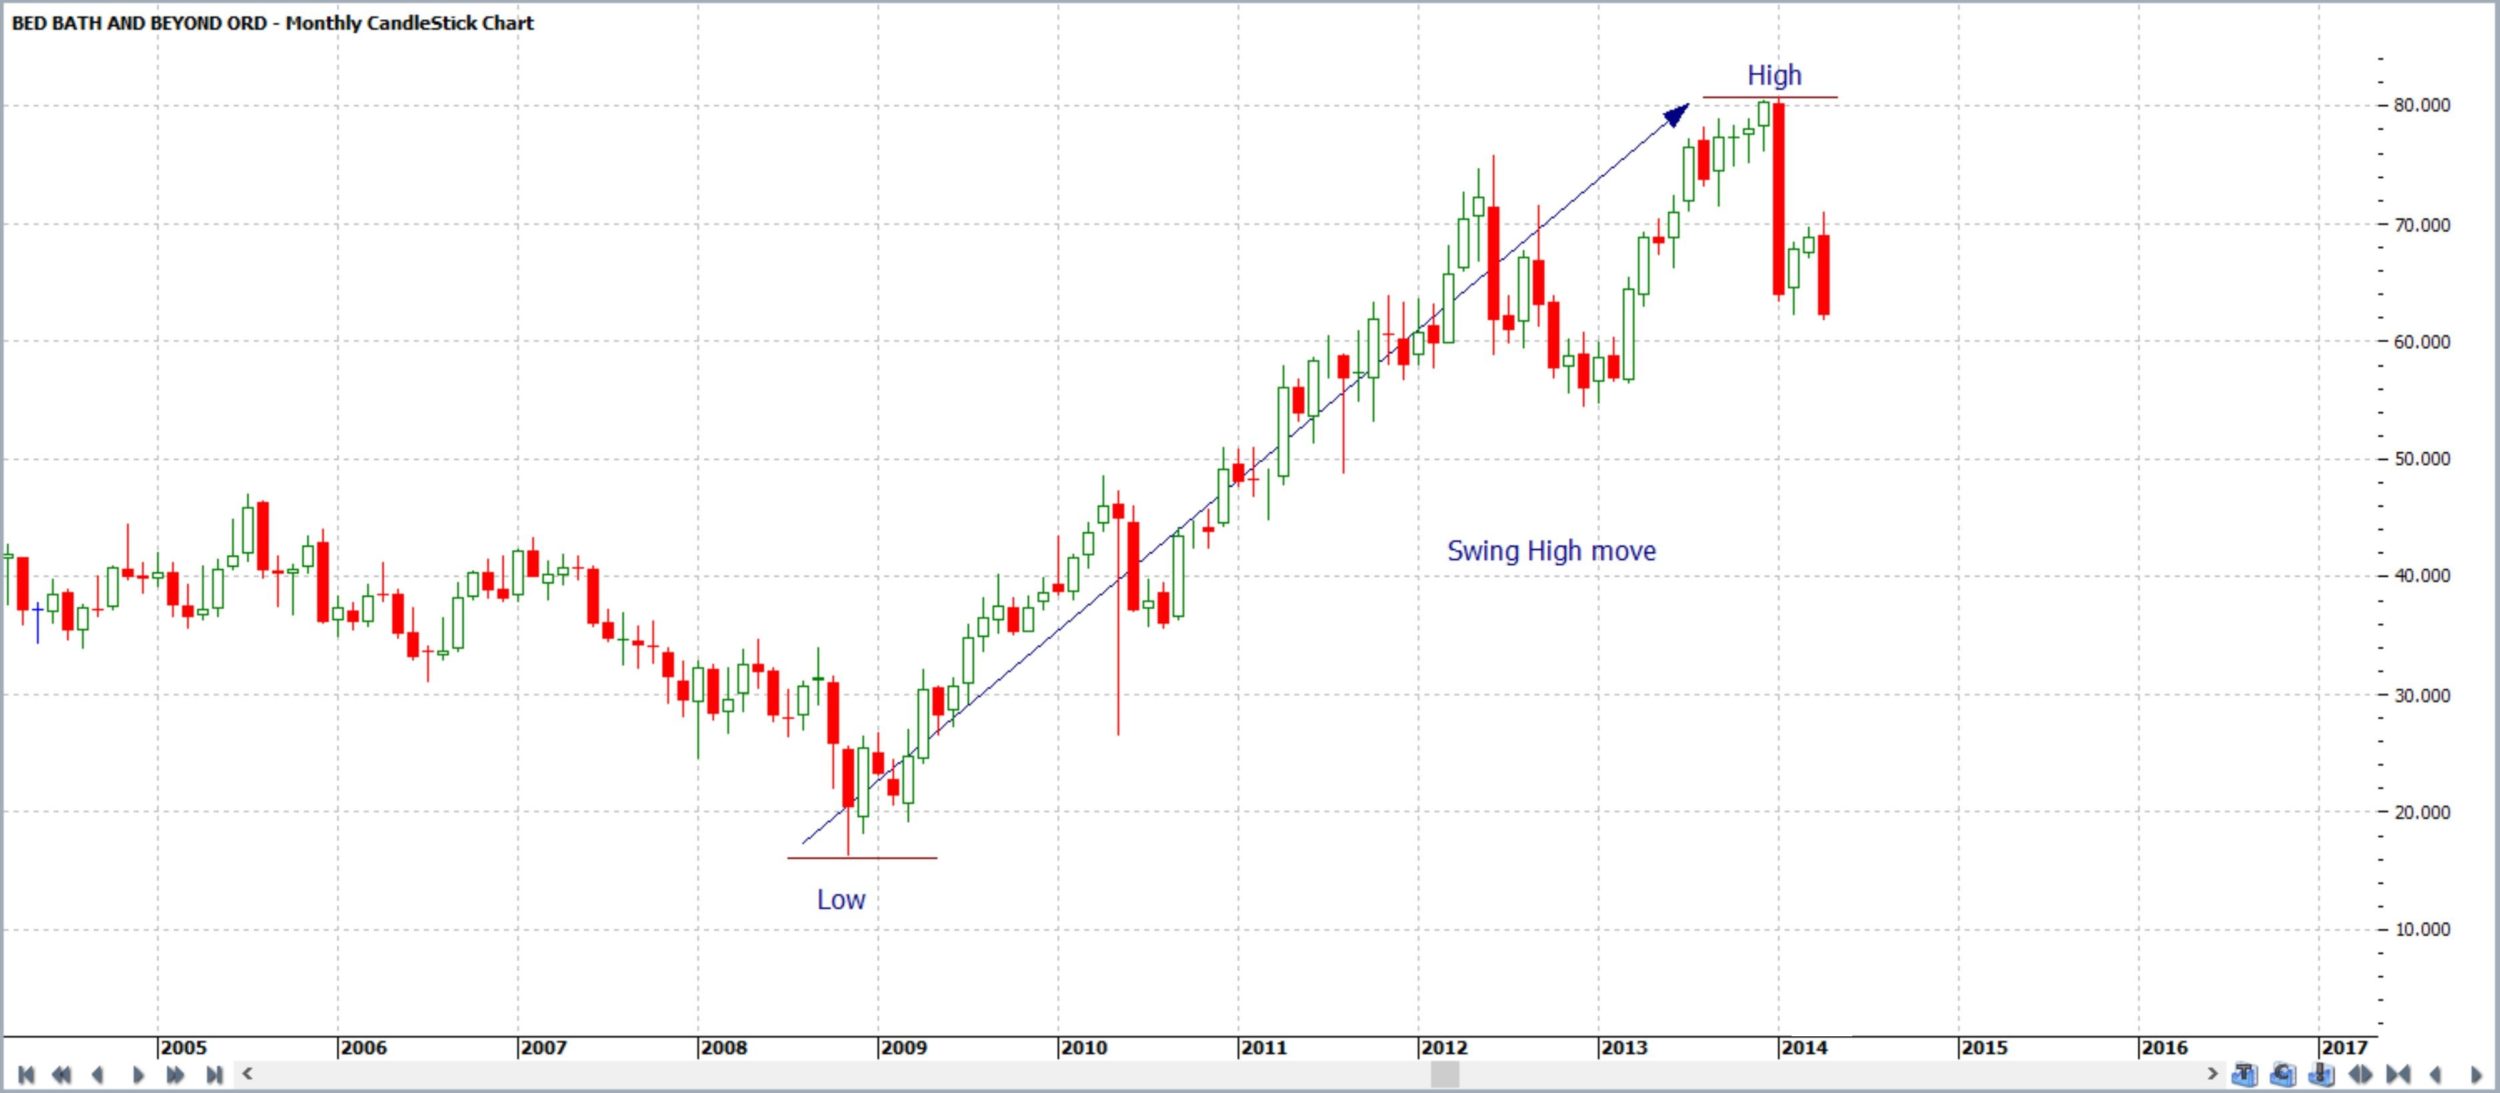
Figure 6: Swing High and Swing Low
Fibonacci ratios are applied to these swing Low or swing High moves to act as markers on areas of interest for potential price action movement. The main ratios used are those of the Golden Ratio: 0.618, or 61.8%, and 1.618, or 161.8% but there are other ratios used as well. These other ratios include:
- 0.236 or 23.6%: this is found by dividing a number in the Fibonacci series by a number located three places further along. For example, 8 divided by 34 equals approximately 0.236.
- 0.382 or 38.2%: this is found by dividing a number in the Fibonacci series by a number located two places further along. For example, 8 divided by 21 equals approximately 0.381.
- 0.786 or 78.6%: square root of 0.618 (√0.618)
NB: 50% is not a Fibonacci number BUT is often used in the Fibonacci tools on charting software.
Fibonacci Retracement
Putting these ratios together gives us the key levels that are factored into Fibonacci retracement drawing tools used in charting software.
These key retracement levels are summarised below:
- Fibonacci Retracement levels: 23.6%, 38.2%, 50%, 61.8% and 78.6%.
The Fibonacci Retracement tool is so named as it is applied to particular chart moves to help identify potential targets with any pullback / retracement. The Fibonacci retracement tool, factored with the levels noted above, is applied to either a swing Low or swing High move and used to identify potential areas of interest to monitor for any new price action move on a pullback. The most popular Fibonacci retracement level is the 61.8% level and this is widely found to act as a magnet for price action retracement moves. It is not magic; it is more likely due to herd mentality as so many traders and trading institutions use this in their trading.
Applying Fibonacci Retracement to Citigroup
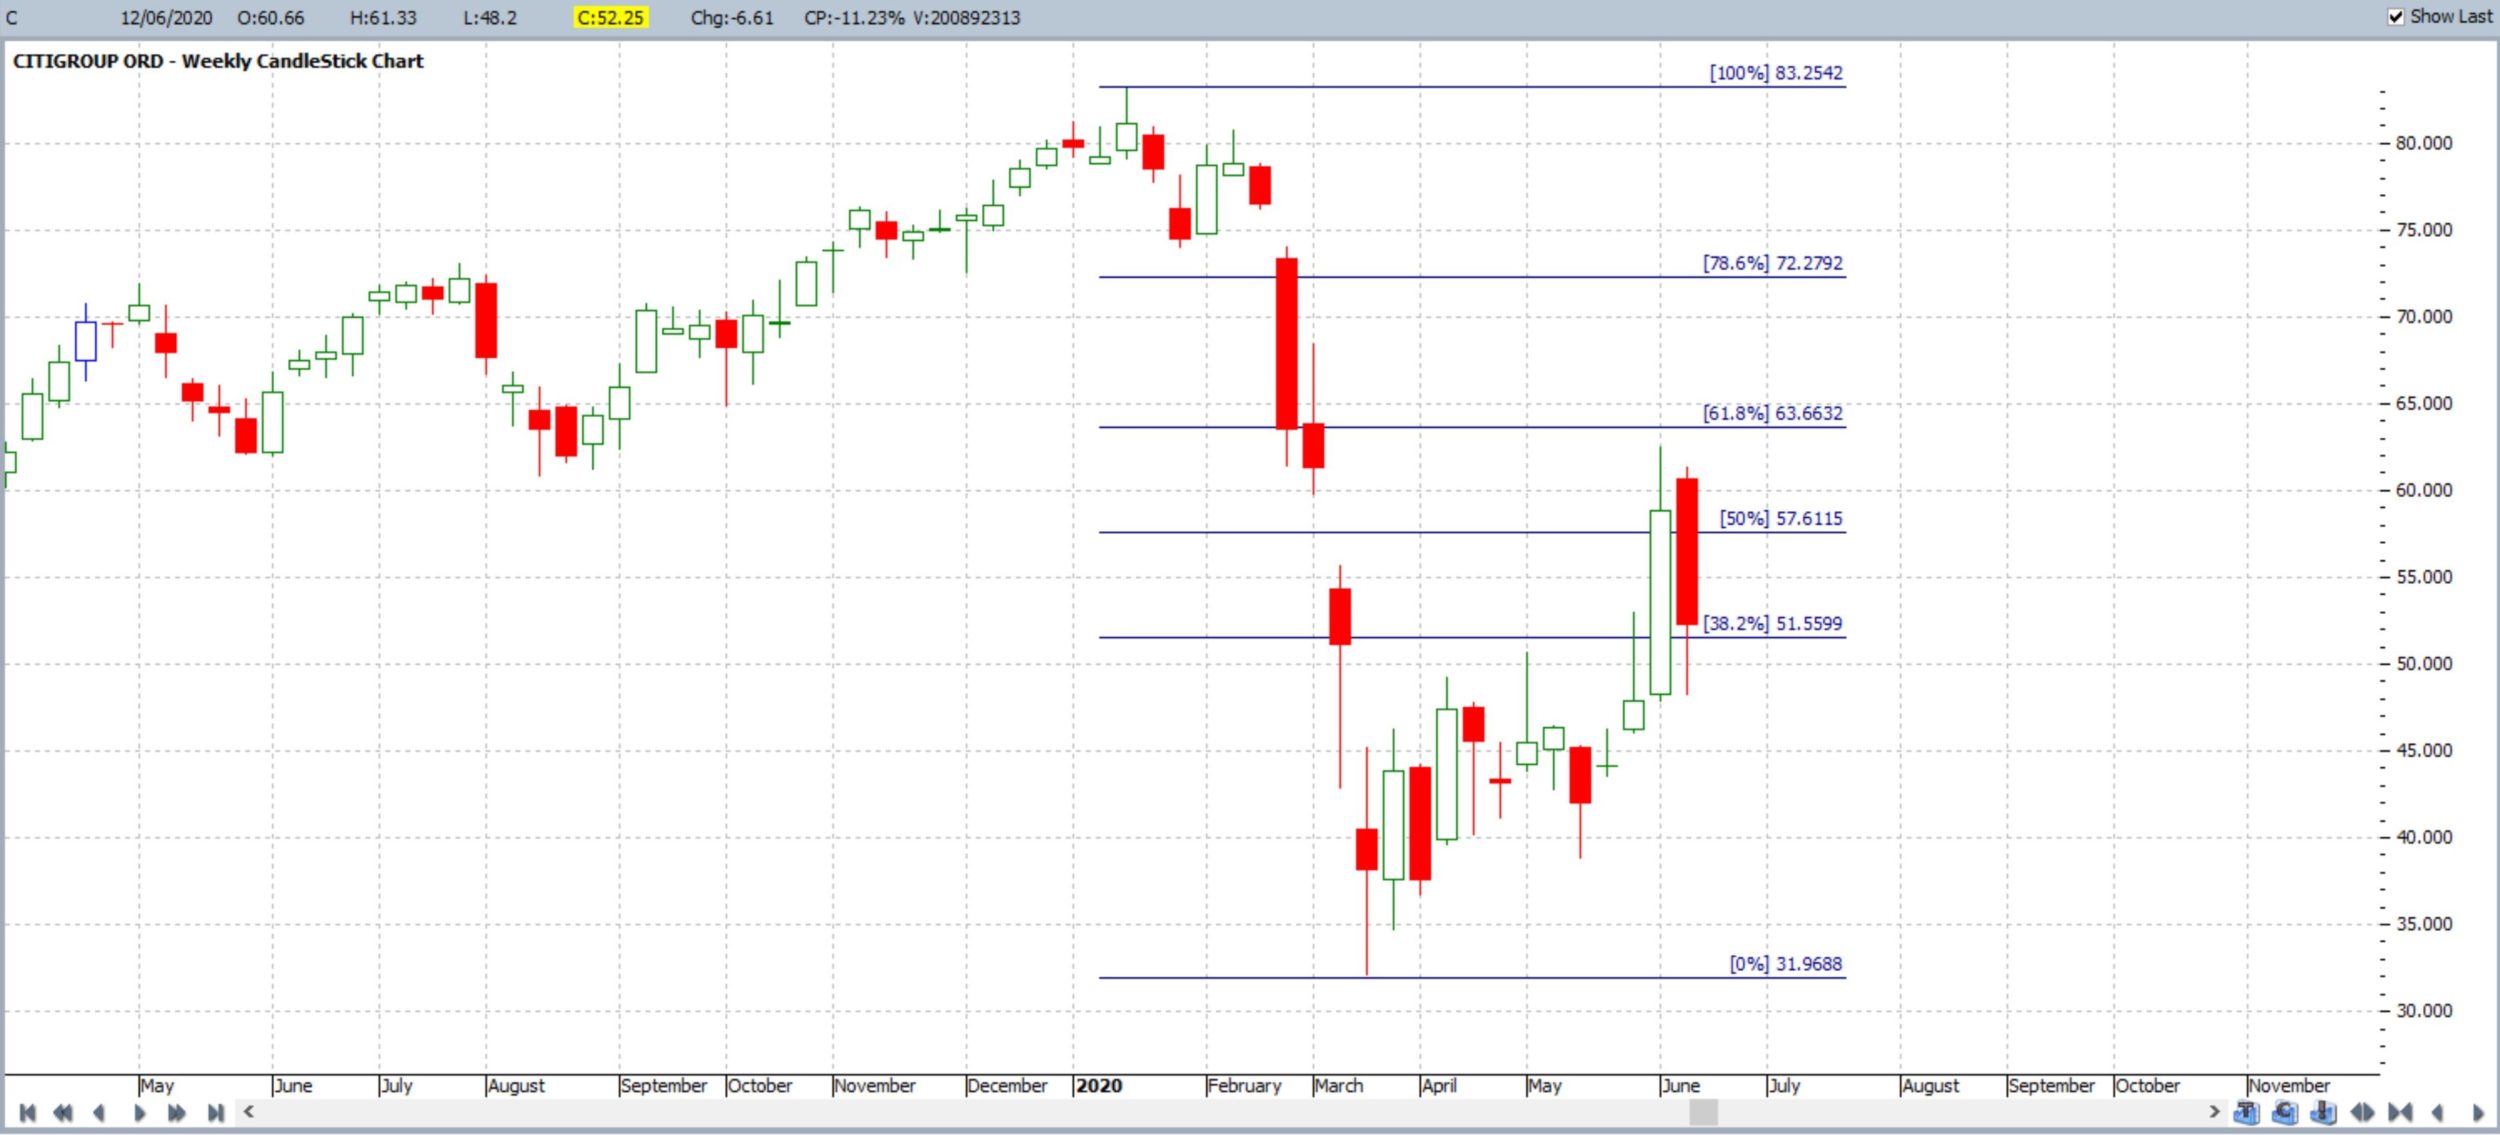
It is at this point that we go back to our chart of Citigroup. The chart in Figure 7 shows the swing Low move from January 2020 through to March 2020. A Fibonacci retracement tool has been applied to this swing Low move for the purpose of trying to identify any possible target; should price action attempt a recovery move. Note how the popular 61.8% Fibonacci level is up near the $63.50 level:
Figure 7: Citigroup weekly + Fibonacci retracement
The chart in Figure 8 reveals that price action did indeed bounce off the lows and look where price almost made it to! The 61.8% Fibonacci level.
Figure 8: Citigroup weekly + Fibonacci retracement
Concluding comments
Fibonacci retracement is a popular charting tool used by traders to help identify potential price action targets on the charts of trading instruments. I regularly apply Fibonacci retracement to my charts to help identify potential take-profit target areas. There are other pages on my Tradecharting site where I have given examples of the high-probability value of using the 61.8% Fibonacci level and these can be found here and here. I encourage you to seek out the Fibonacci Retracement tool on your charting software and practise applying this to various swing Low and / or swing High moves to check to see how frequently the 61.8% level is reached. I think you might be surprised by what you find!