The ‘Descending Wedge‘ is one of my preferred technical patterns as I have found these to be very useful for helping to identify reversal moves. They often drift sideways for a bit after the initial wedge trend line breakout but, more often than not, eventually pick up steam.
Some patterns that I have identified over recent years are illustrated below and I will add to this list as the charts present.
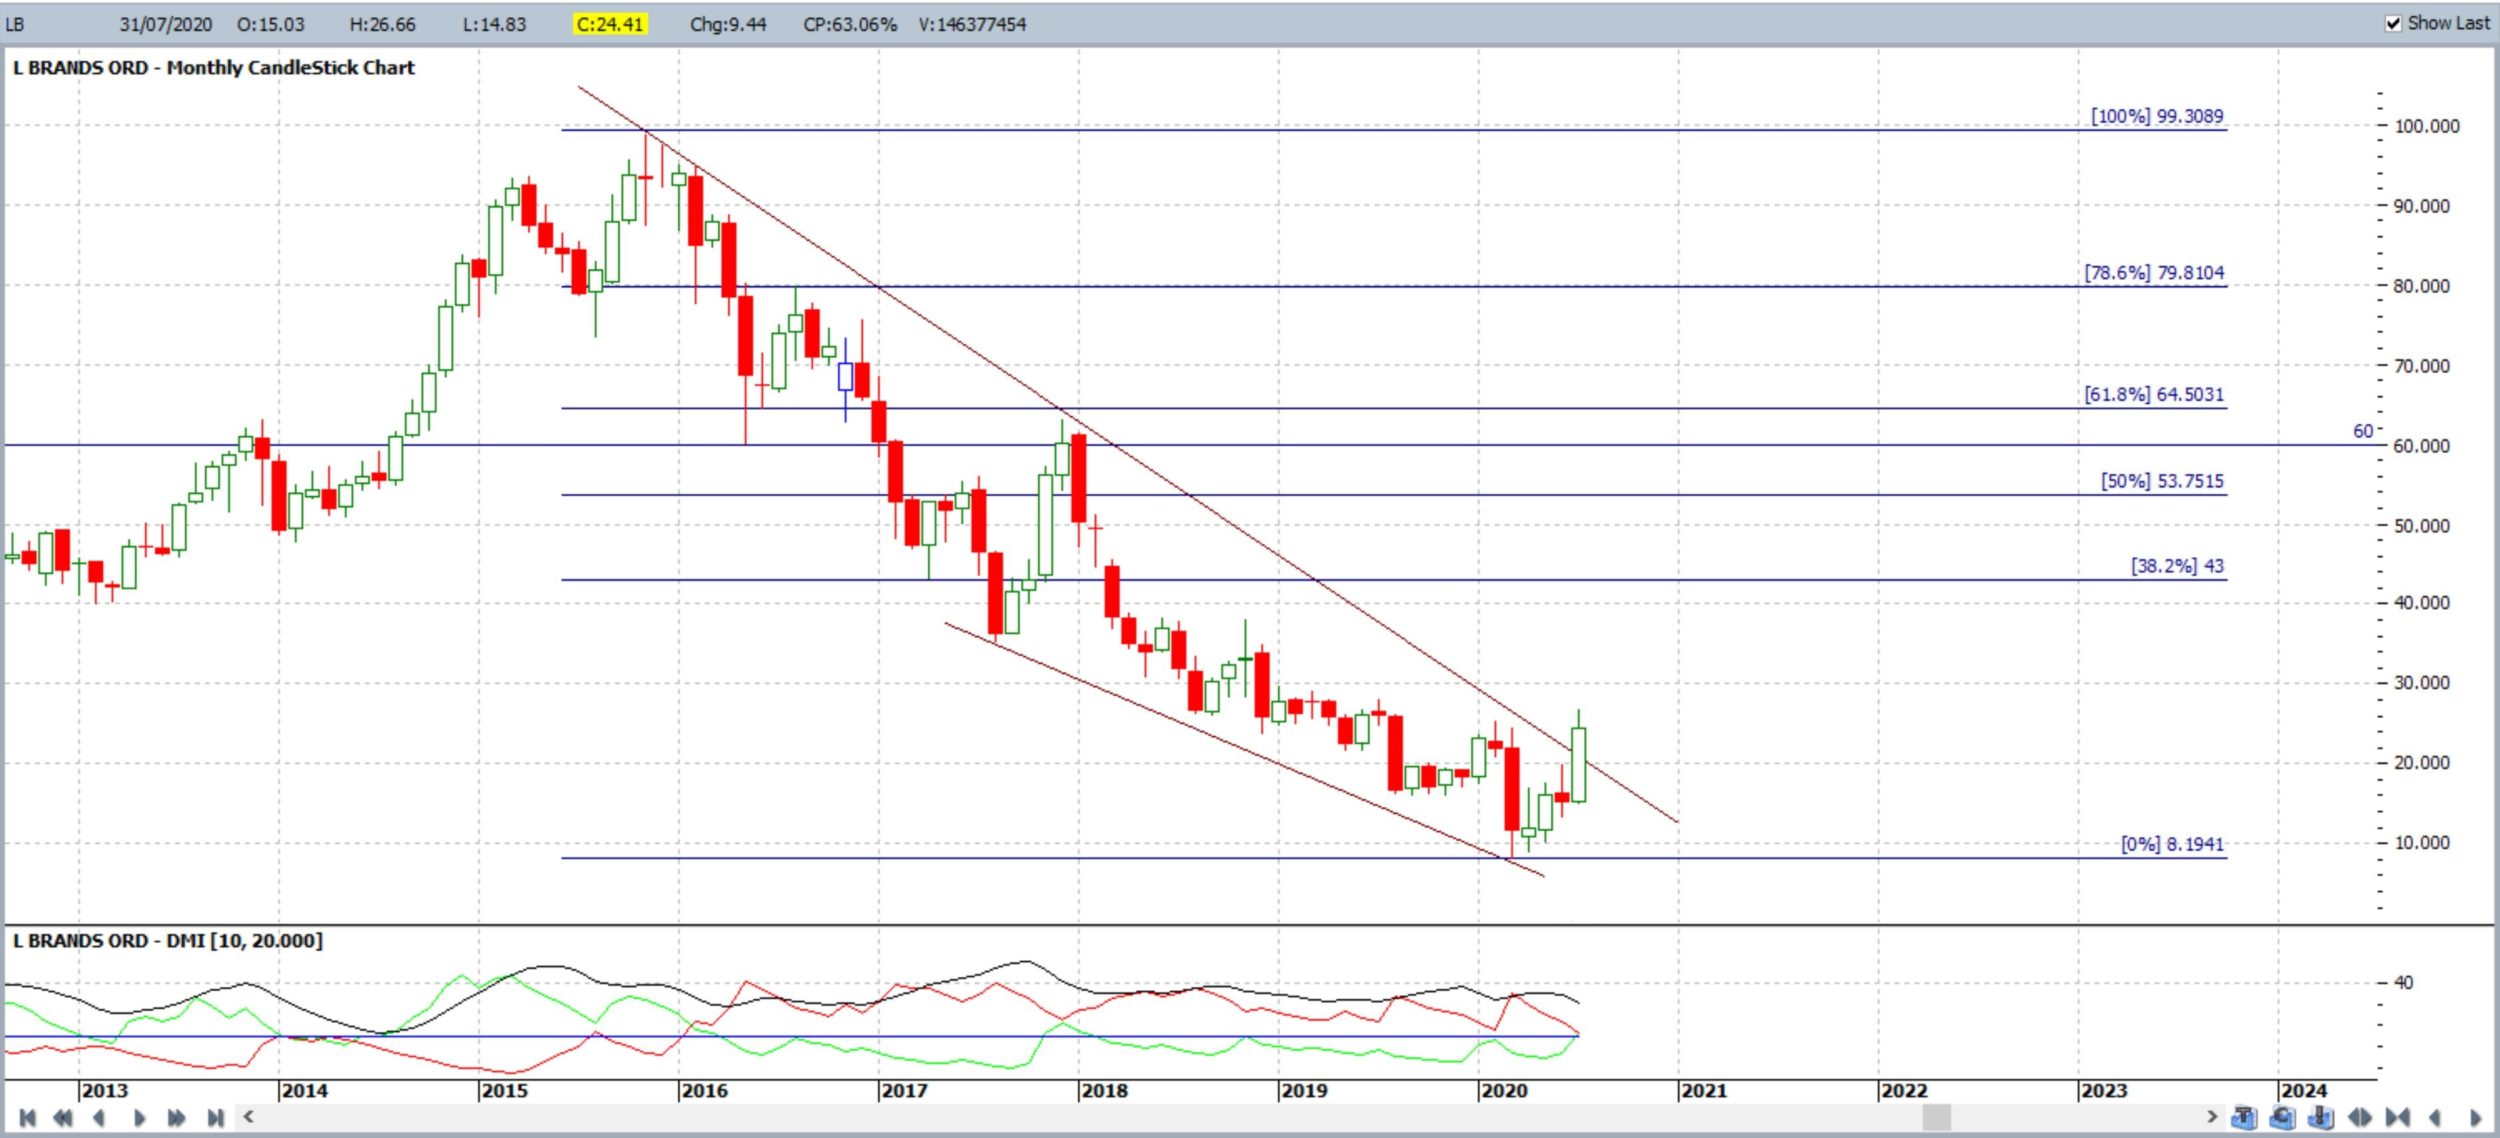
L Brands LB: another great wedge breakout:
LB monthly: wedge breakout triggered in July 2020:
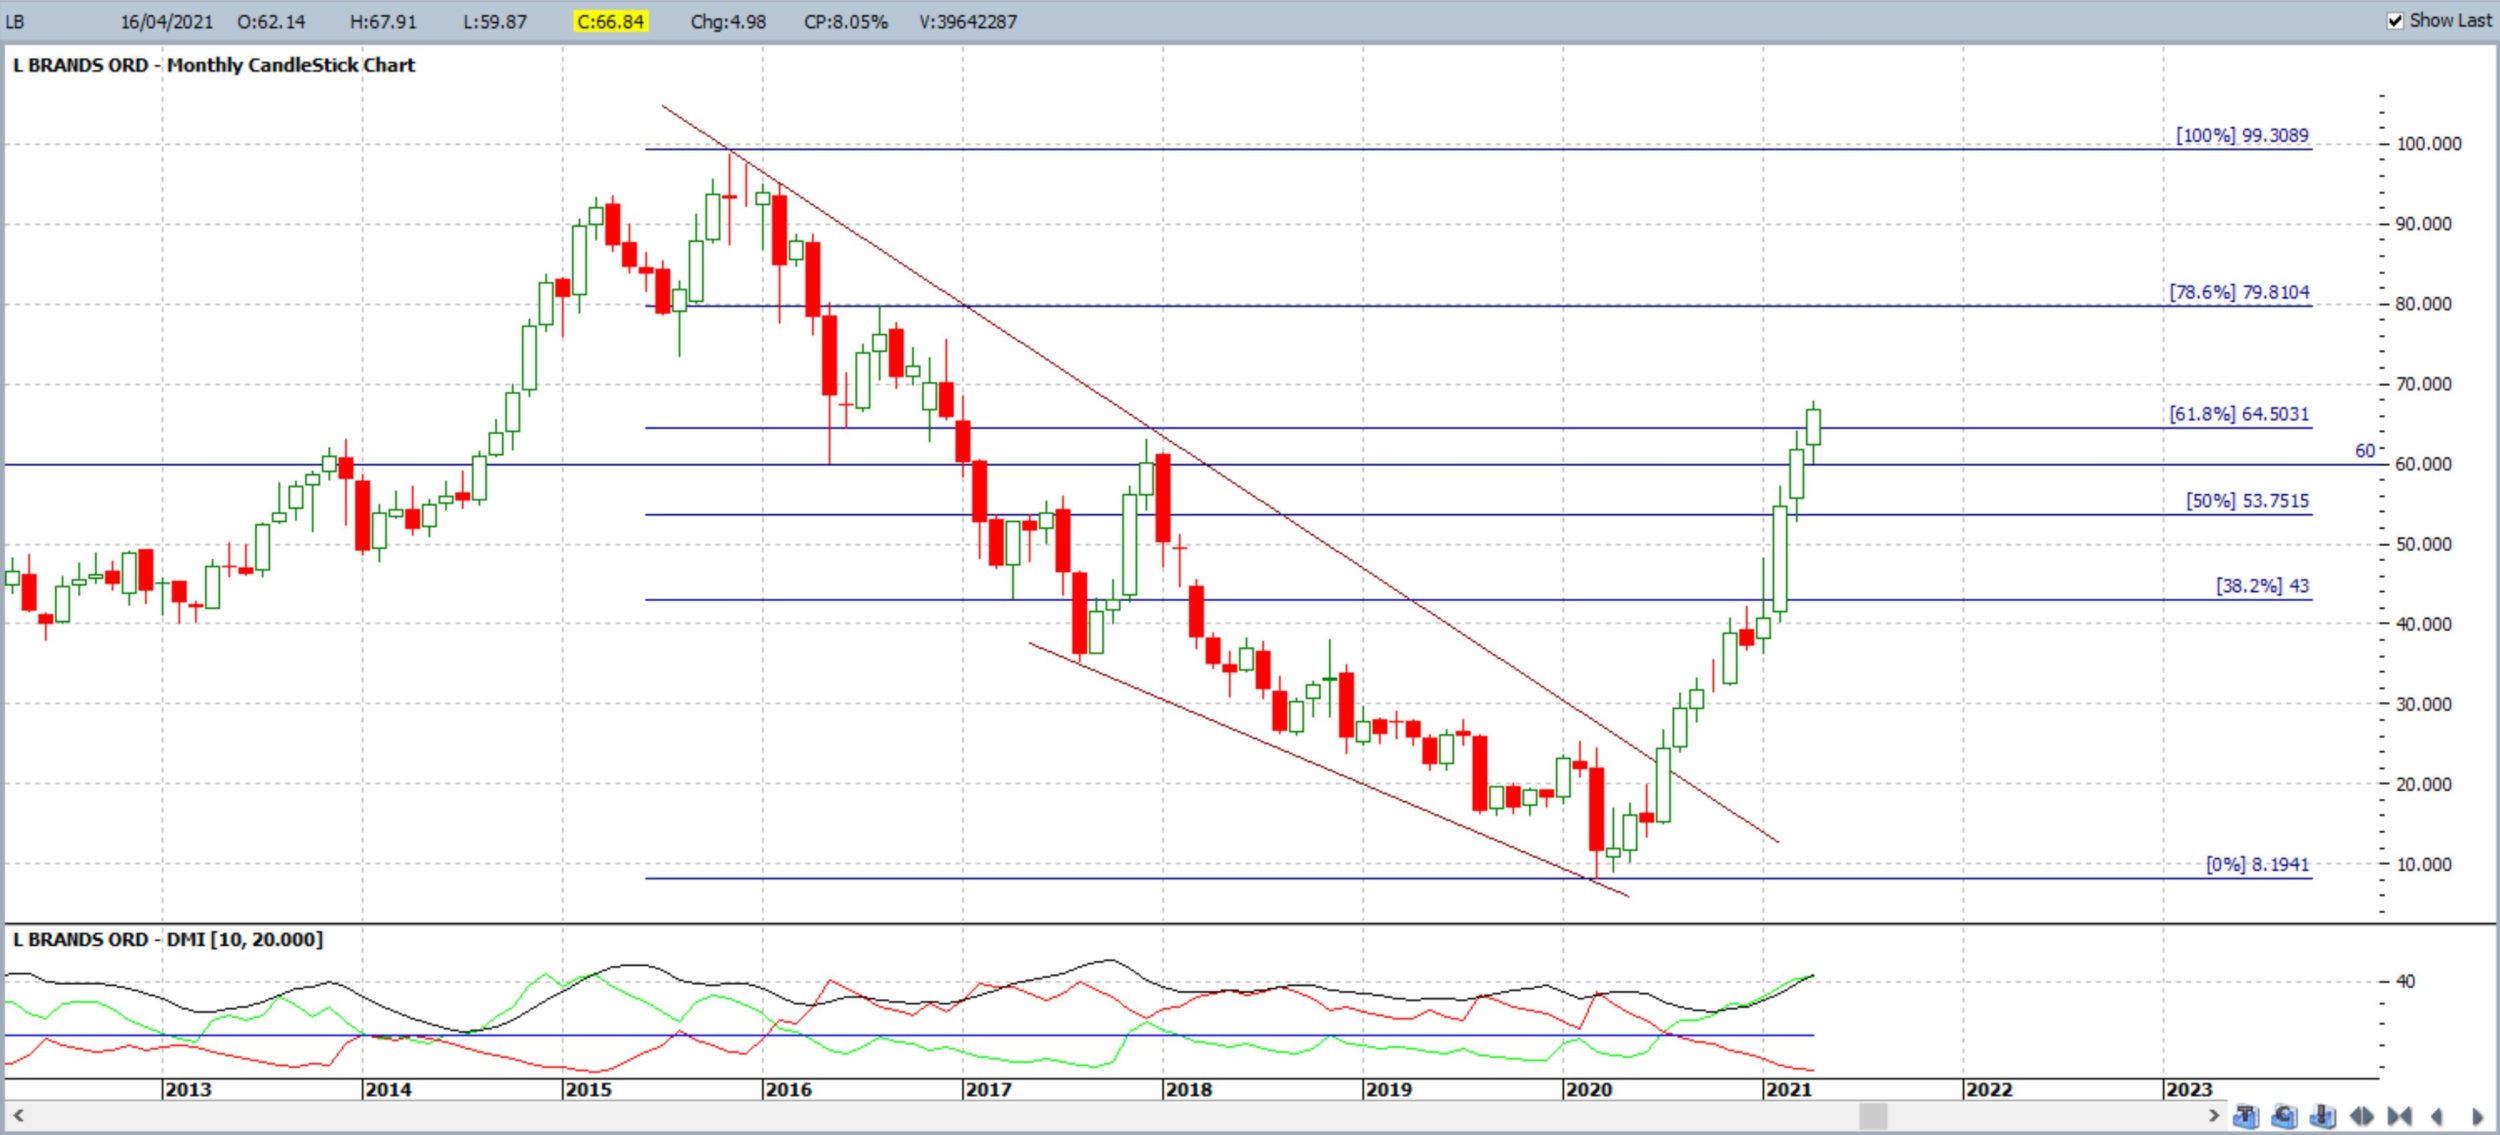
LB monthly: wedge completed by April 2021:
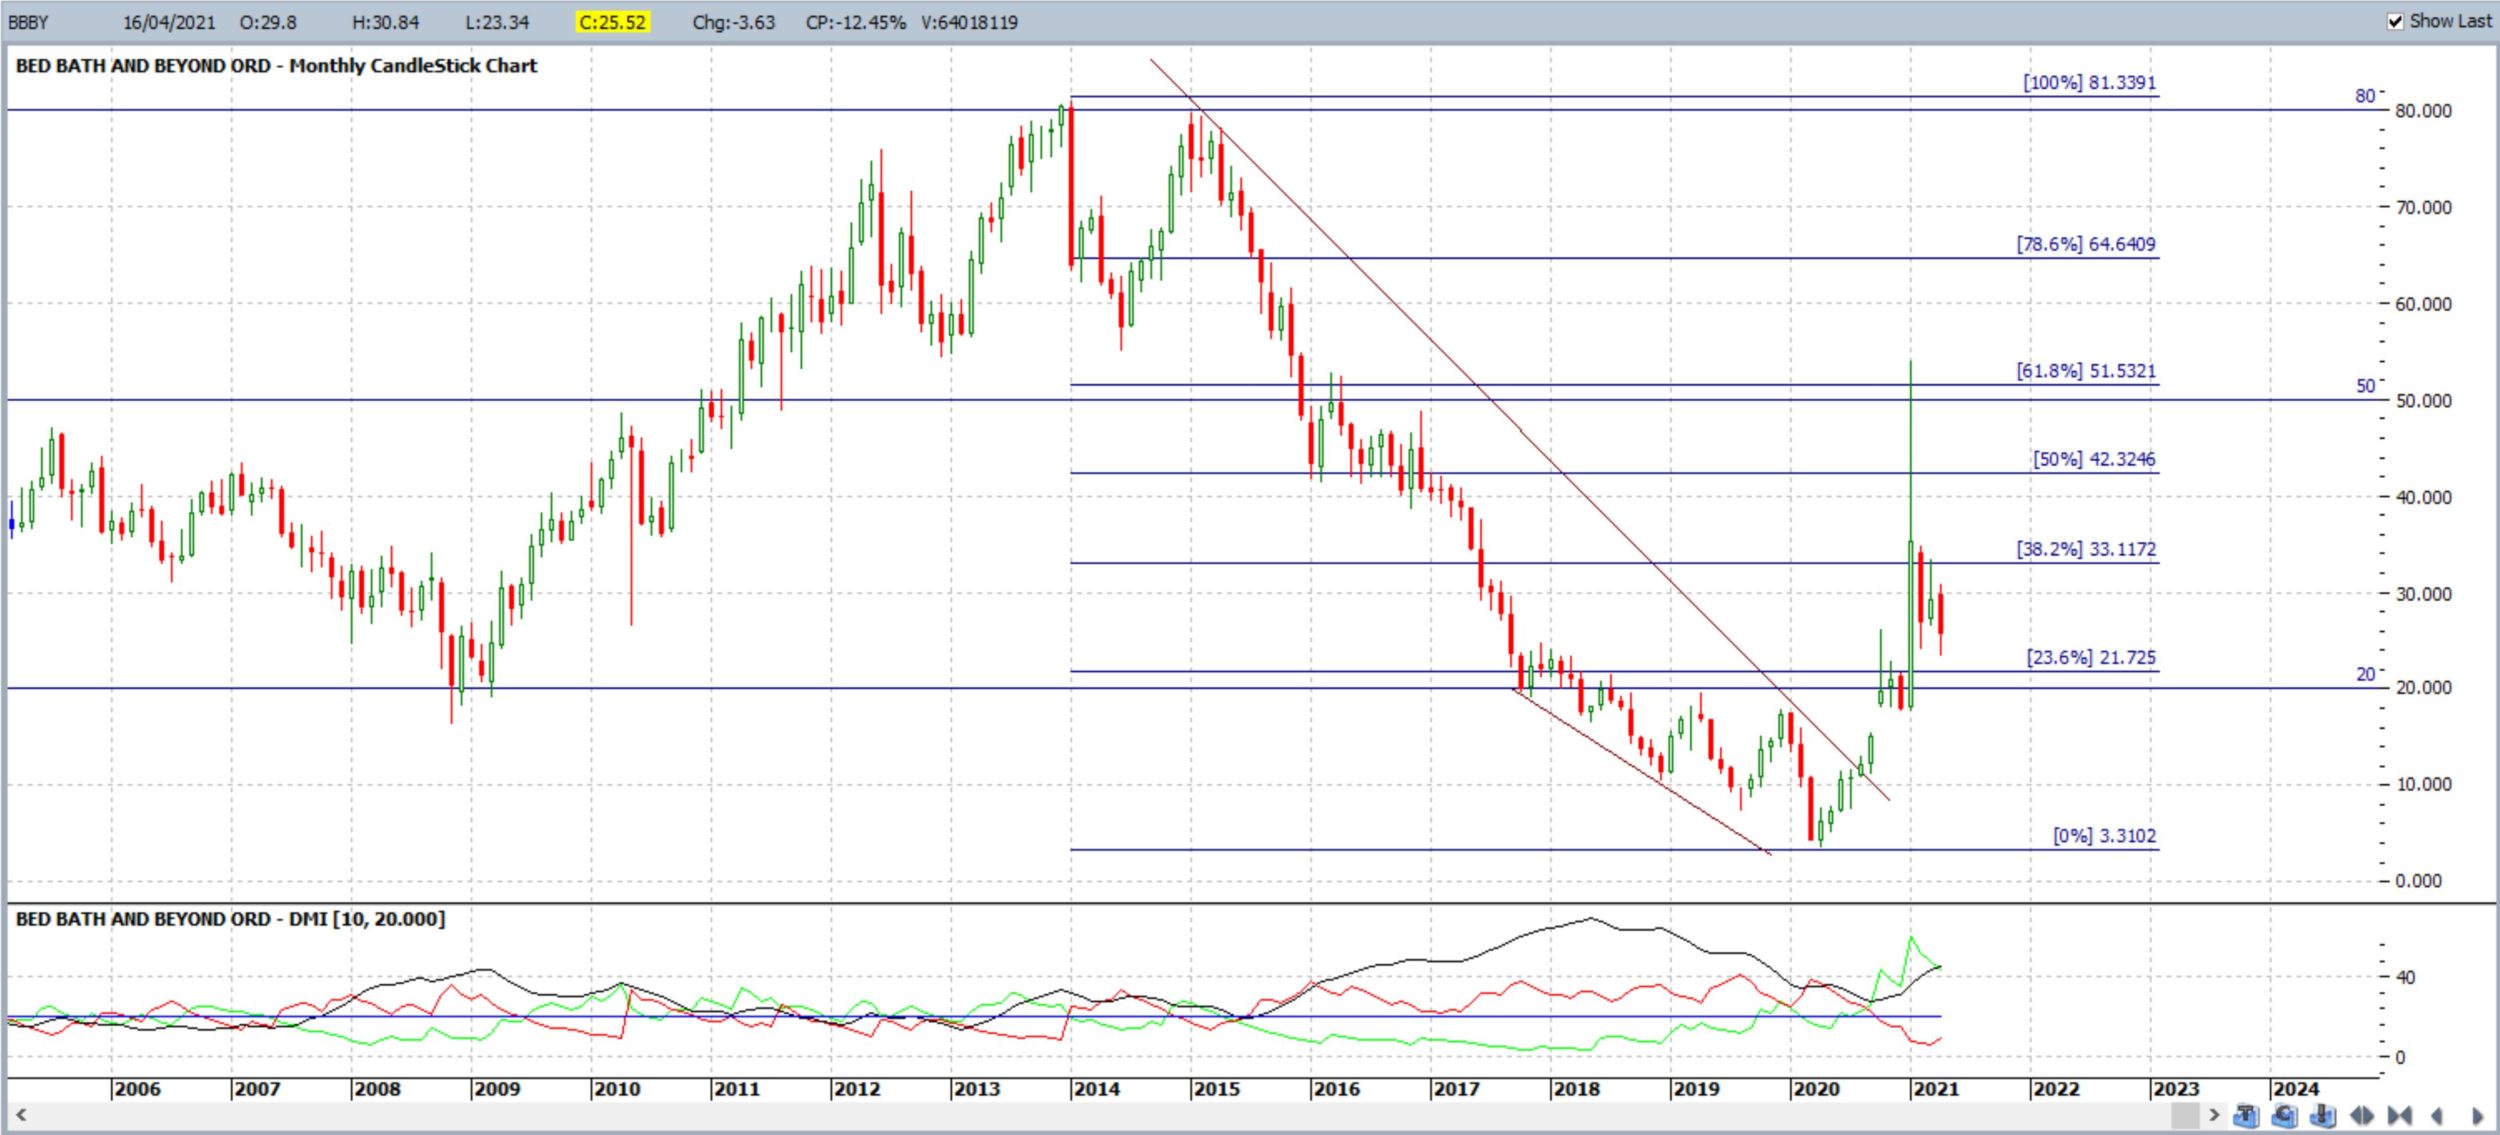
Bed, Bath and Beyond BBBY 2021: This descending wedge was noted on Twitter in October 2020 and the $50 target was reached (by spike action) in January 2021:
BBBY monthly: breakout from Oct 2020:
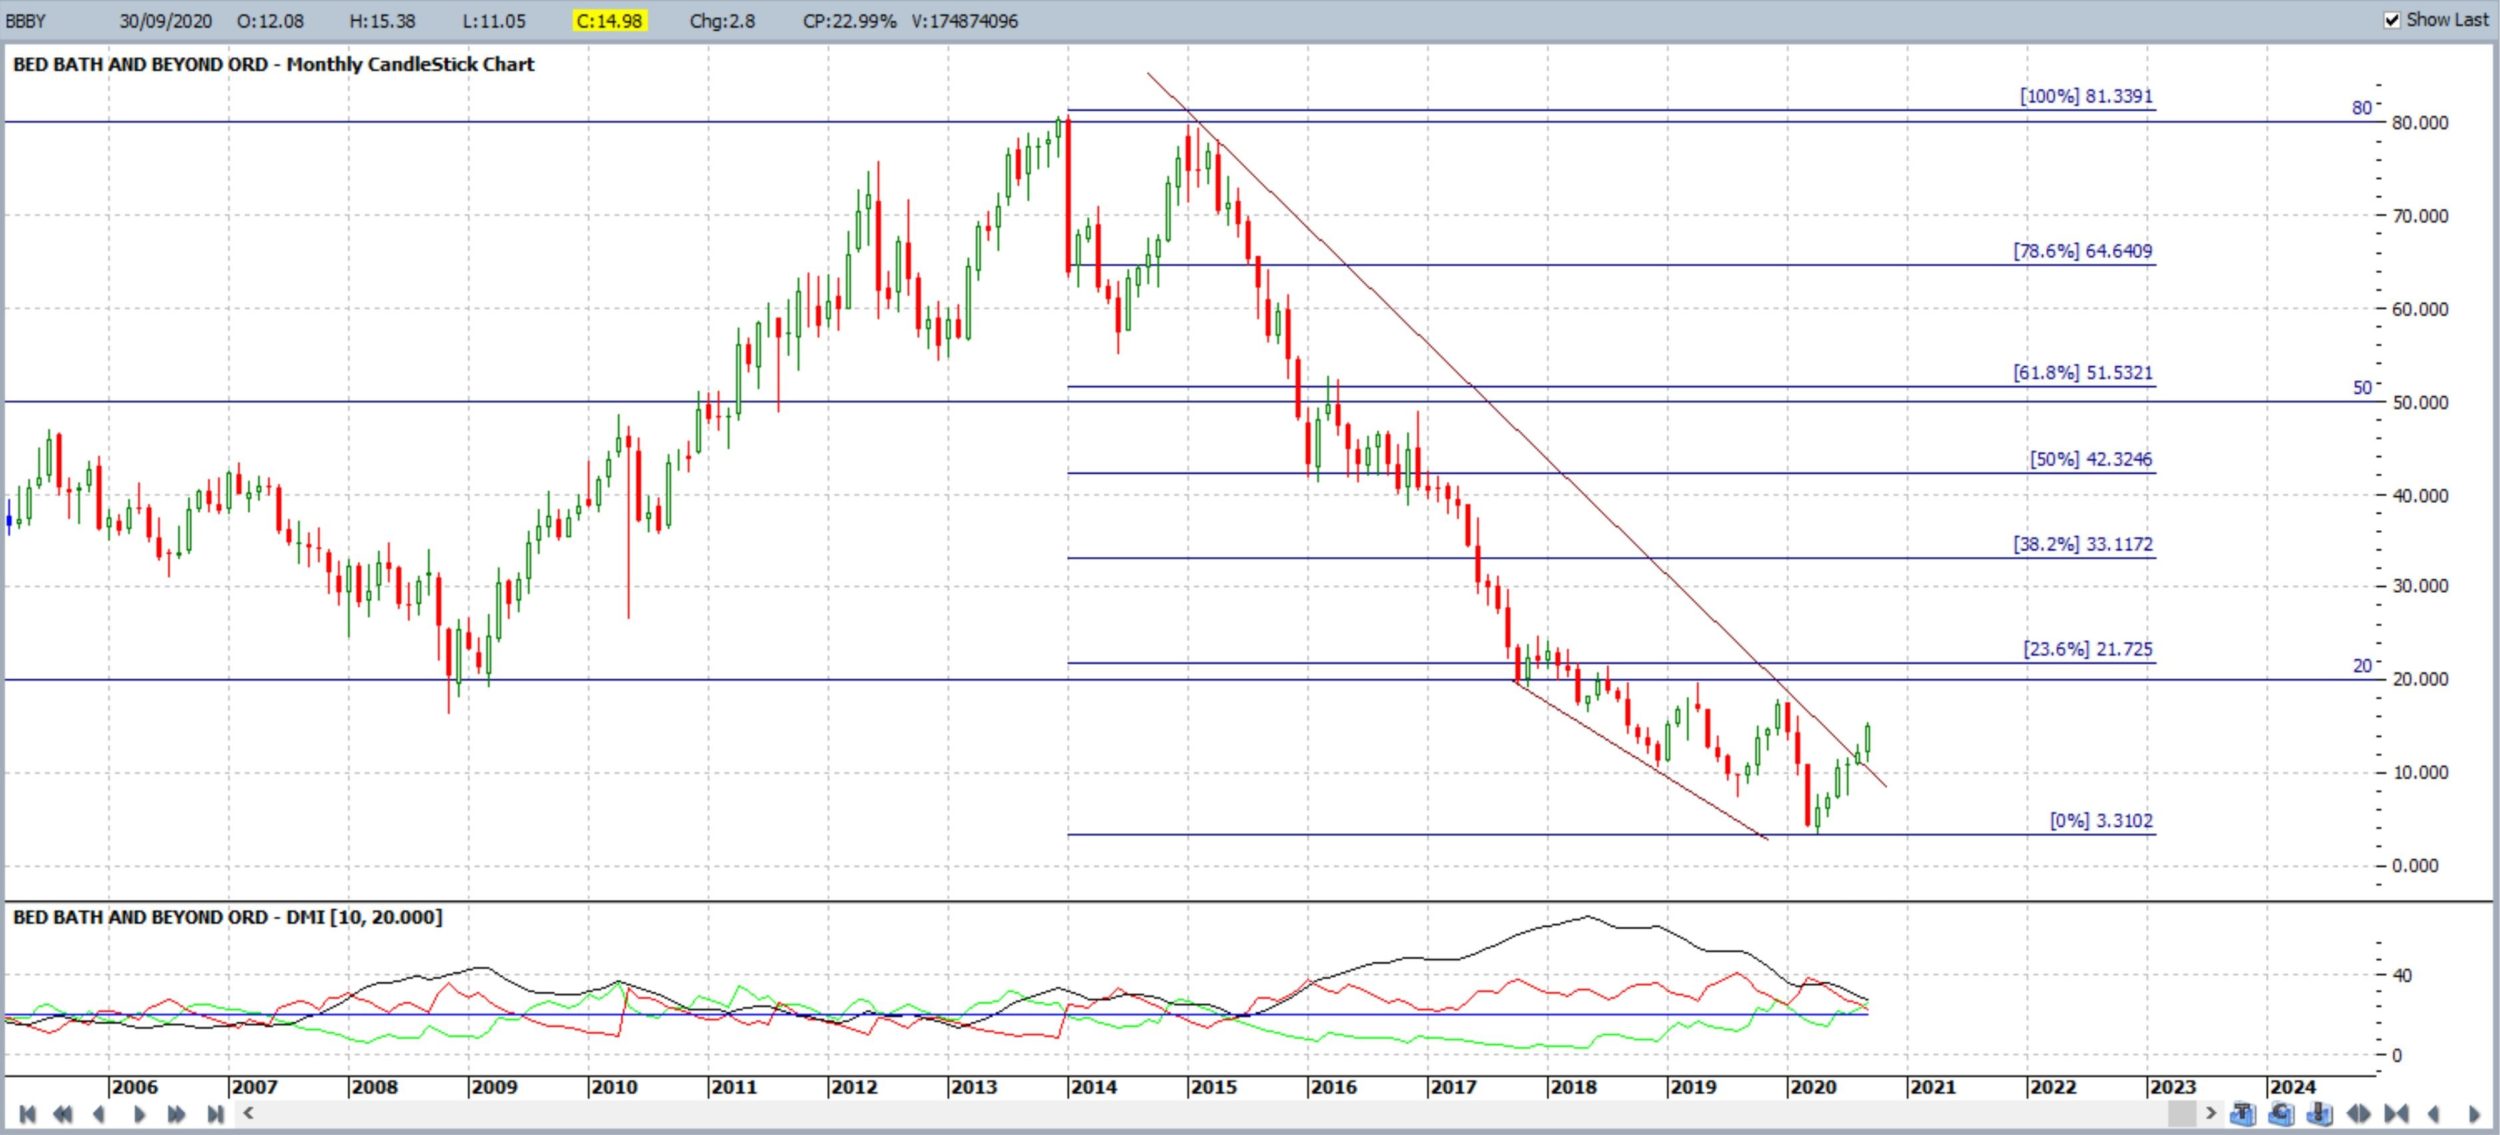
BBBY monthly: the $50 target reached with a spike:
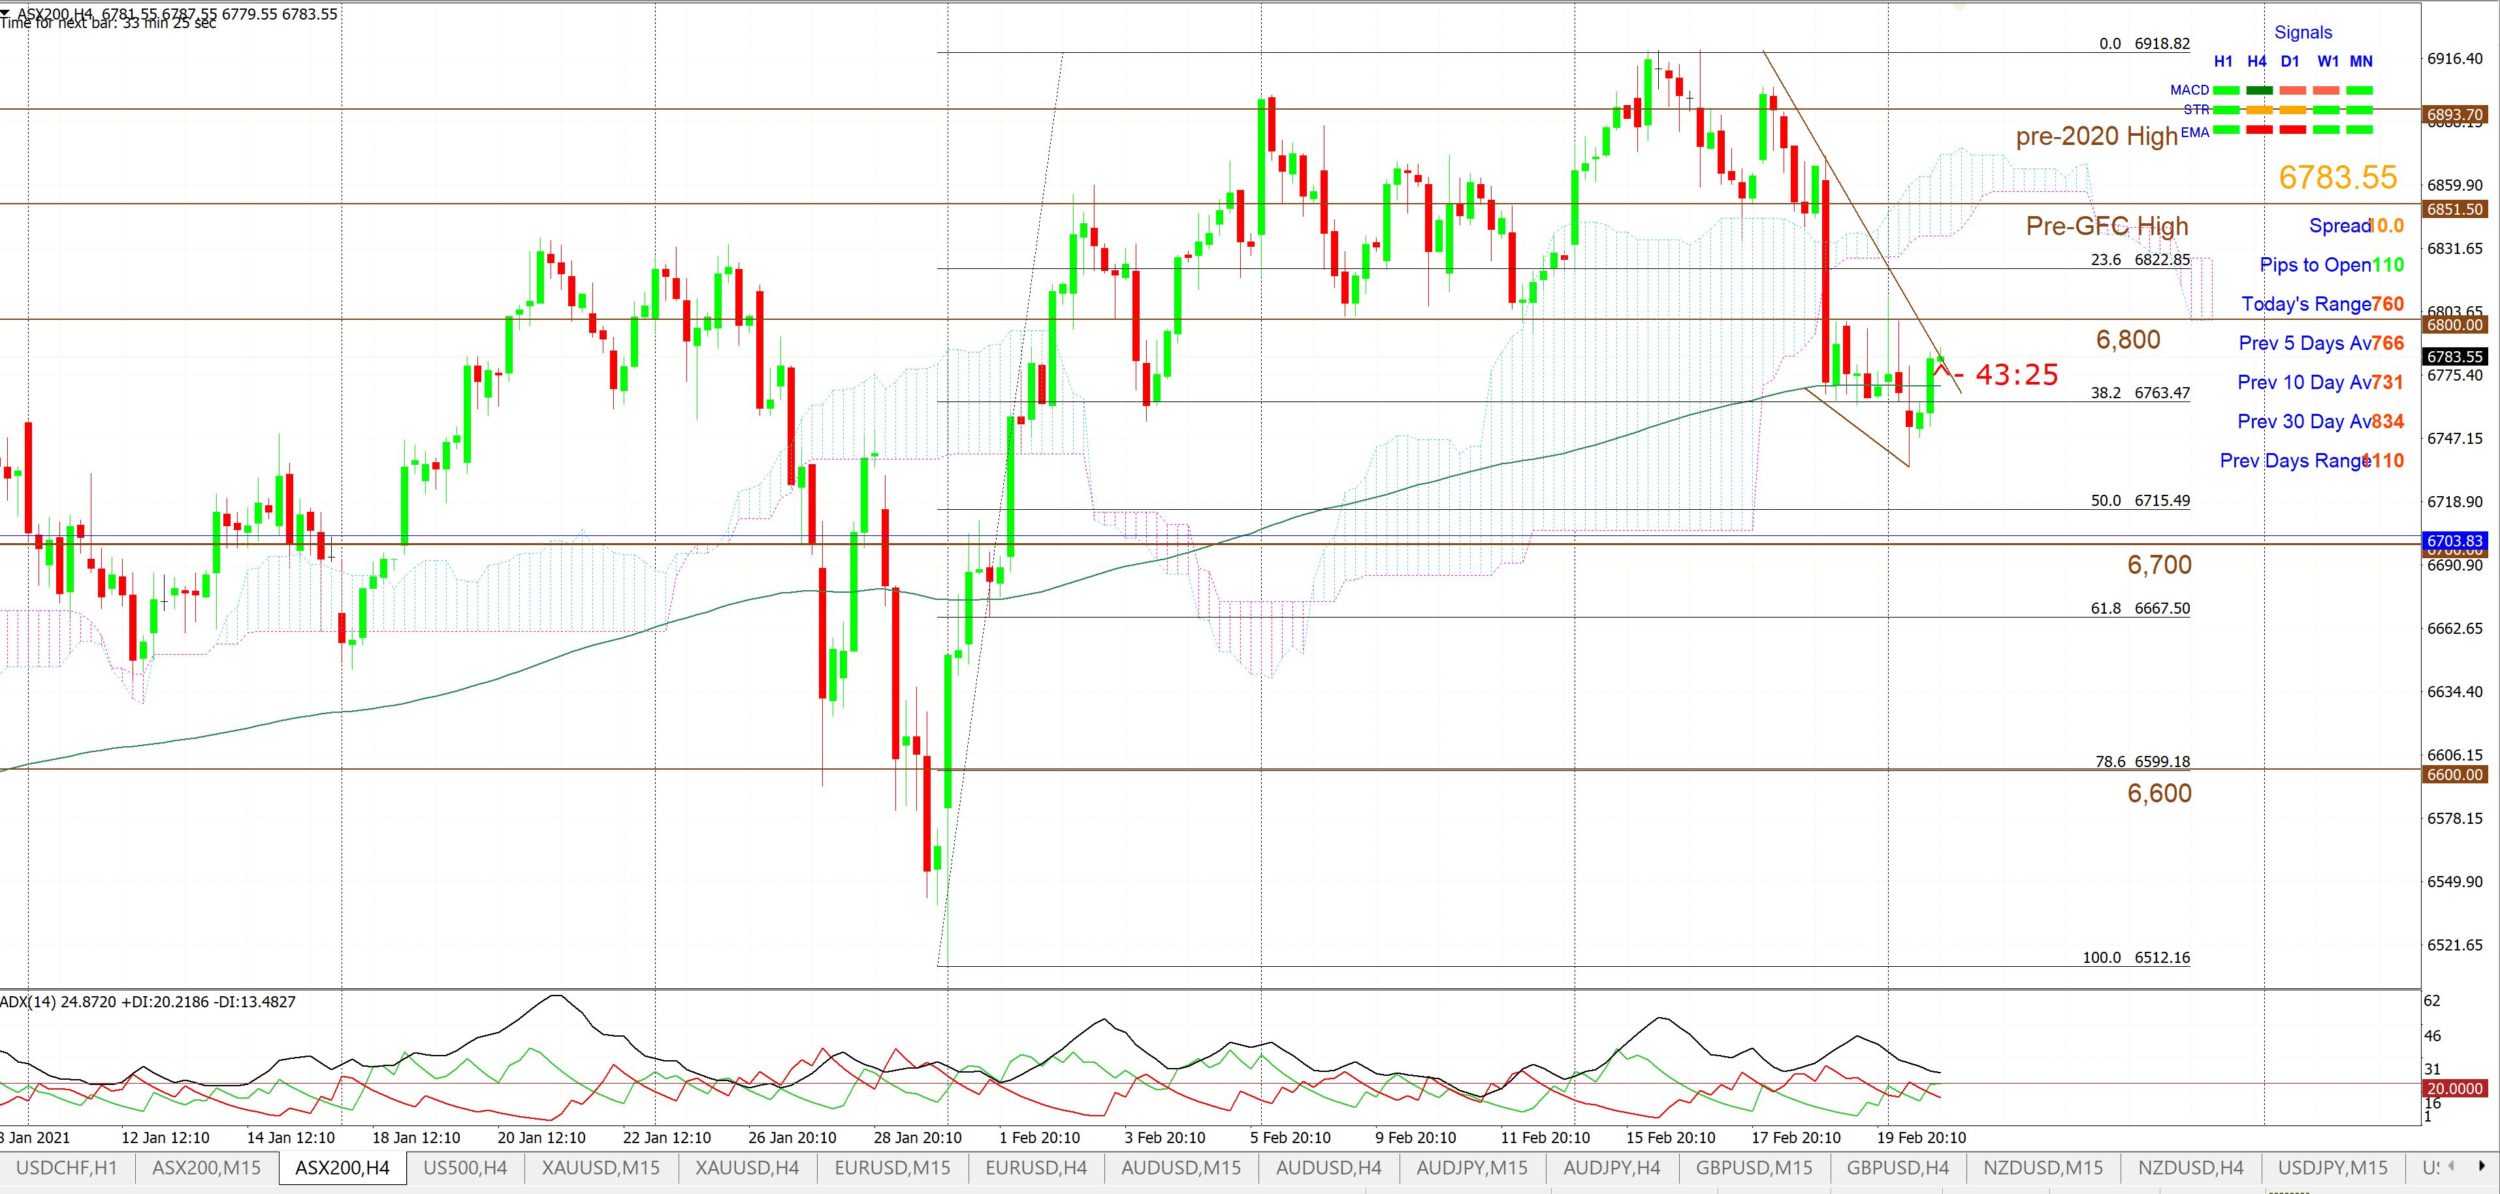
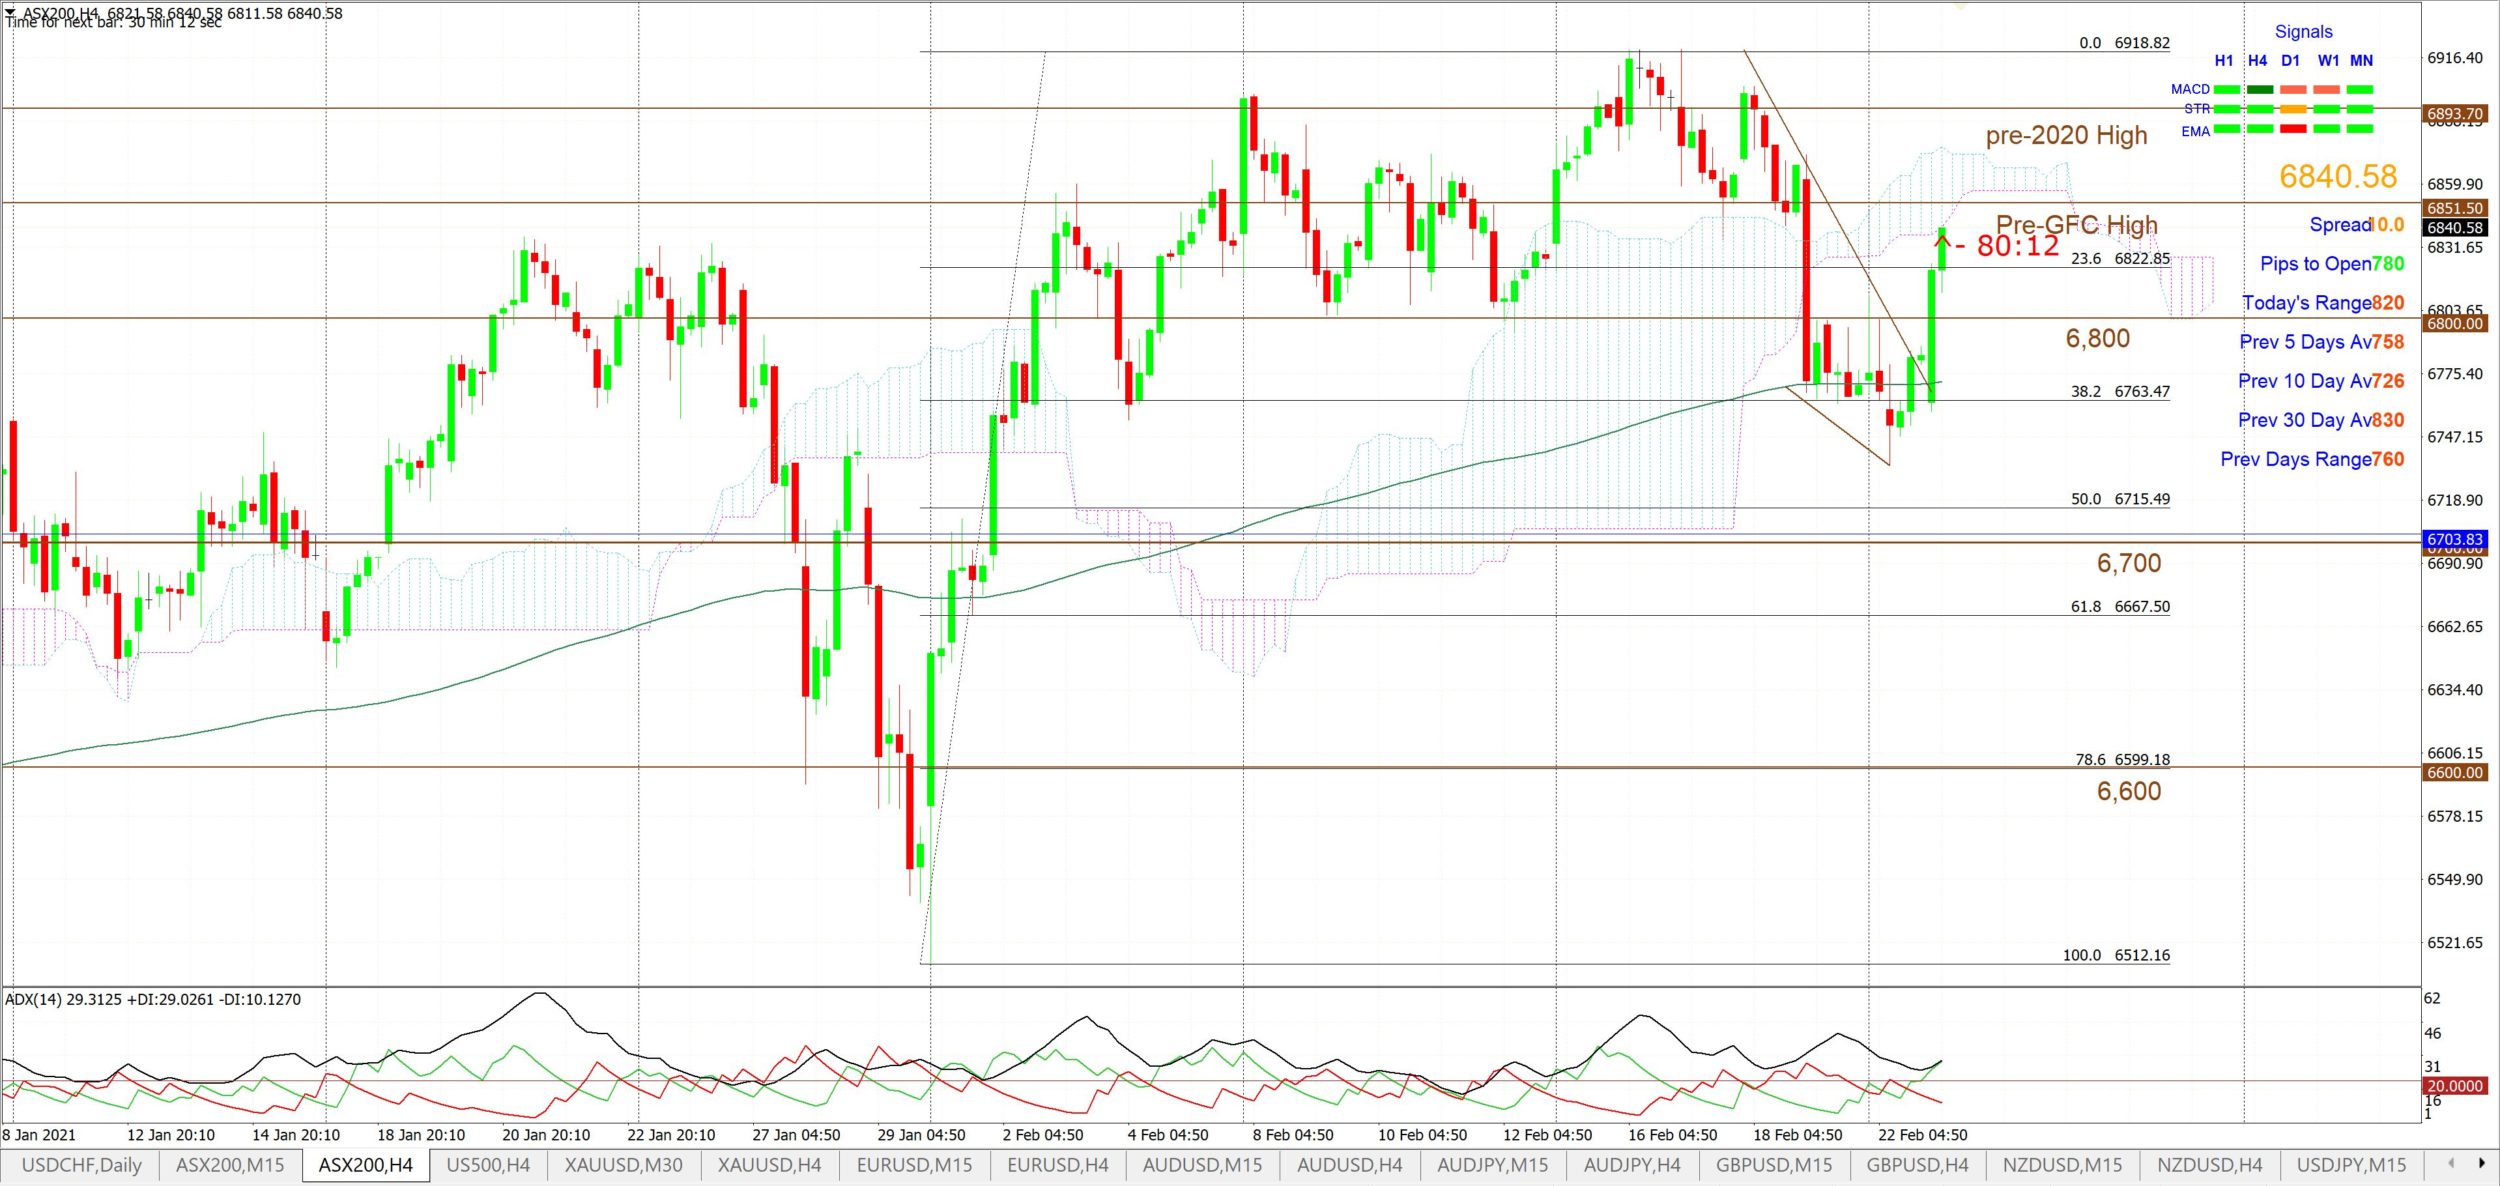
ASX-200 February 2021: This 4hr chart Descending Wedge was noted on February 23rd for subscribers and broke out to the upside during the day.
ASX-200 4hr: chart posted in morning of February 23rd for subscribers:
ASX-200 4hr: chart later the same day after b/o:
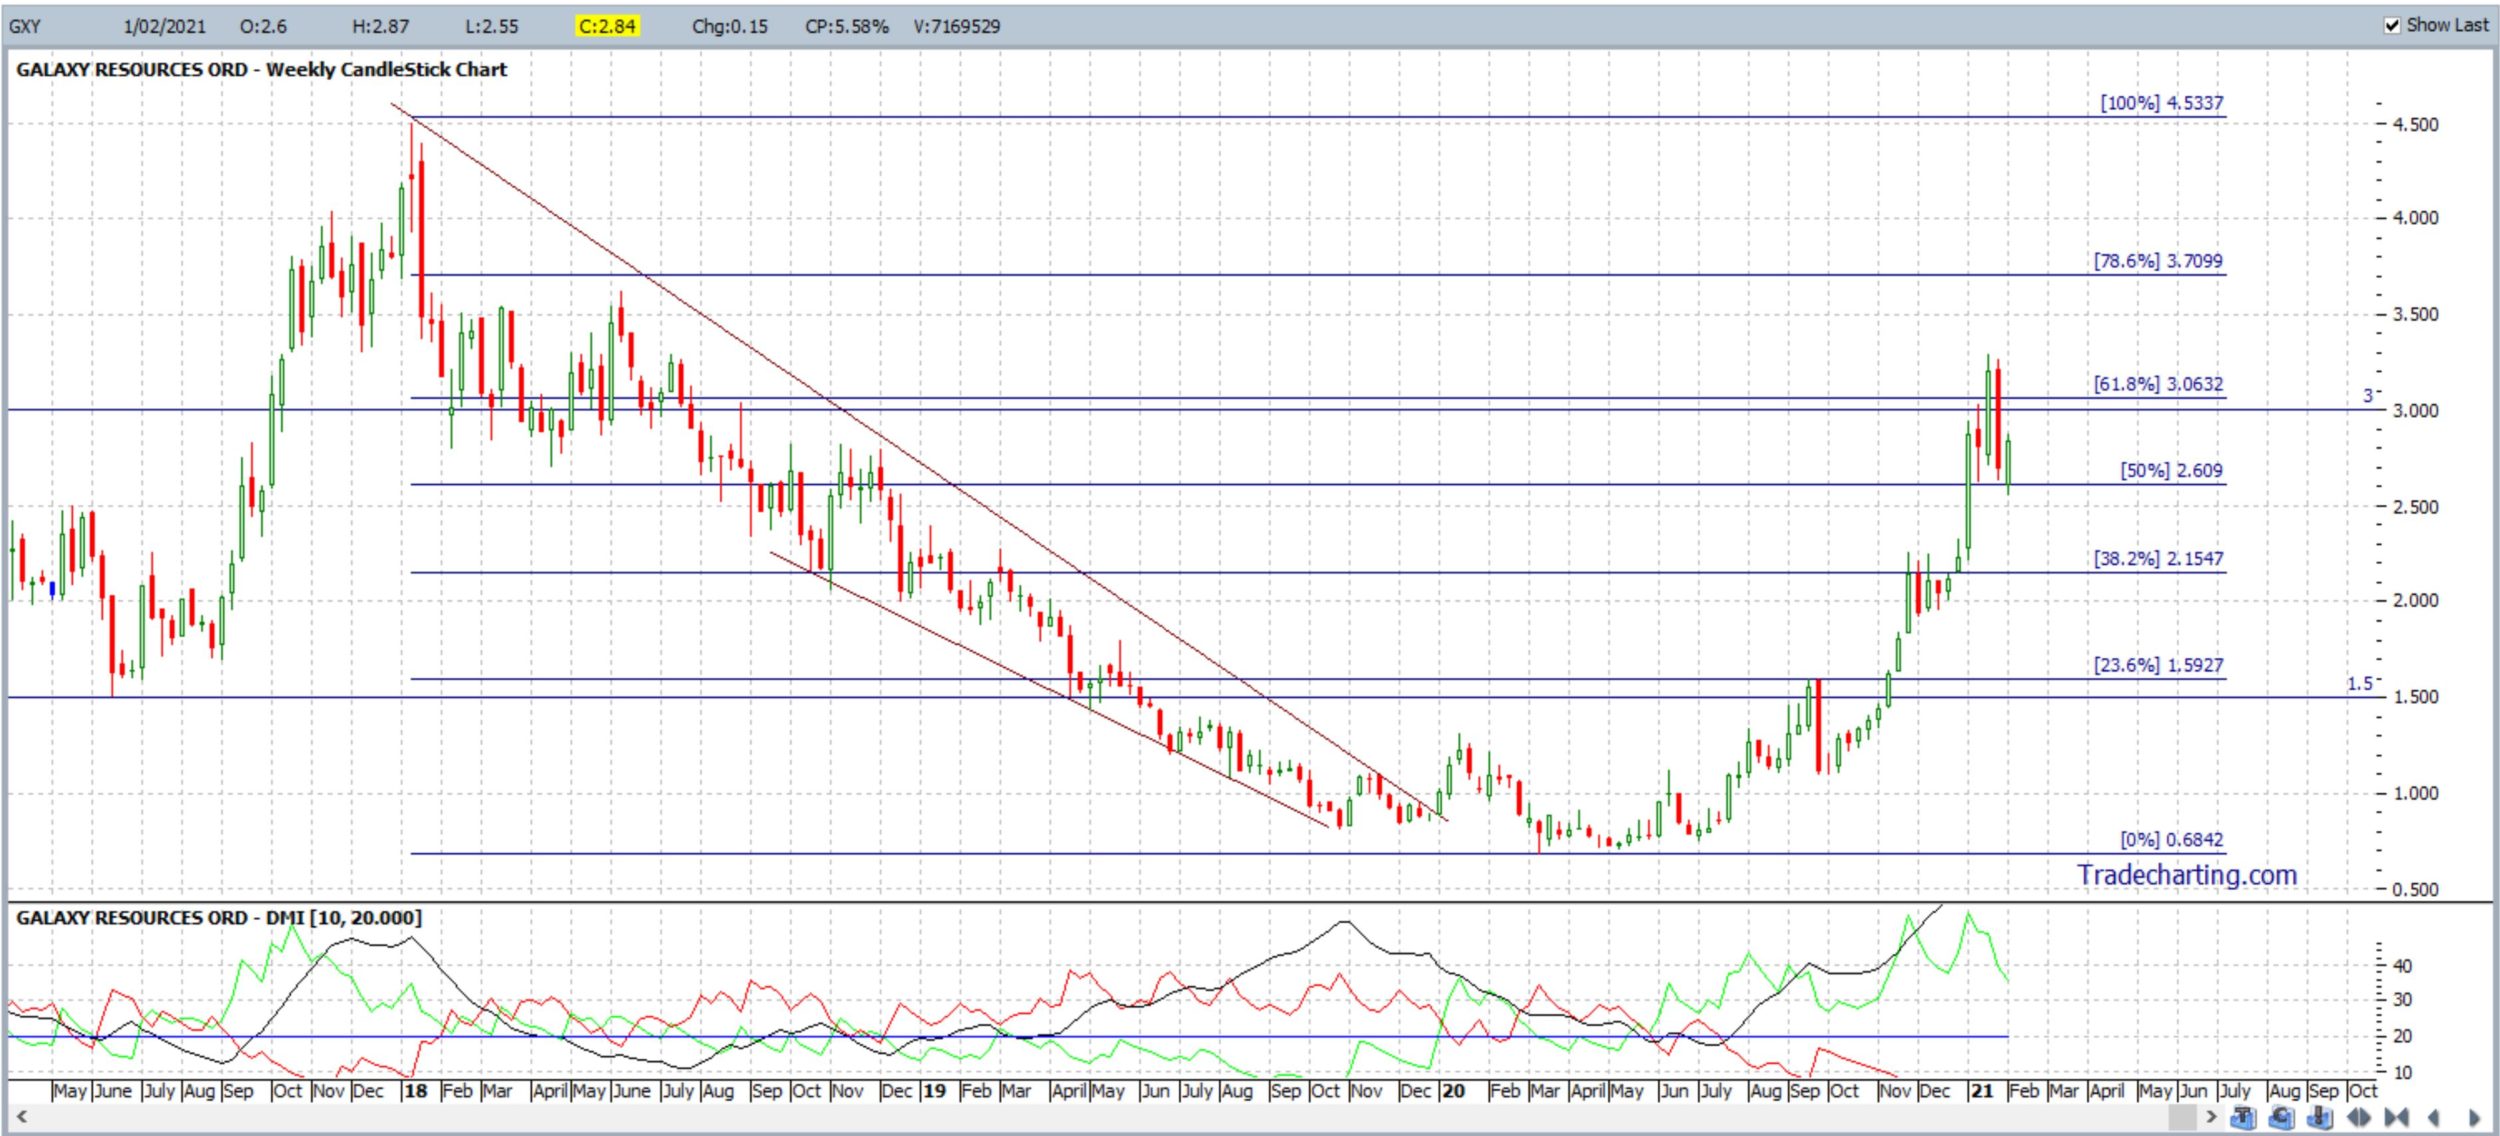
Galaxy Resources GXY February 2021: This Descending Wedge breakout took a long time but was eventually successful. First Tweeted in early 2020:
GXY weekly: the wedge b/o triggered in early 2020:
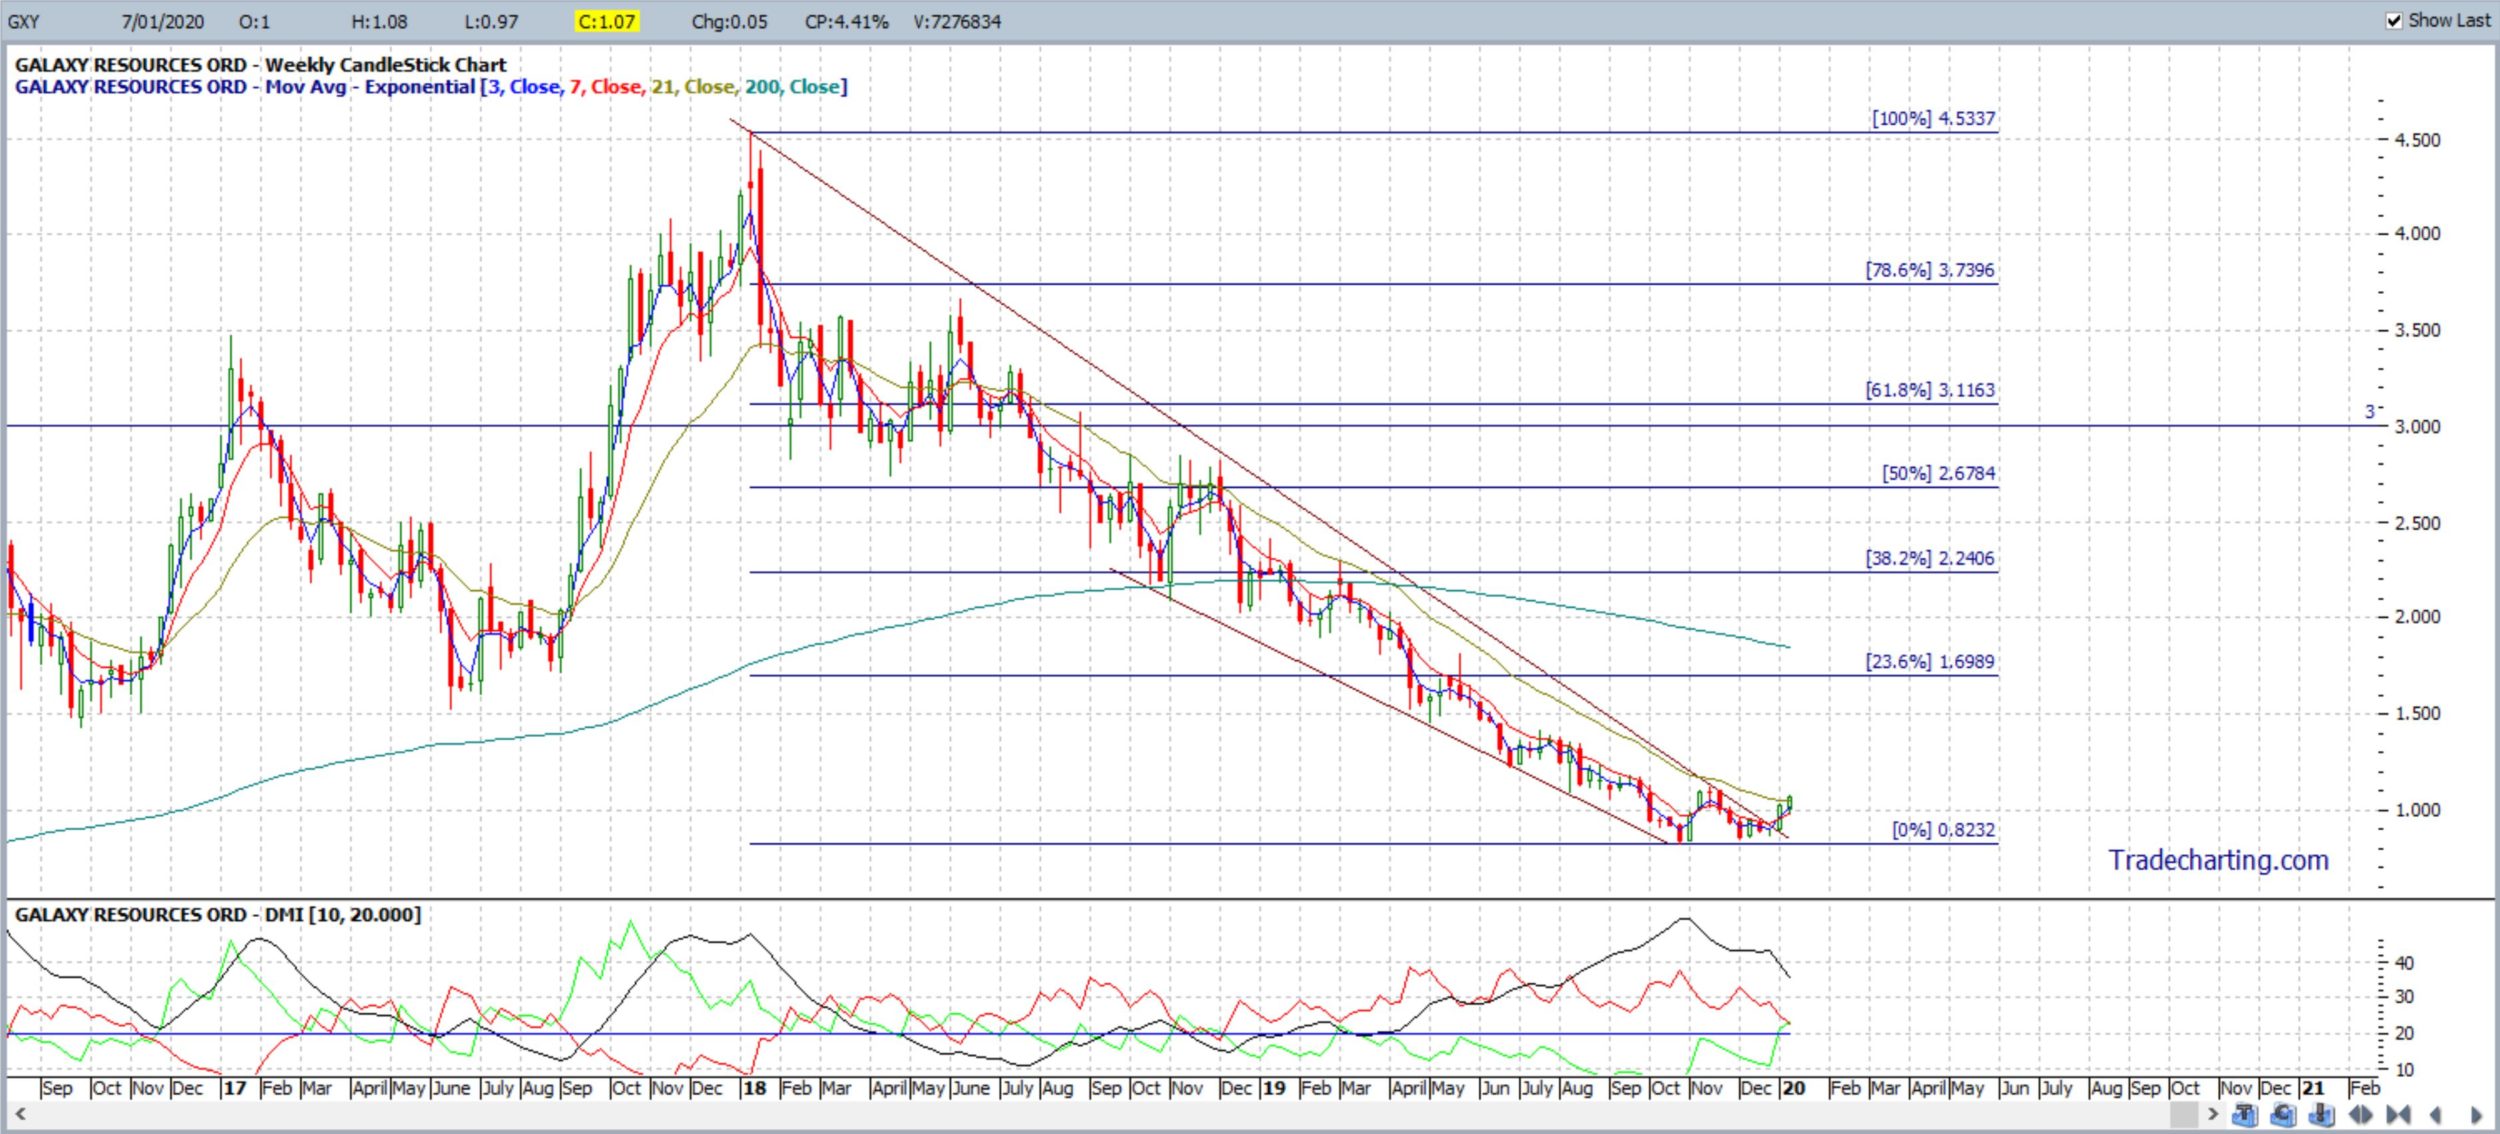
GXY weekly: the wedge target reached in Jan 2021:
ASX-200 February 2021: note how price action made a Descending Wedge breakout AND tested the 61.8% Fibonacci:
ASX-200 4hr: this descending wedge chart was posted on Monday 1st Feb:
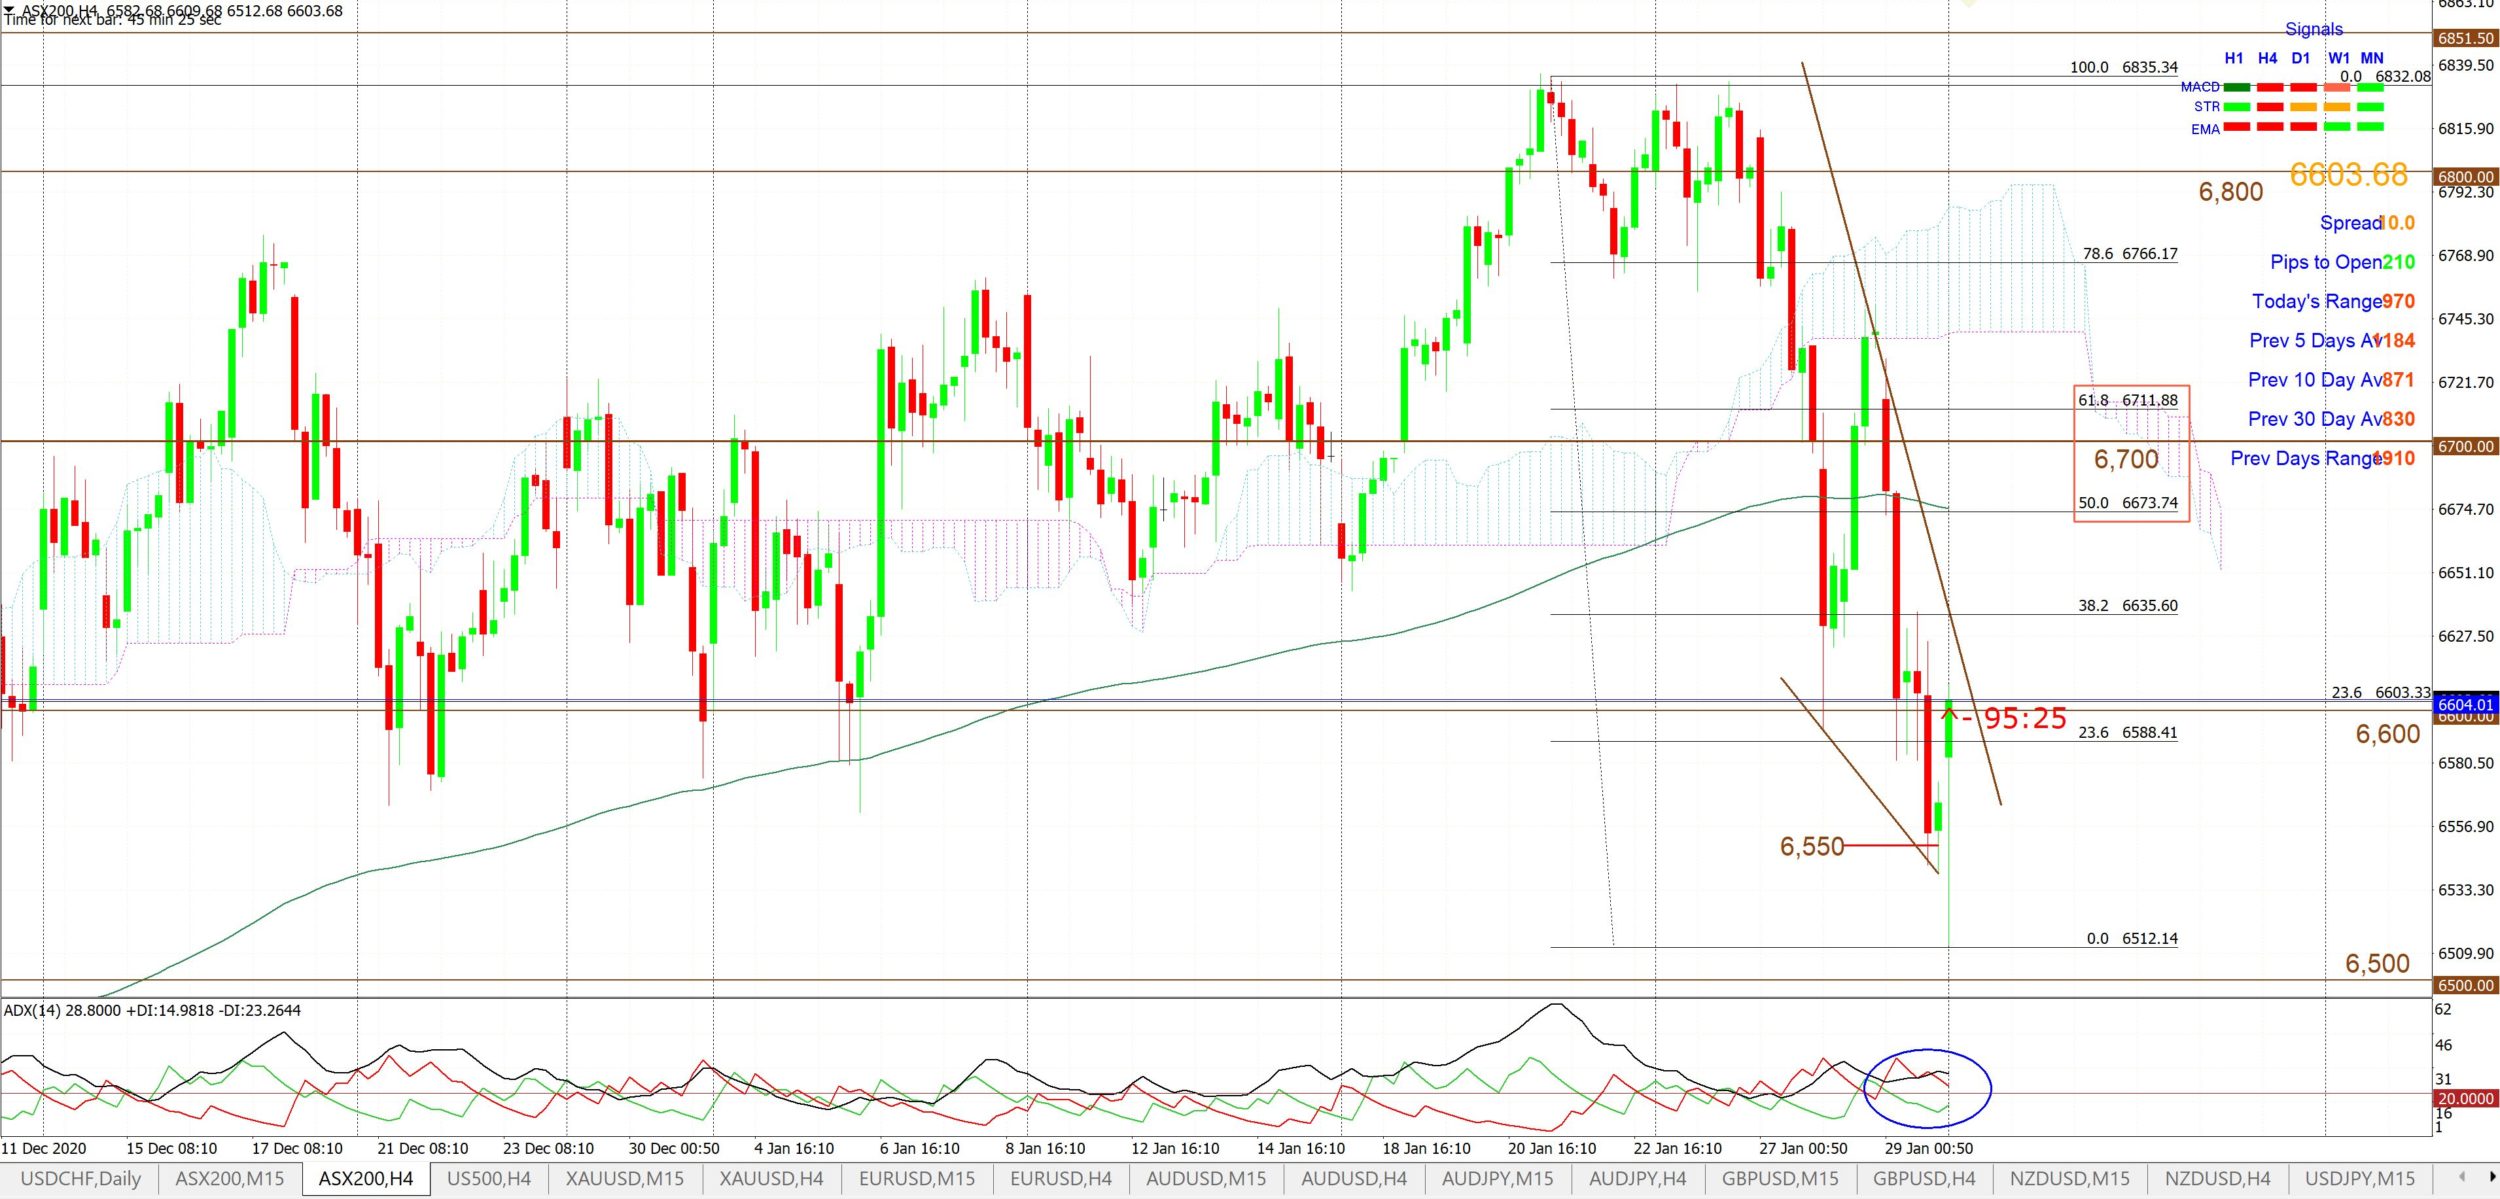
ASX-200 4hr: note the wedge breakout and test of the 61.8% Fibonacci::

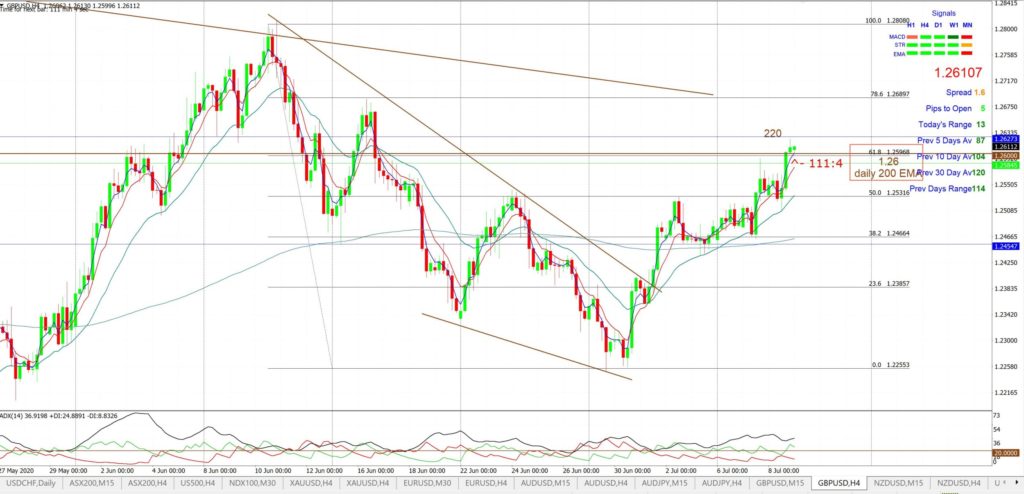
GBP/USD/4hr: June 2020: The GBP/USD gave a great Descending Wedge breakout in late June / July 2020. The target for this move was 1.26 as this was a whole-number and near the 4hr chart’s 61.8% Fibonacci level:
GBP/USD 4hr: Descending Wedge brewing:
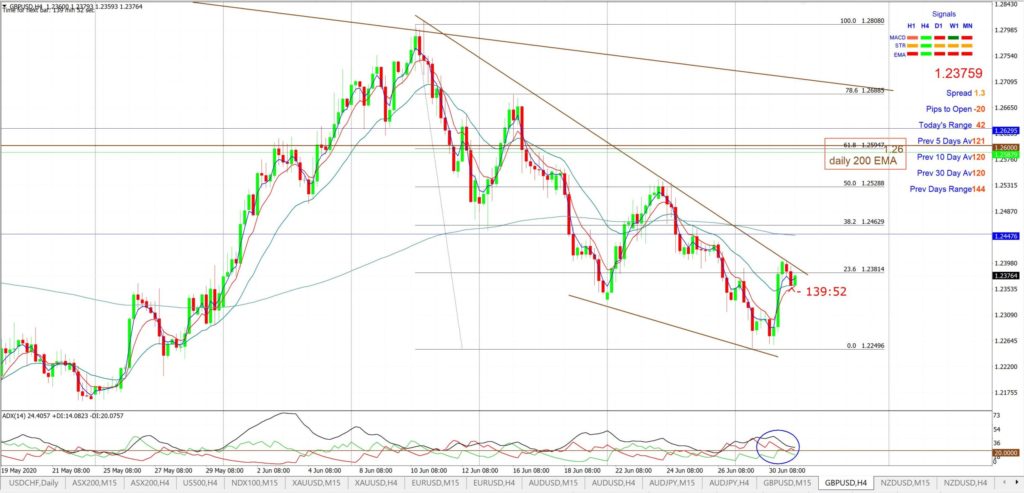
GBP/USD 4hr: Descending Wedge completed for a 220 pip gain:
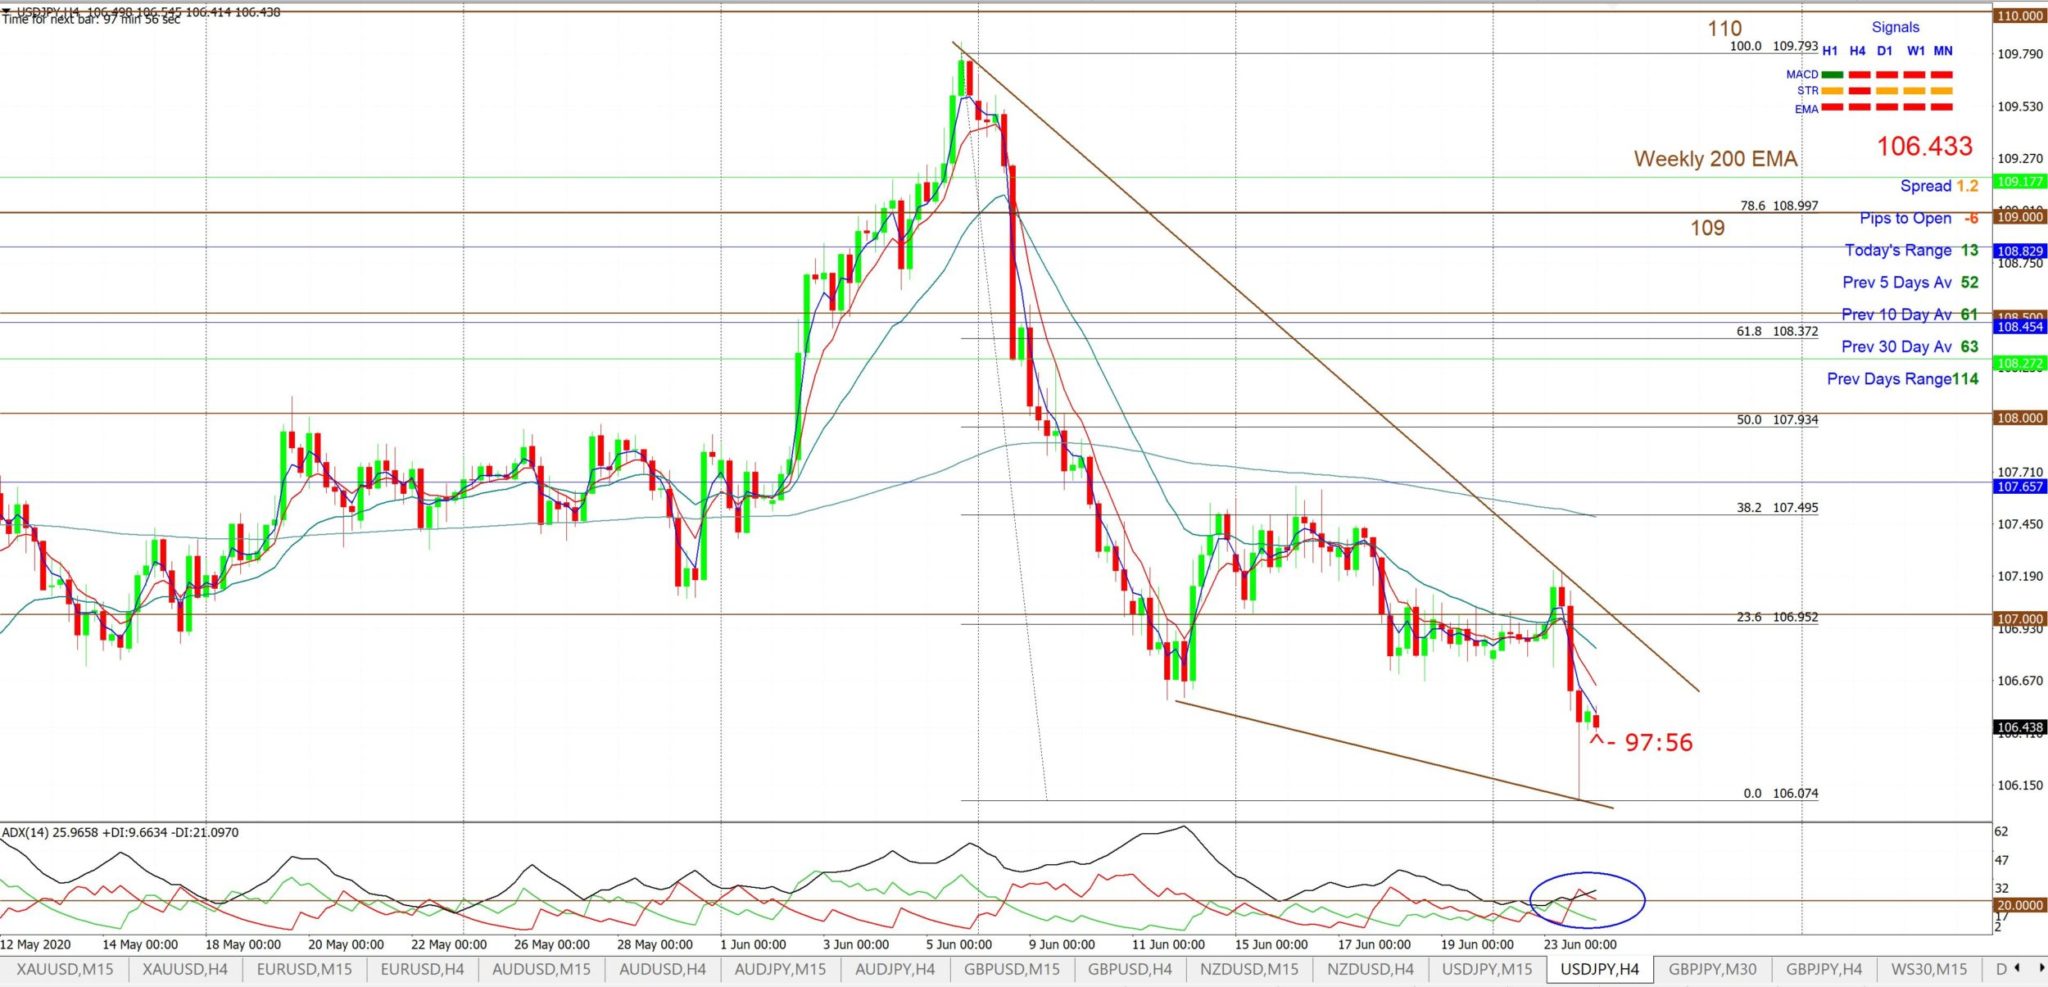
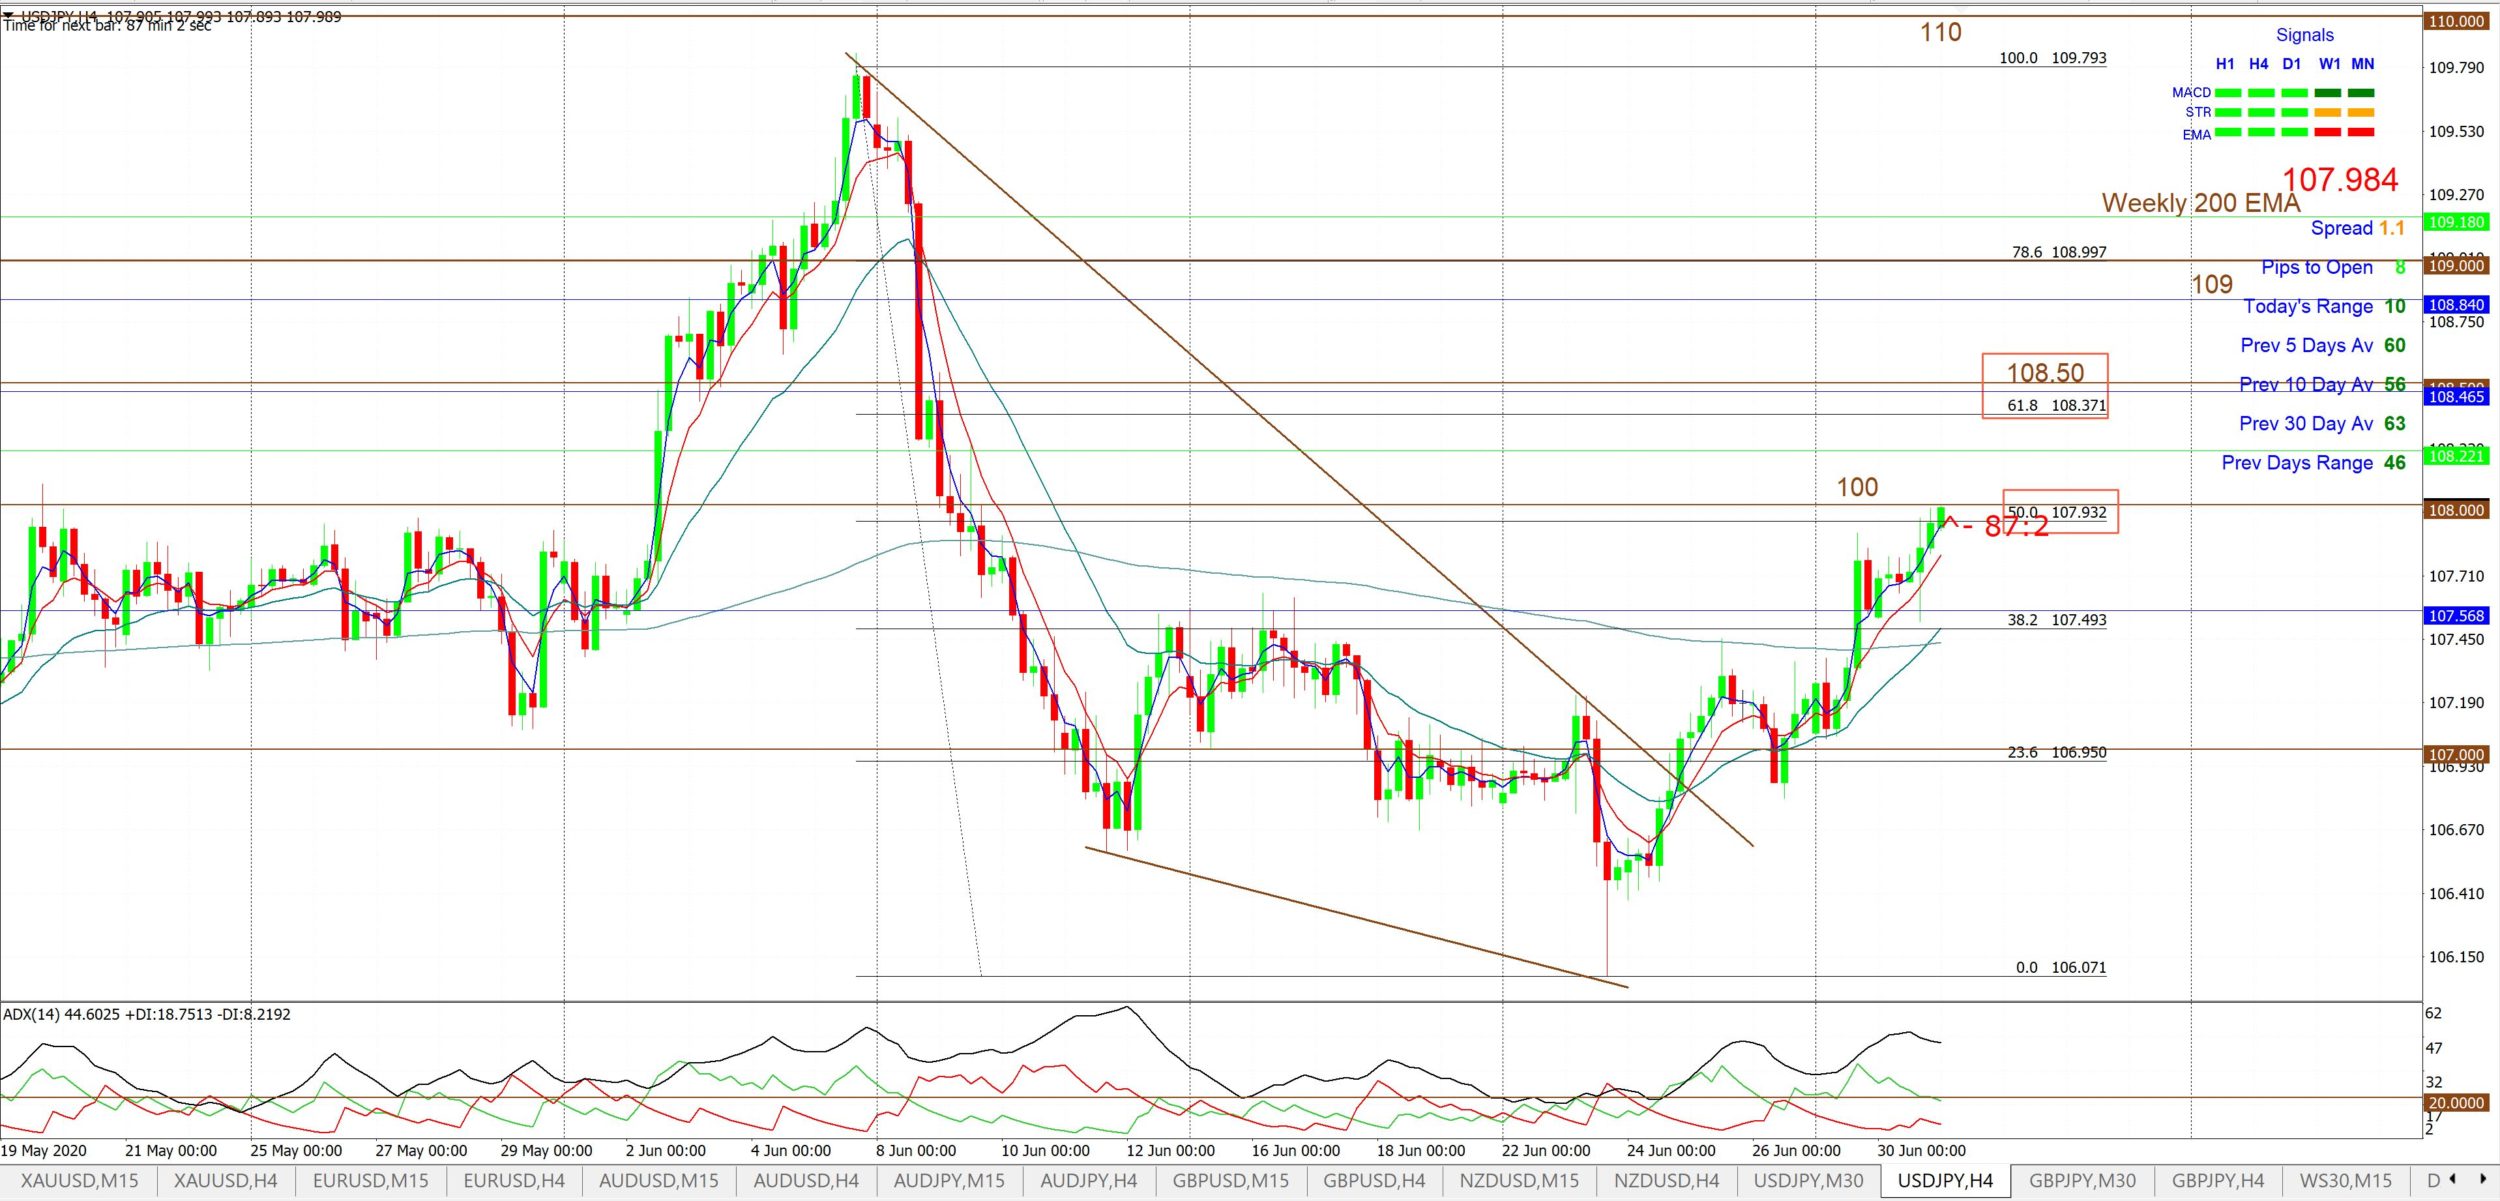
USD/JPY 4hr: June 2020: The USD/JPY gave a great Descending Wedge breakout in June 2020:
USD/JPY 4hr: Descending Wedge brewing:
USD/JPY 4hr: The Descending Wedge delivers around 100 pips:
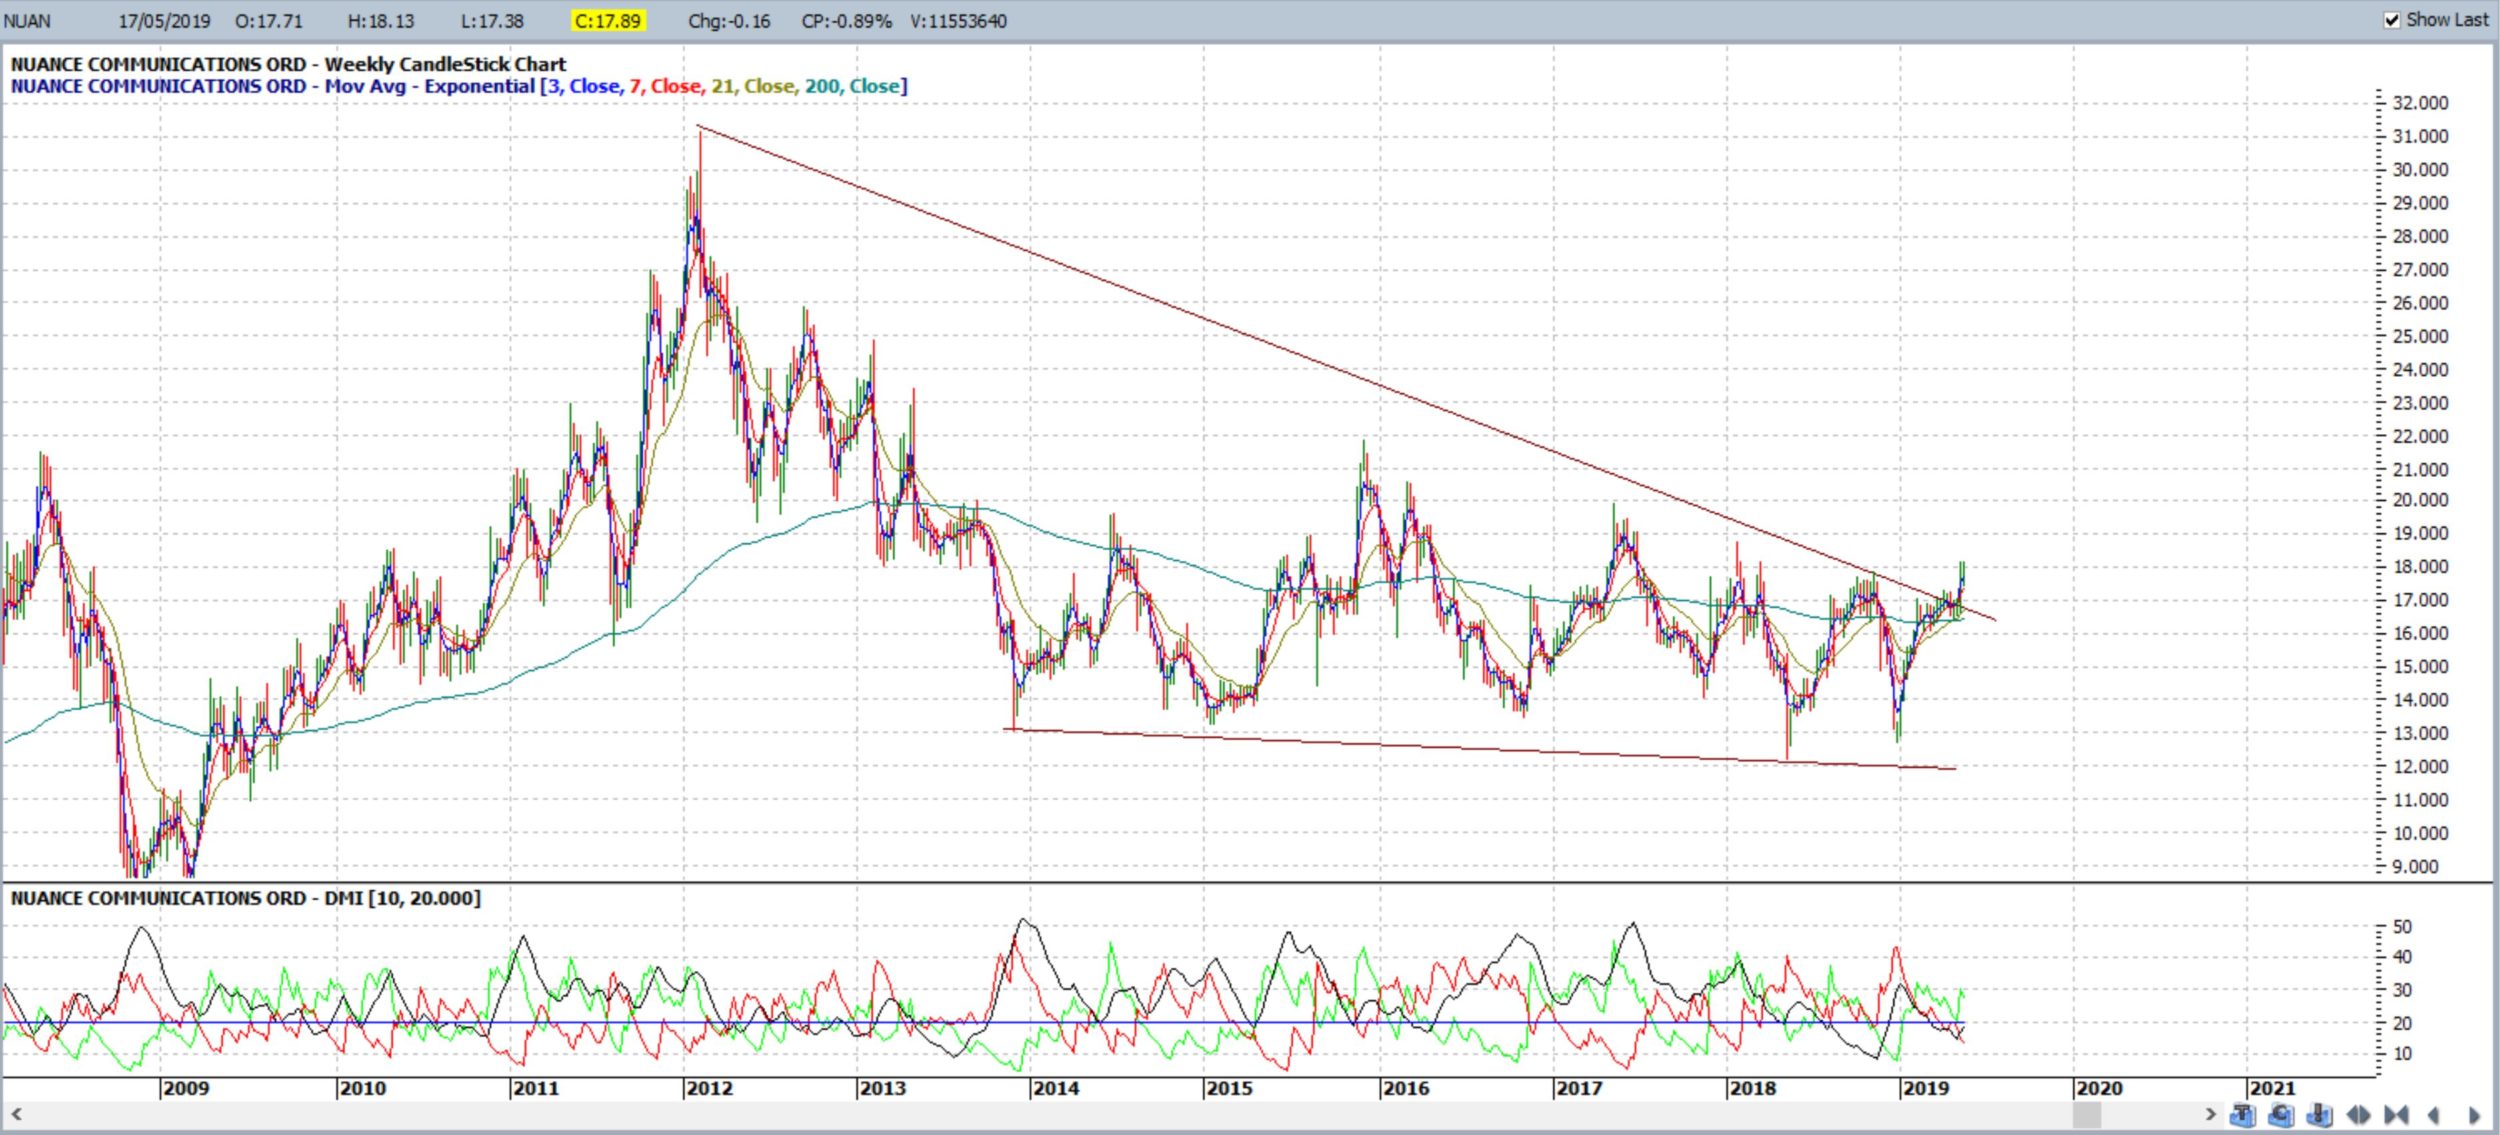
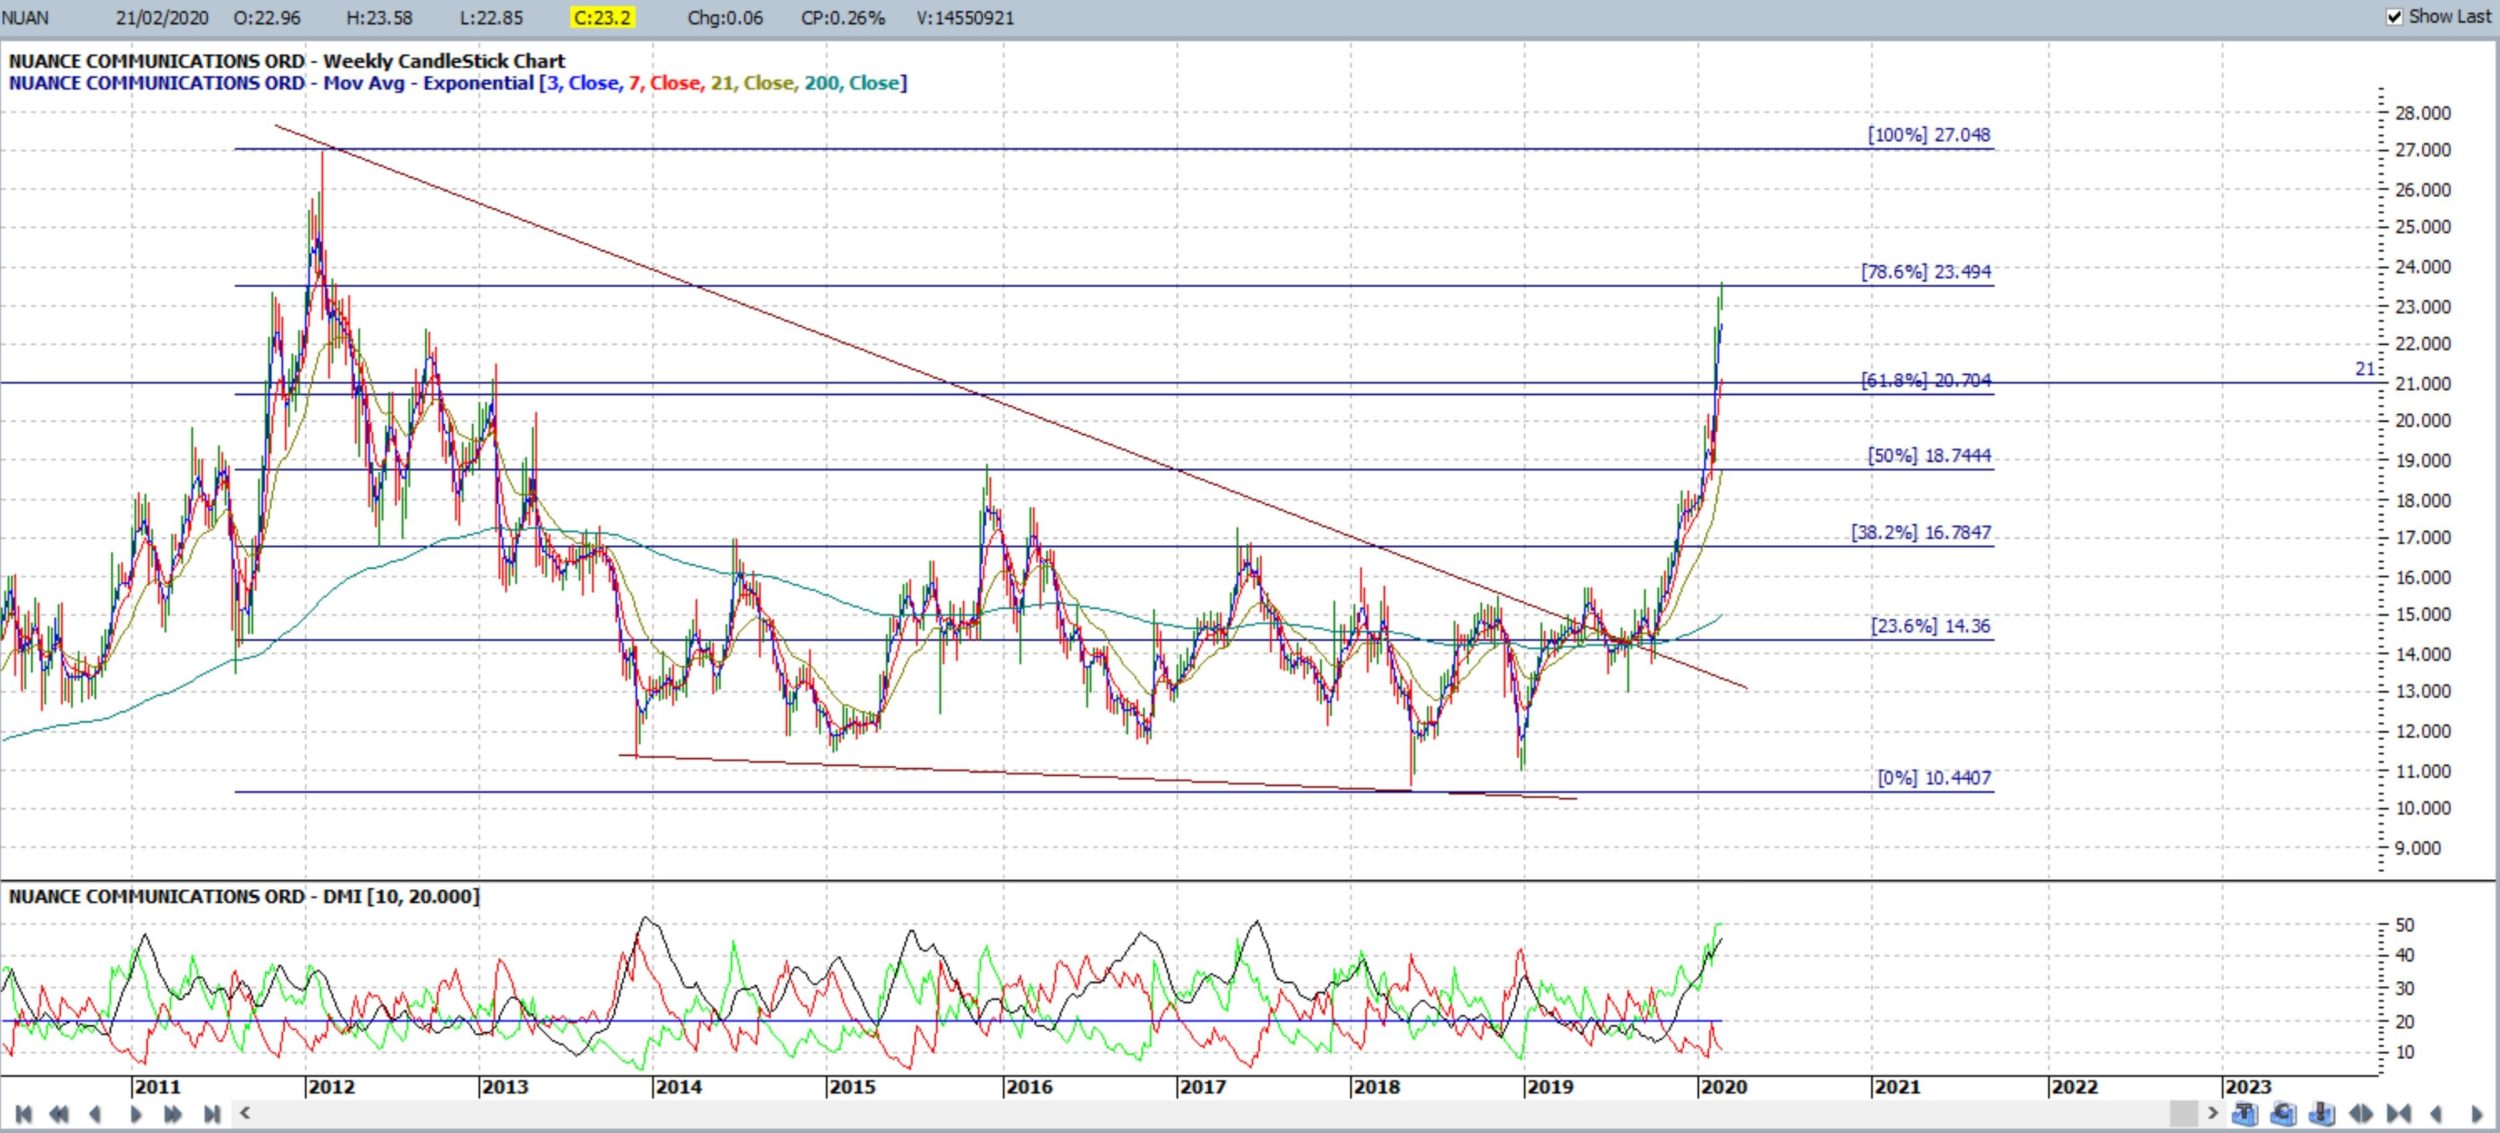
NUAN weekly February 2019 / 2020: this wedge breakout failed at first but then got going:
NUAN weekly: Descending Wedge breakout:
NUAN weekly: Descending Wedge breakout completed:
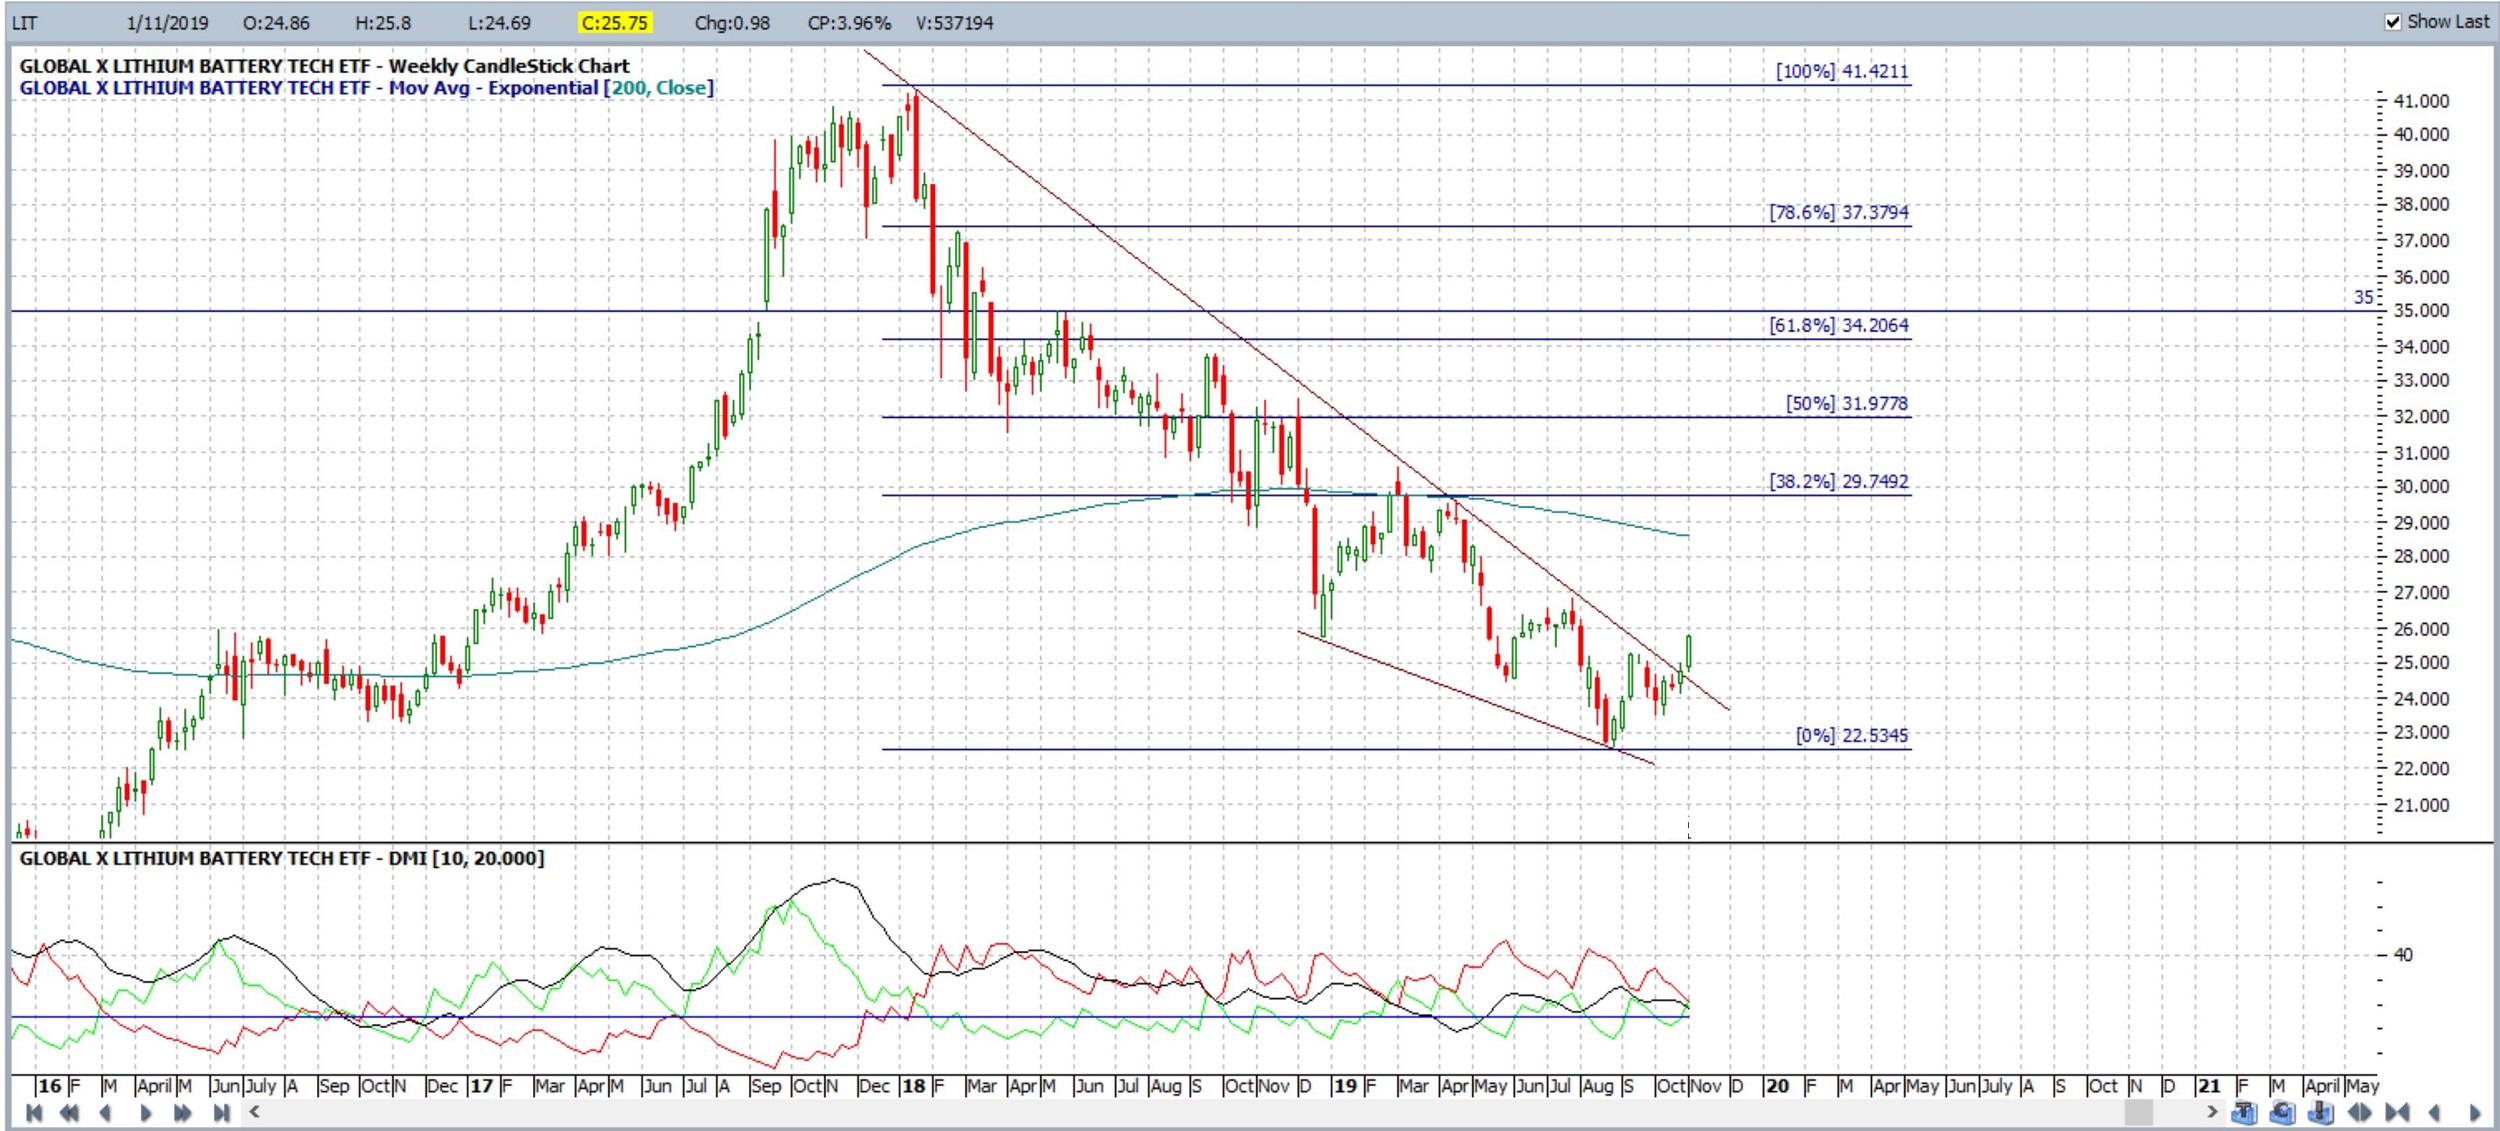
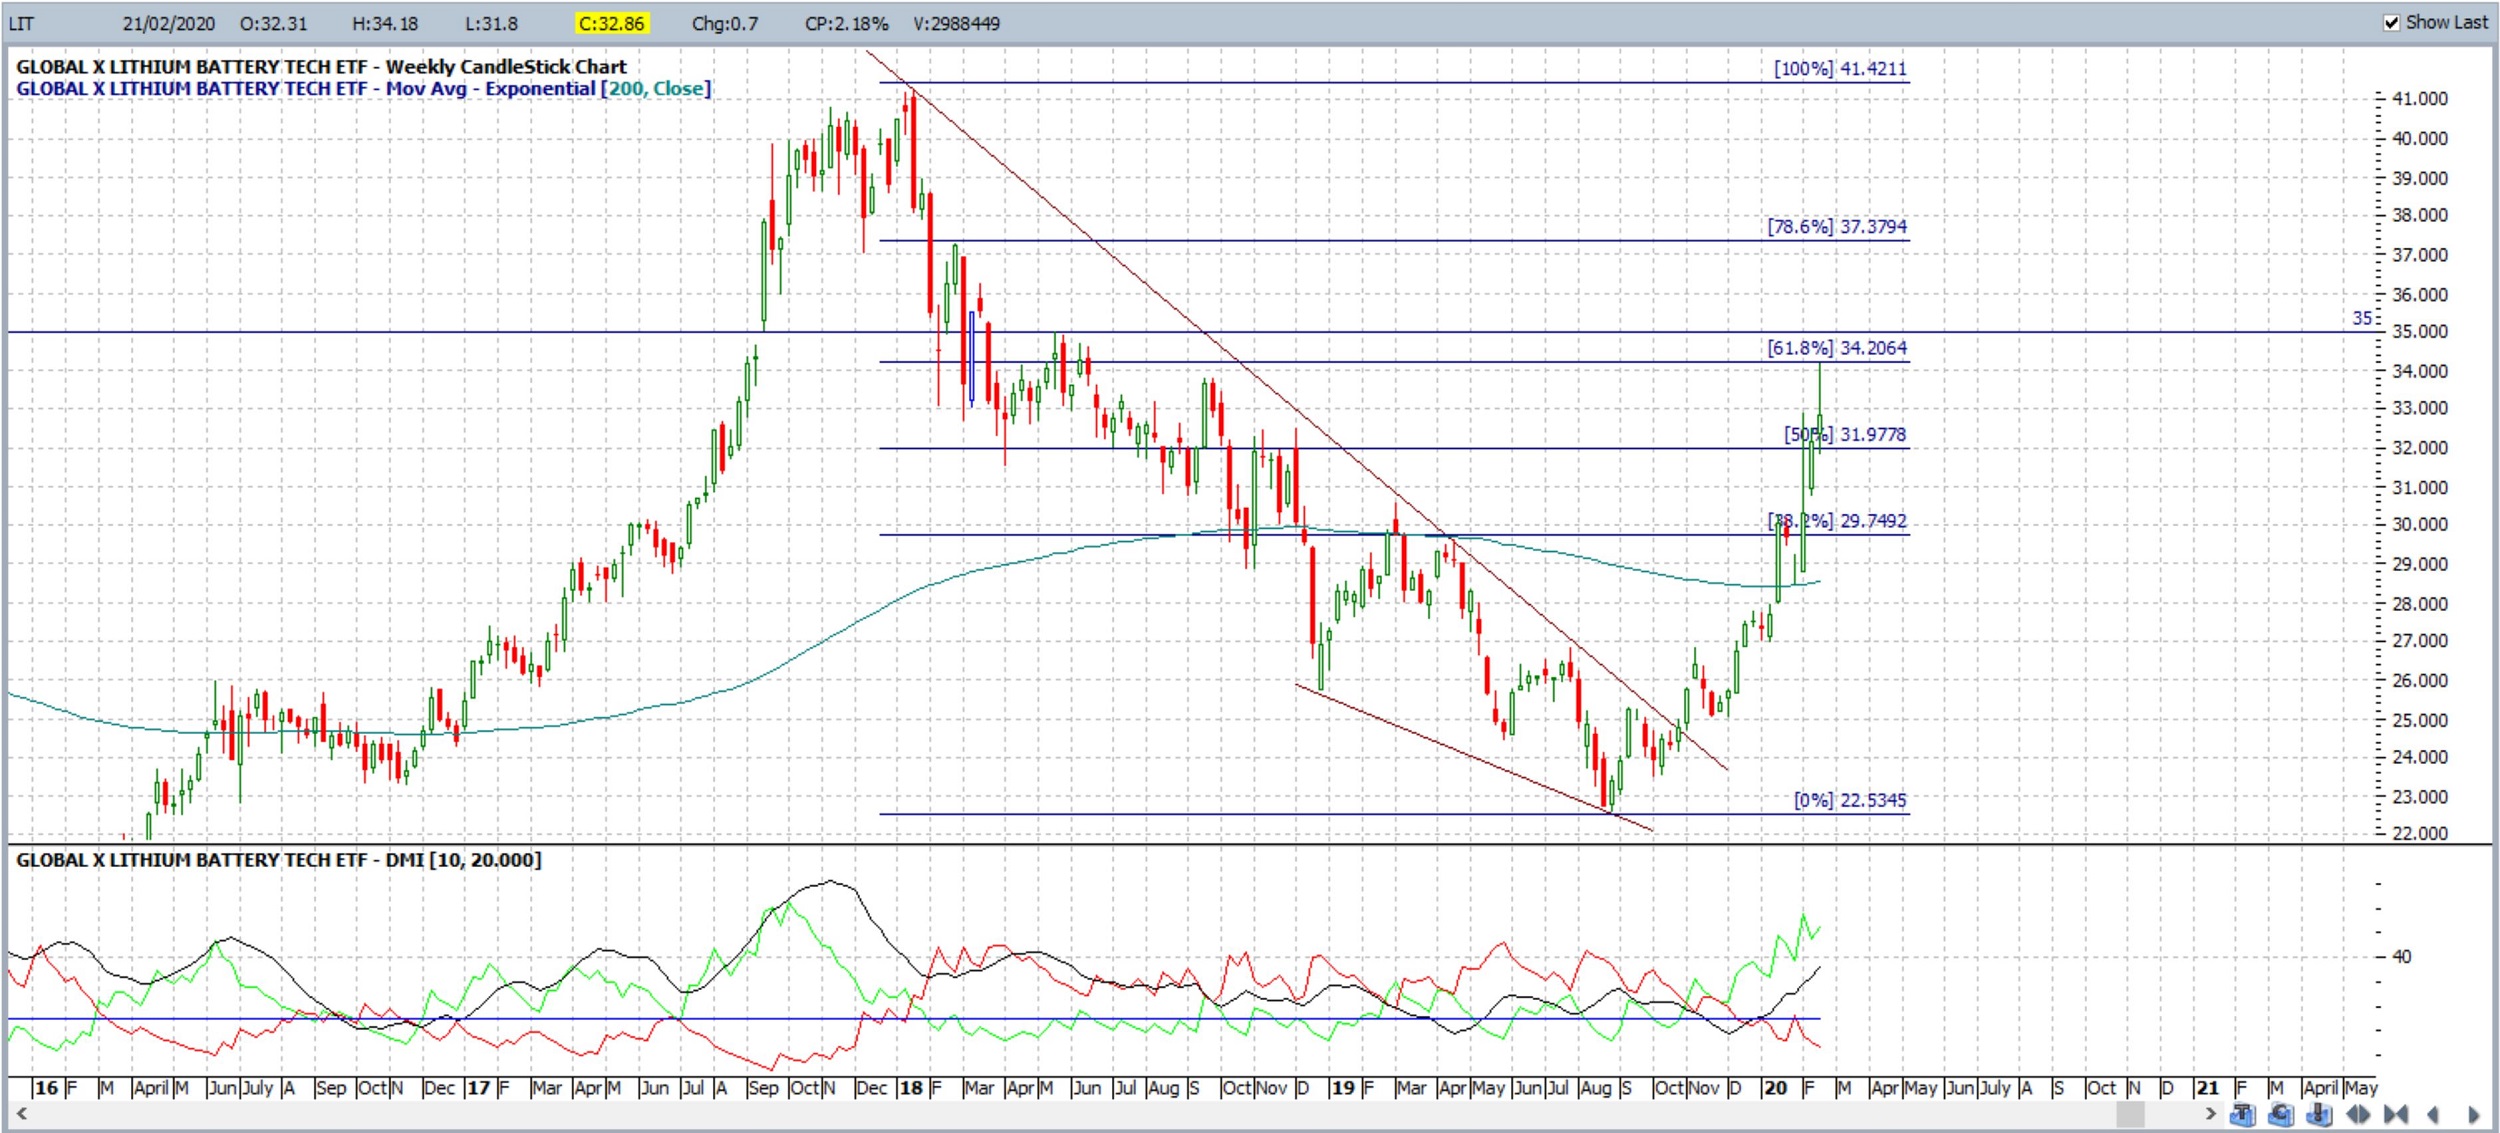
LIT weekly: February 2020: What a classic descending wedge breakout this was! It took a few months but the 61.8% fib target has finally been reached!
LIT weekly: descending wedge b/o from Nov 2019:
LIT weekly: descending wedge target reached Feb 2020:
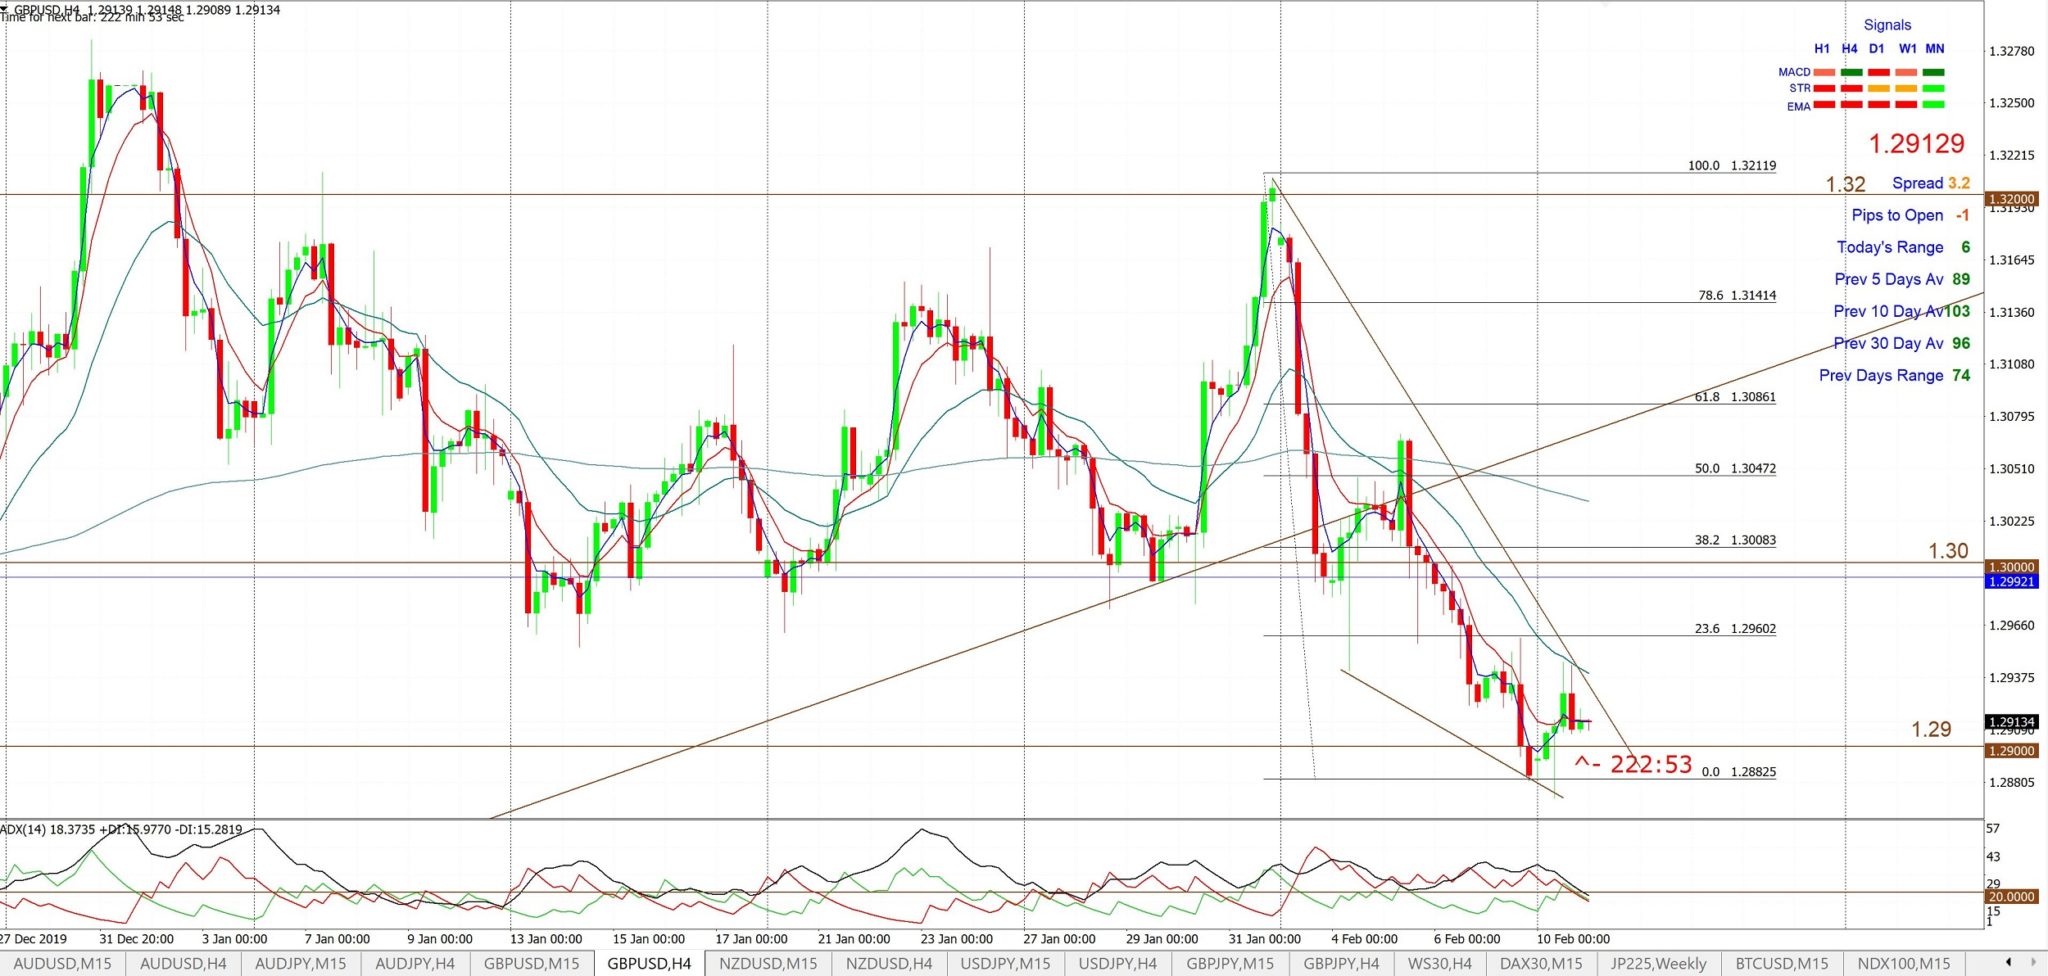
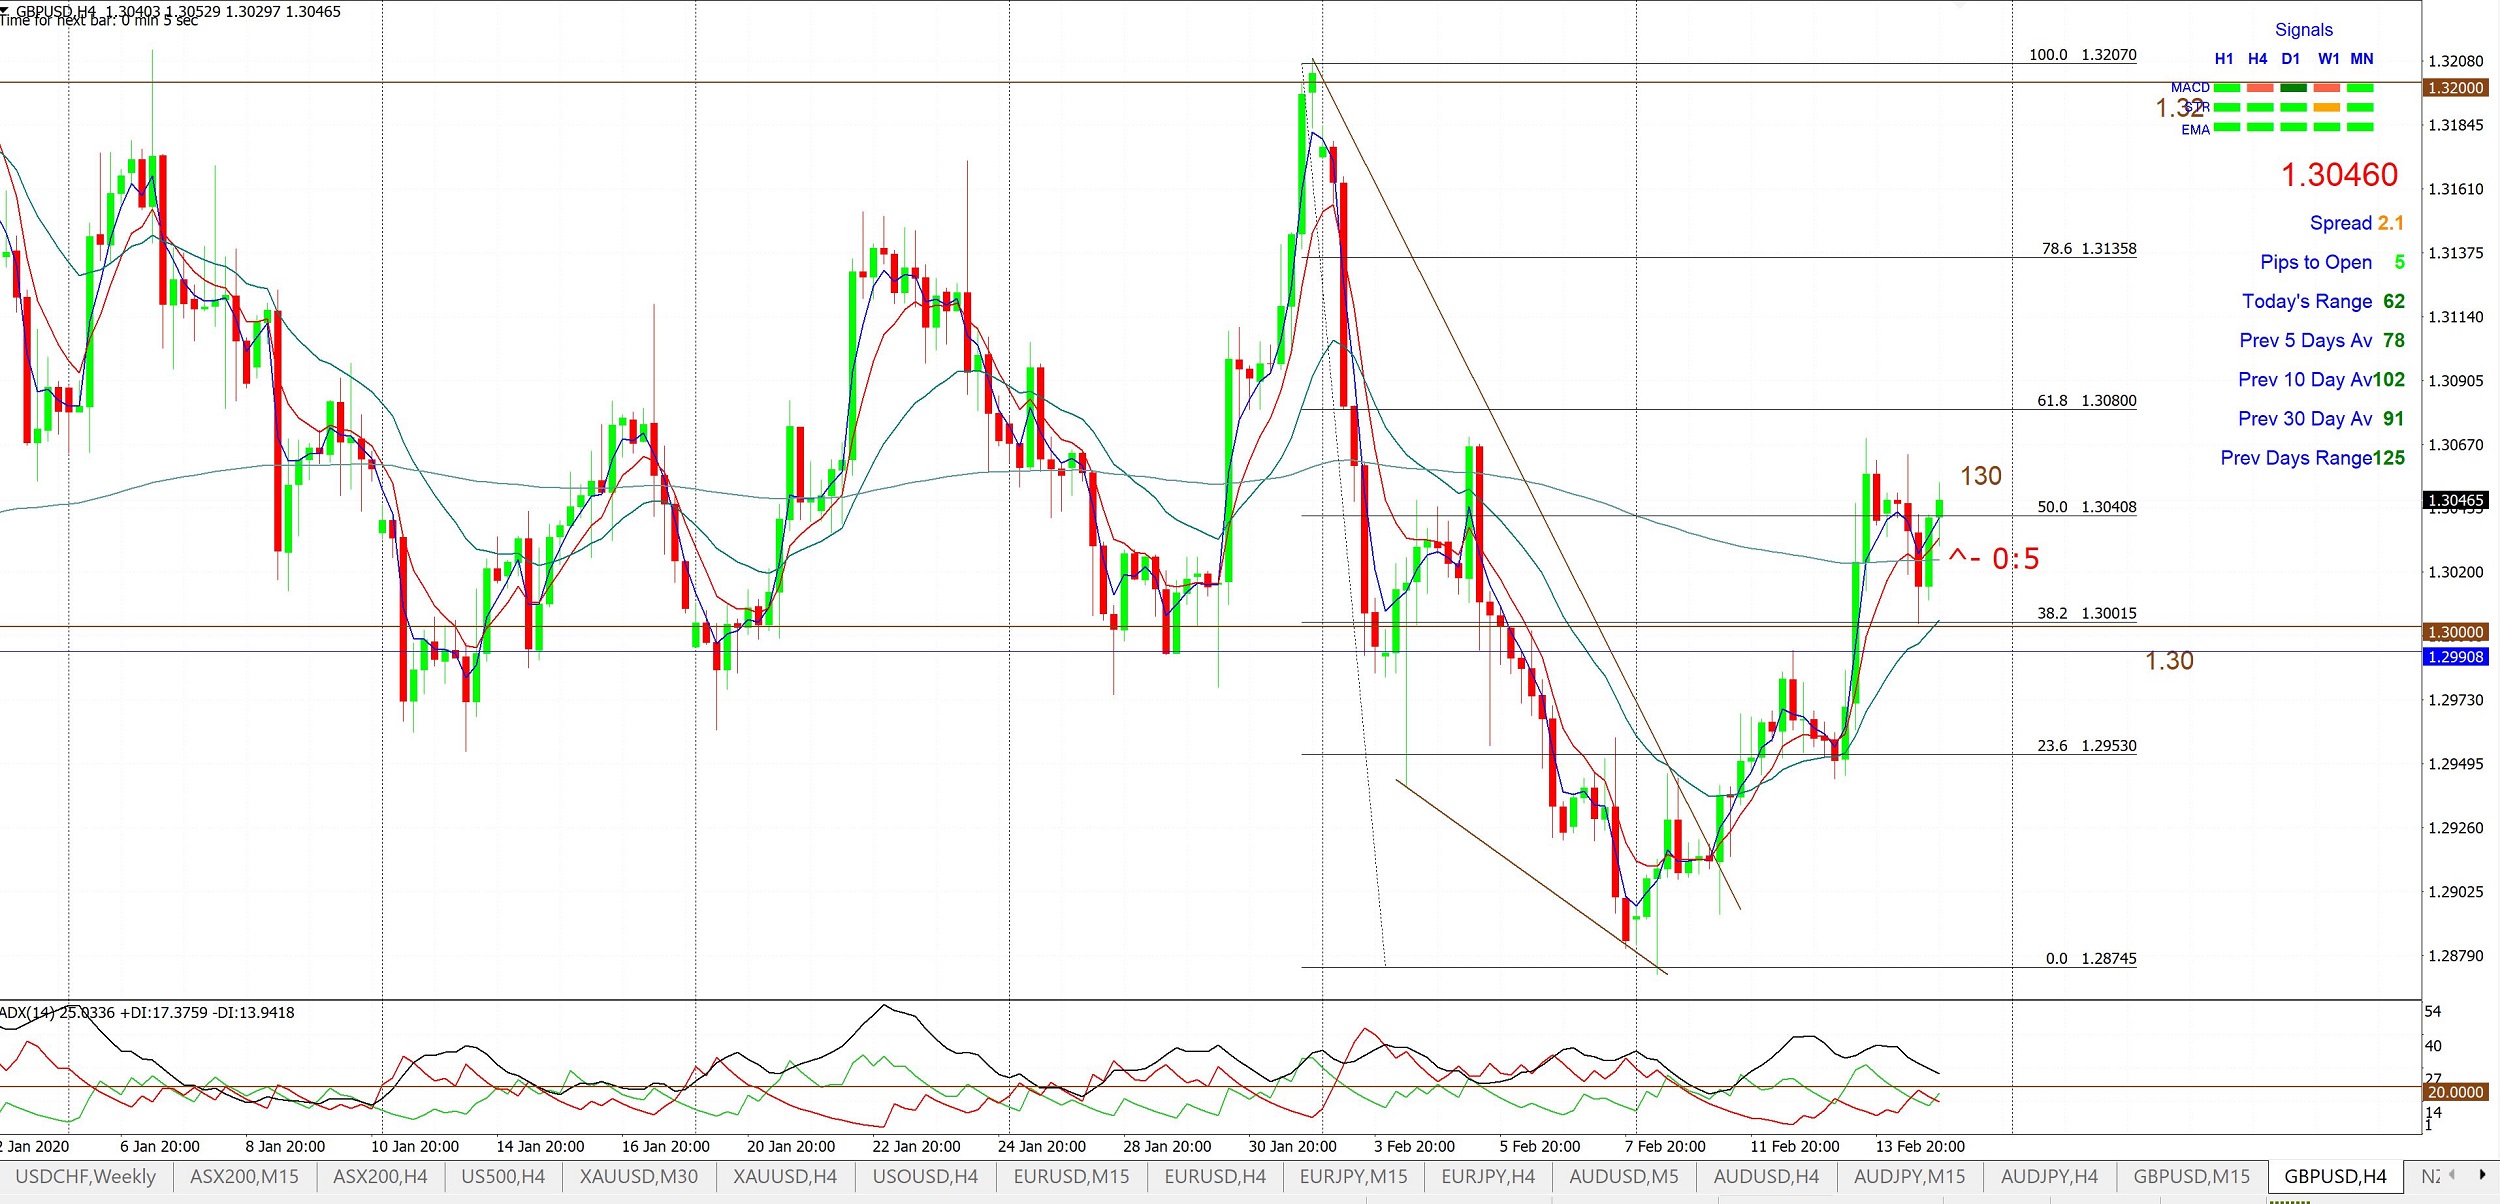
GBP/USD 4hr: February 2020: One of the best trades of the second week of February was this descending wedge b/o on the Cable for 130 pips. Note how price action paused just under the 61.8% fib!
GBP/USD 4hr: chart from my Tuesday 11th update:
GBP/USD 4hr: a 130 pip b/o and note how the ADX was a great clue here!
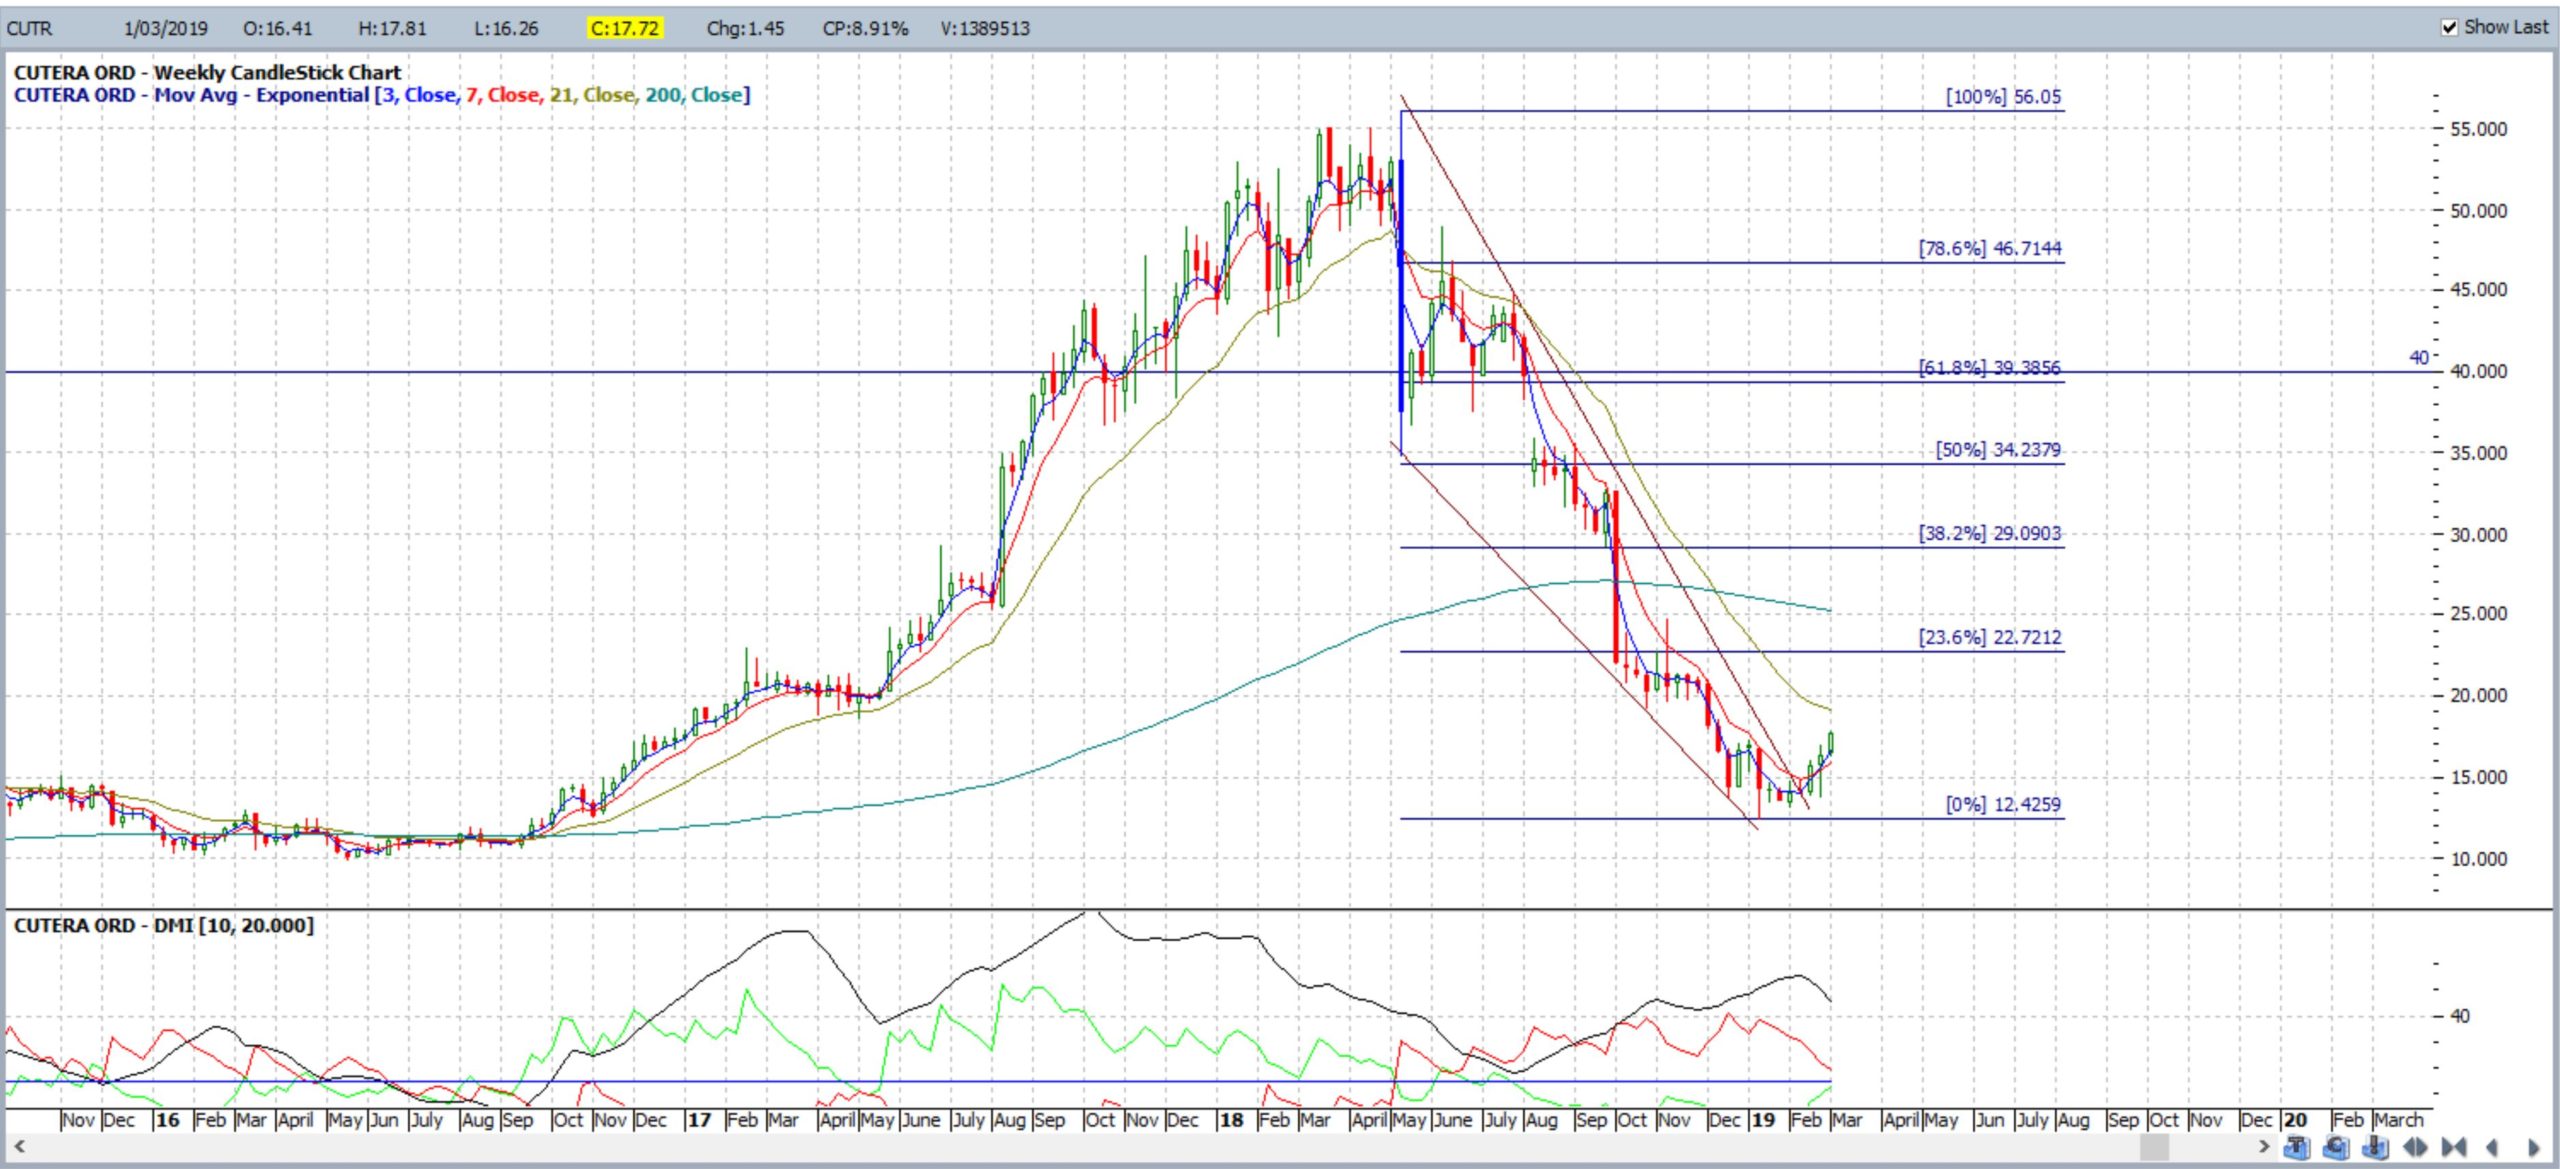
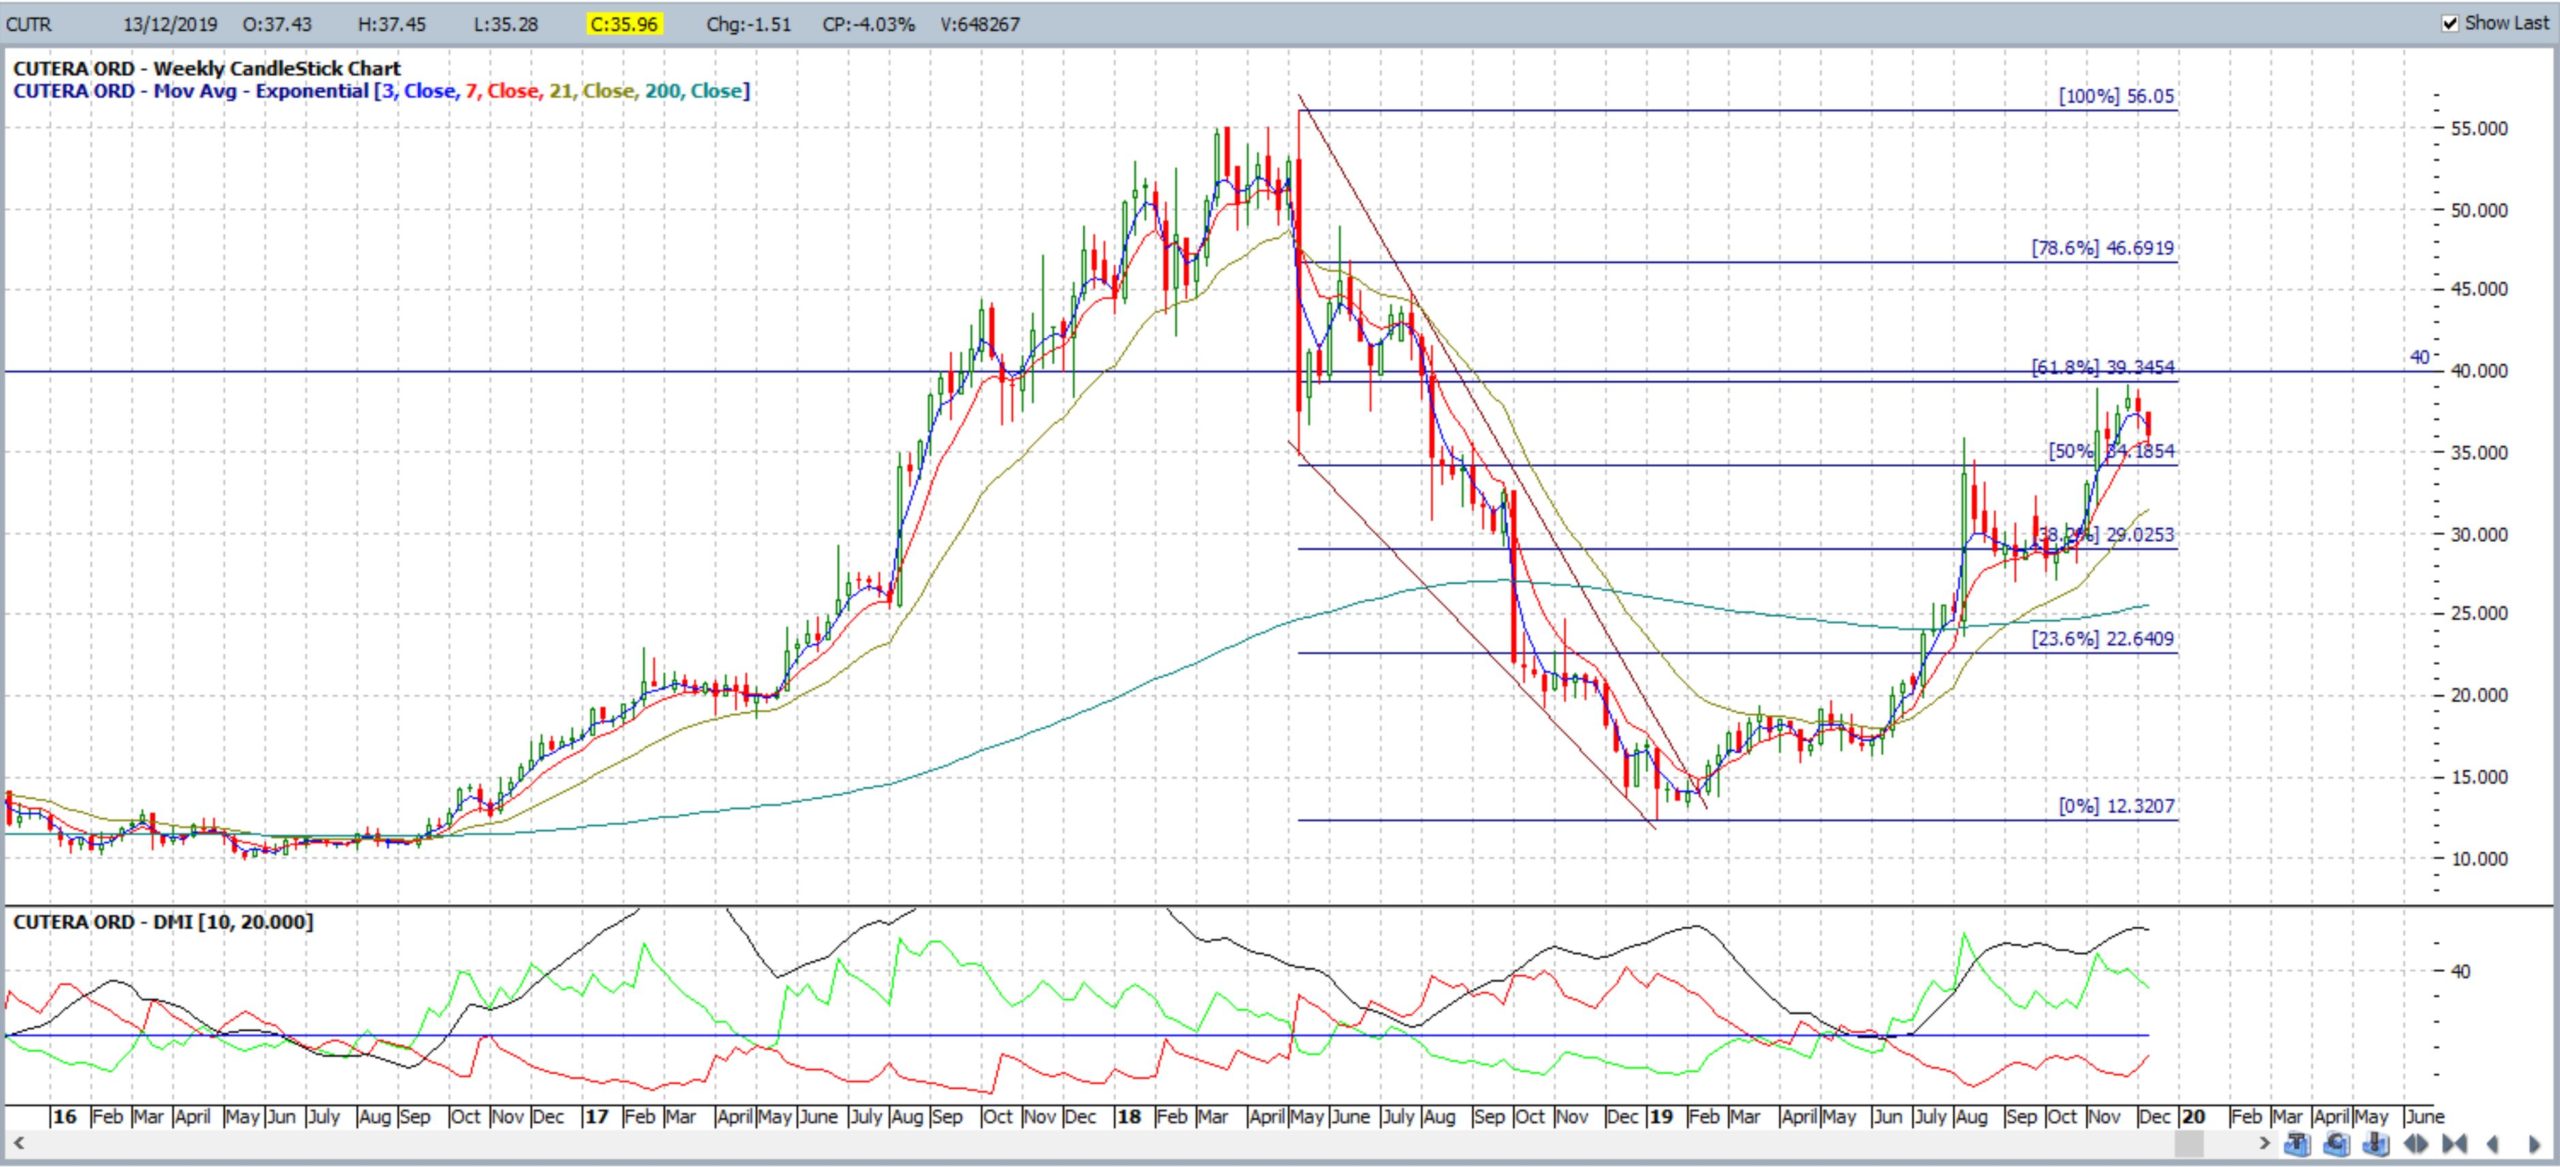
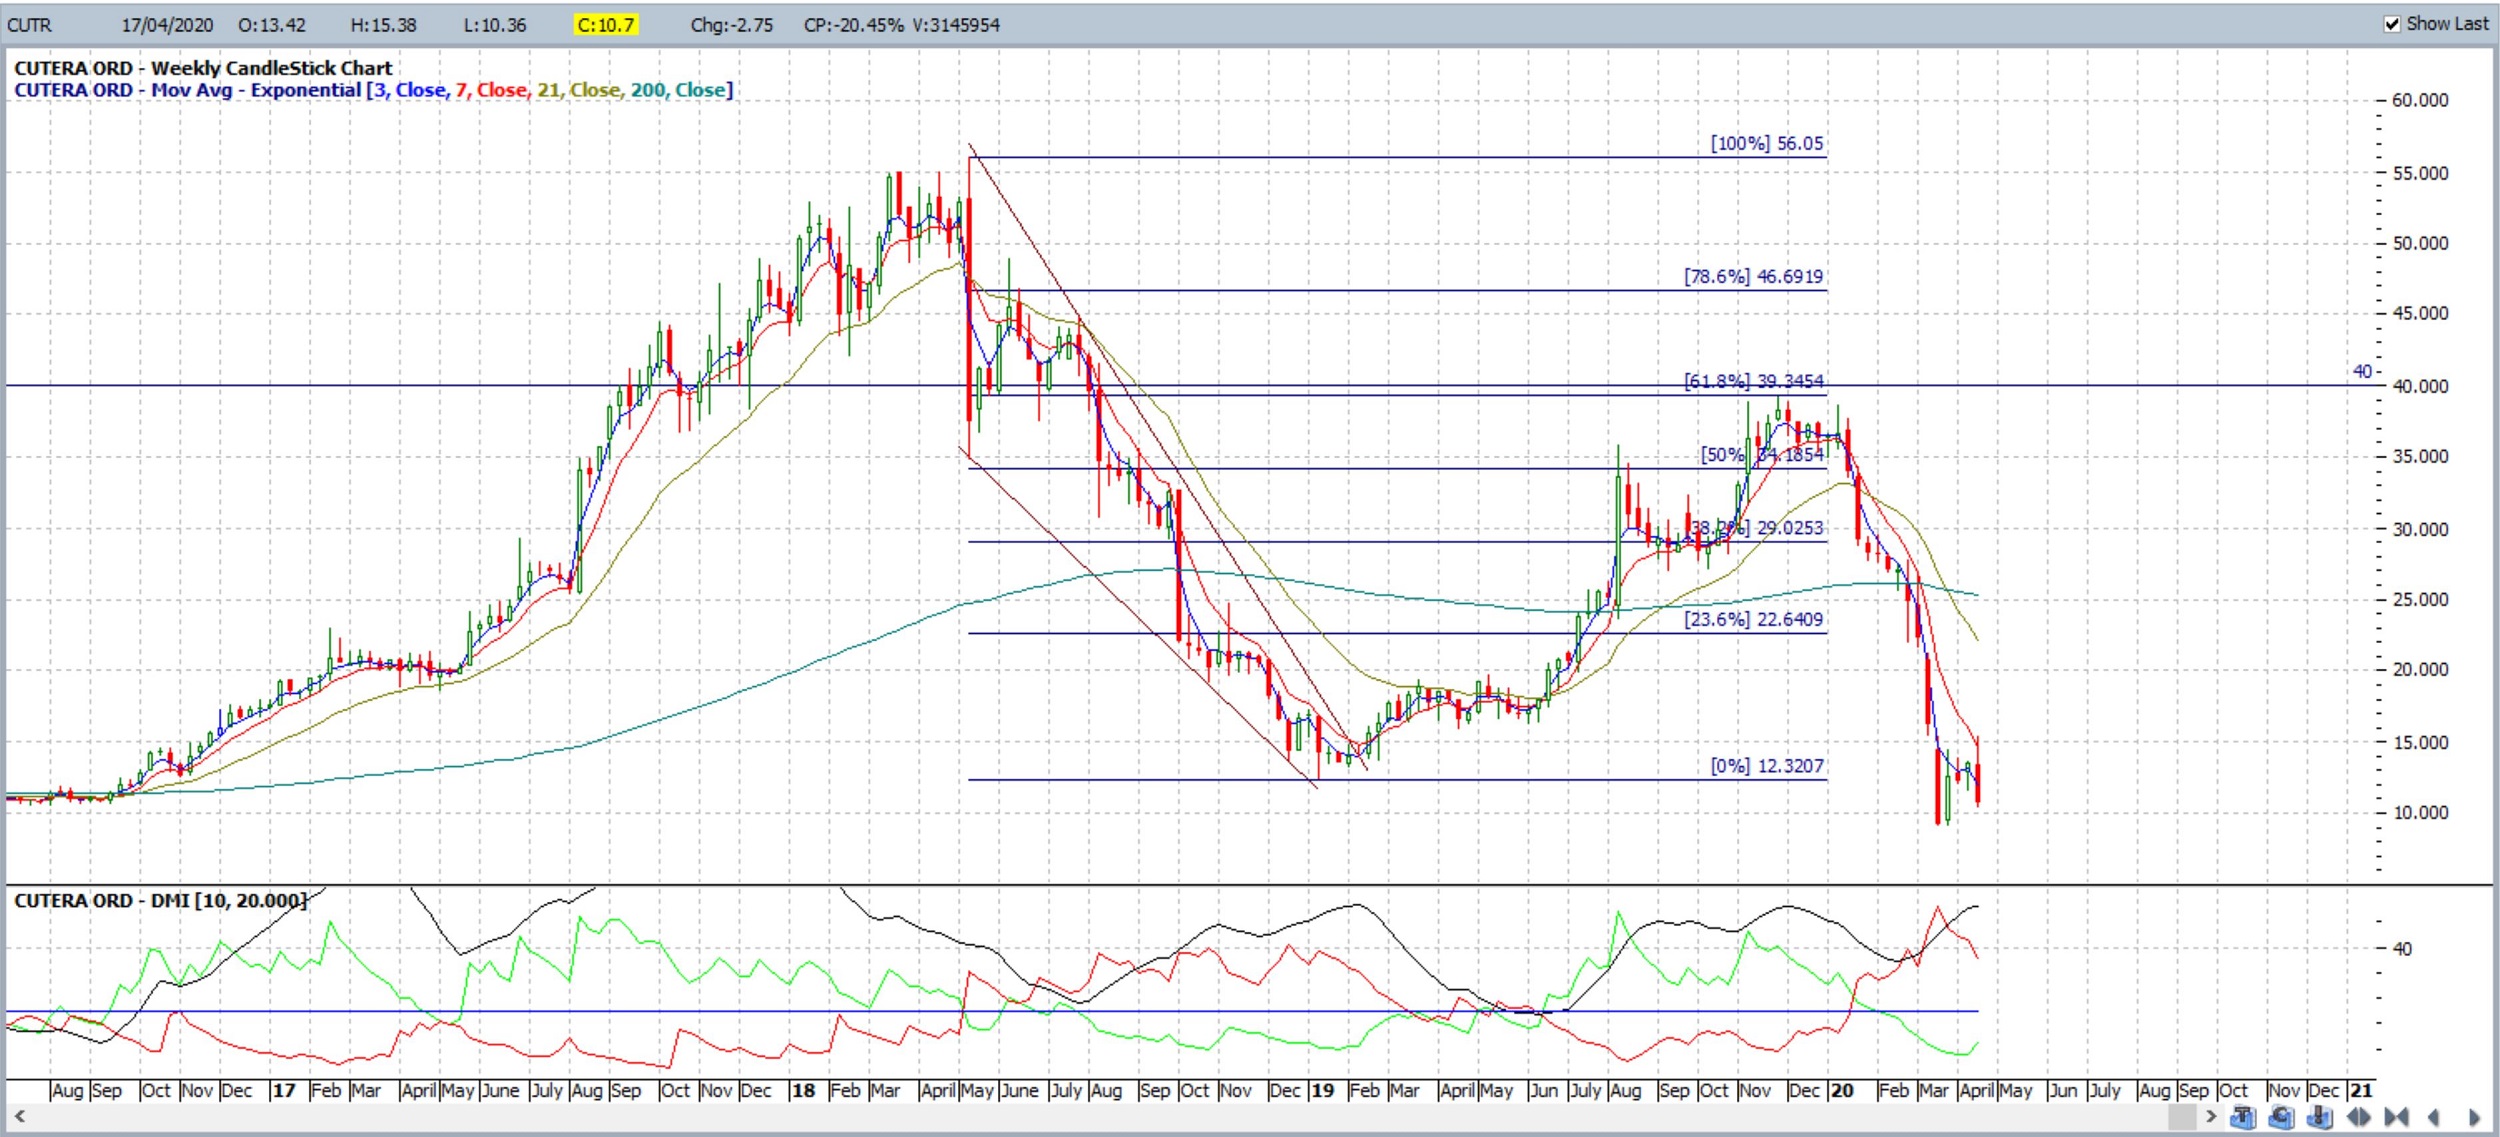
CUTR weekly: note how price action paused at the 61.8% fib after this bullish breakout from a descending wedge. Price then pulled back sharply with Covid-19:
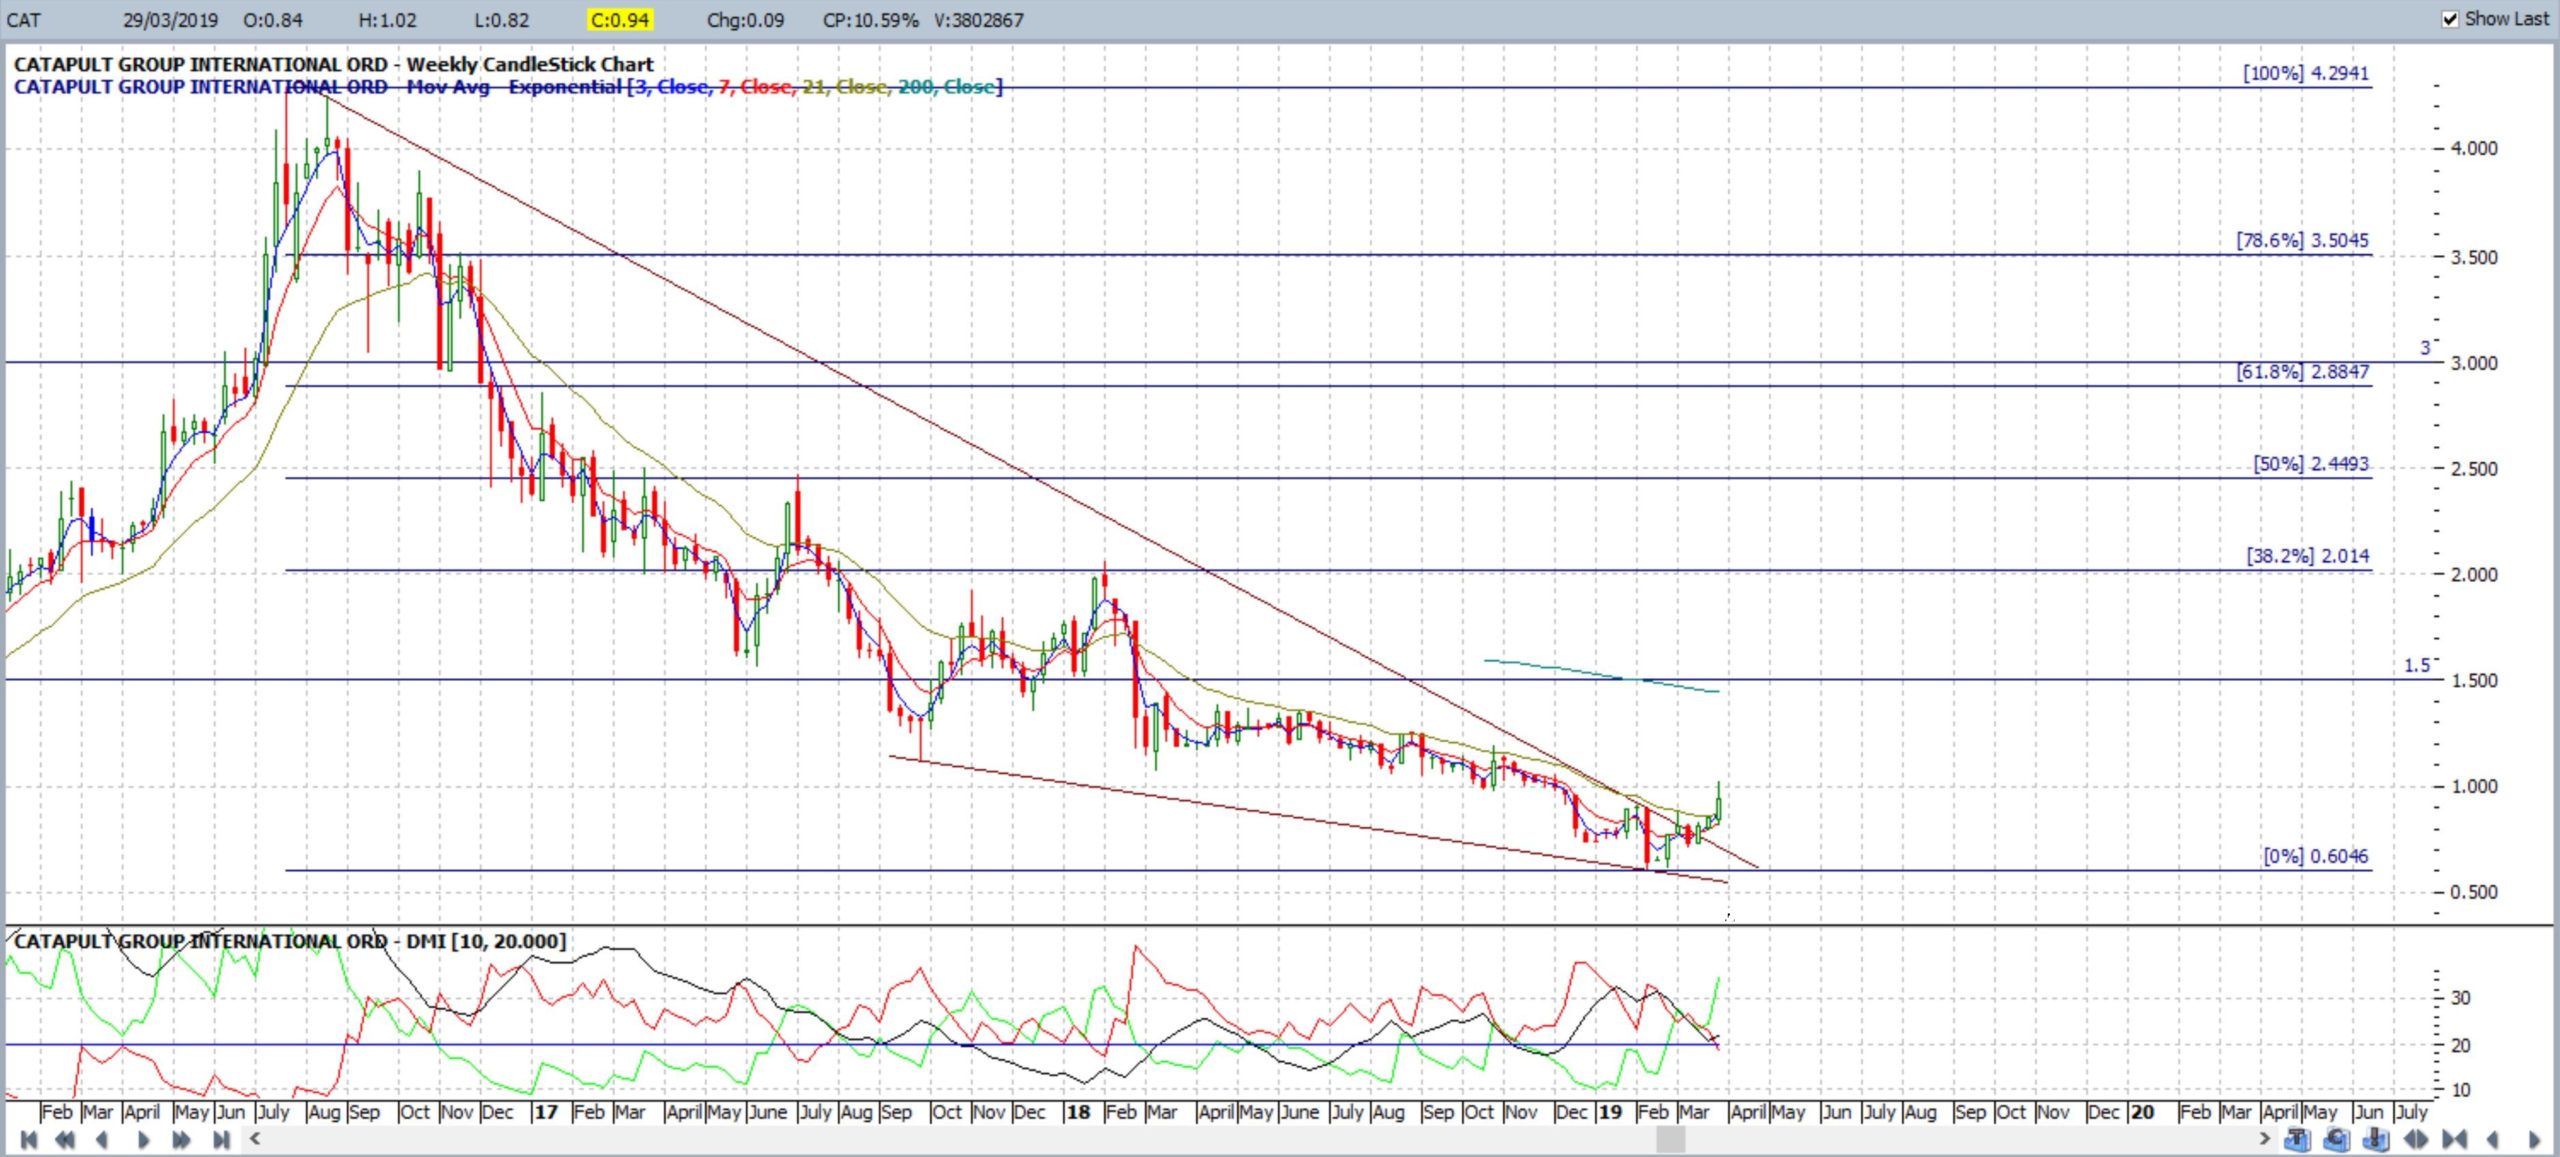
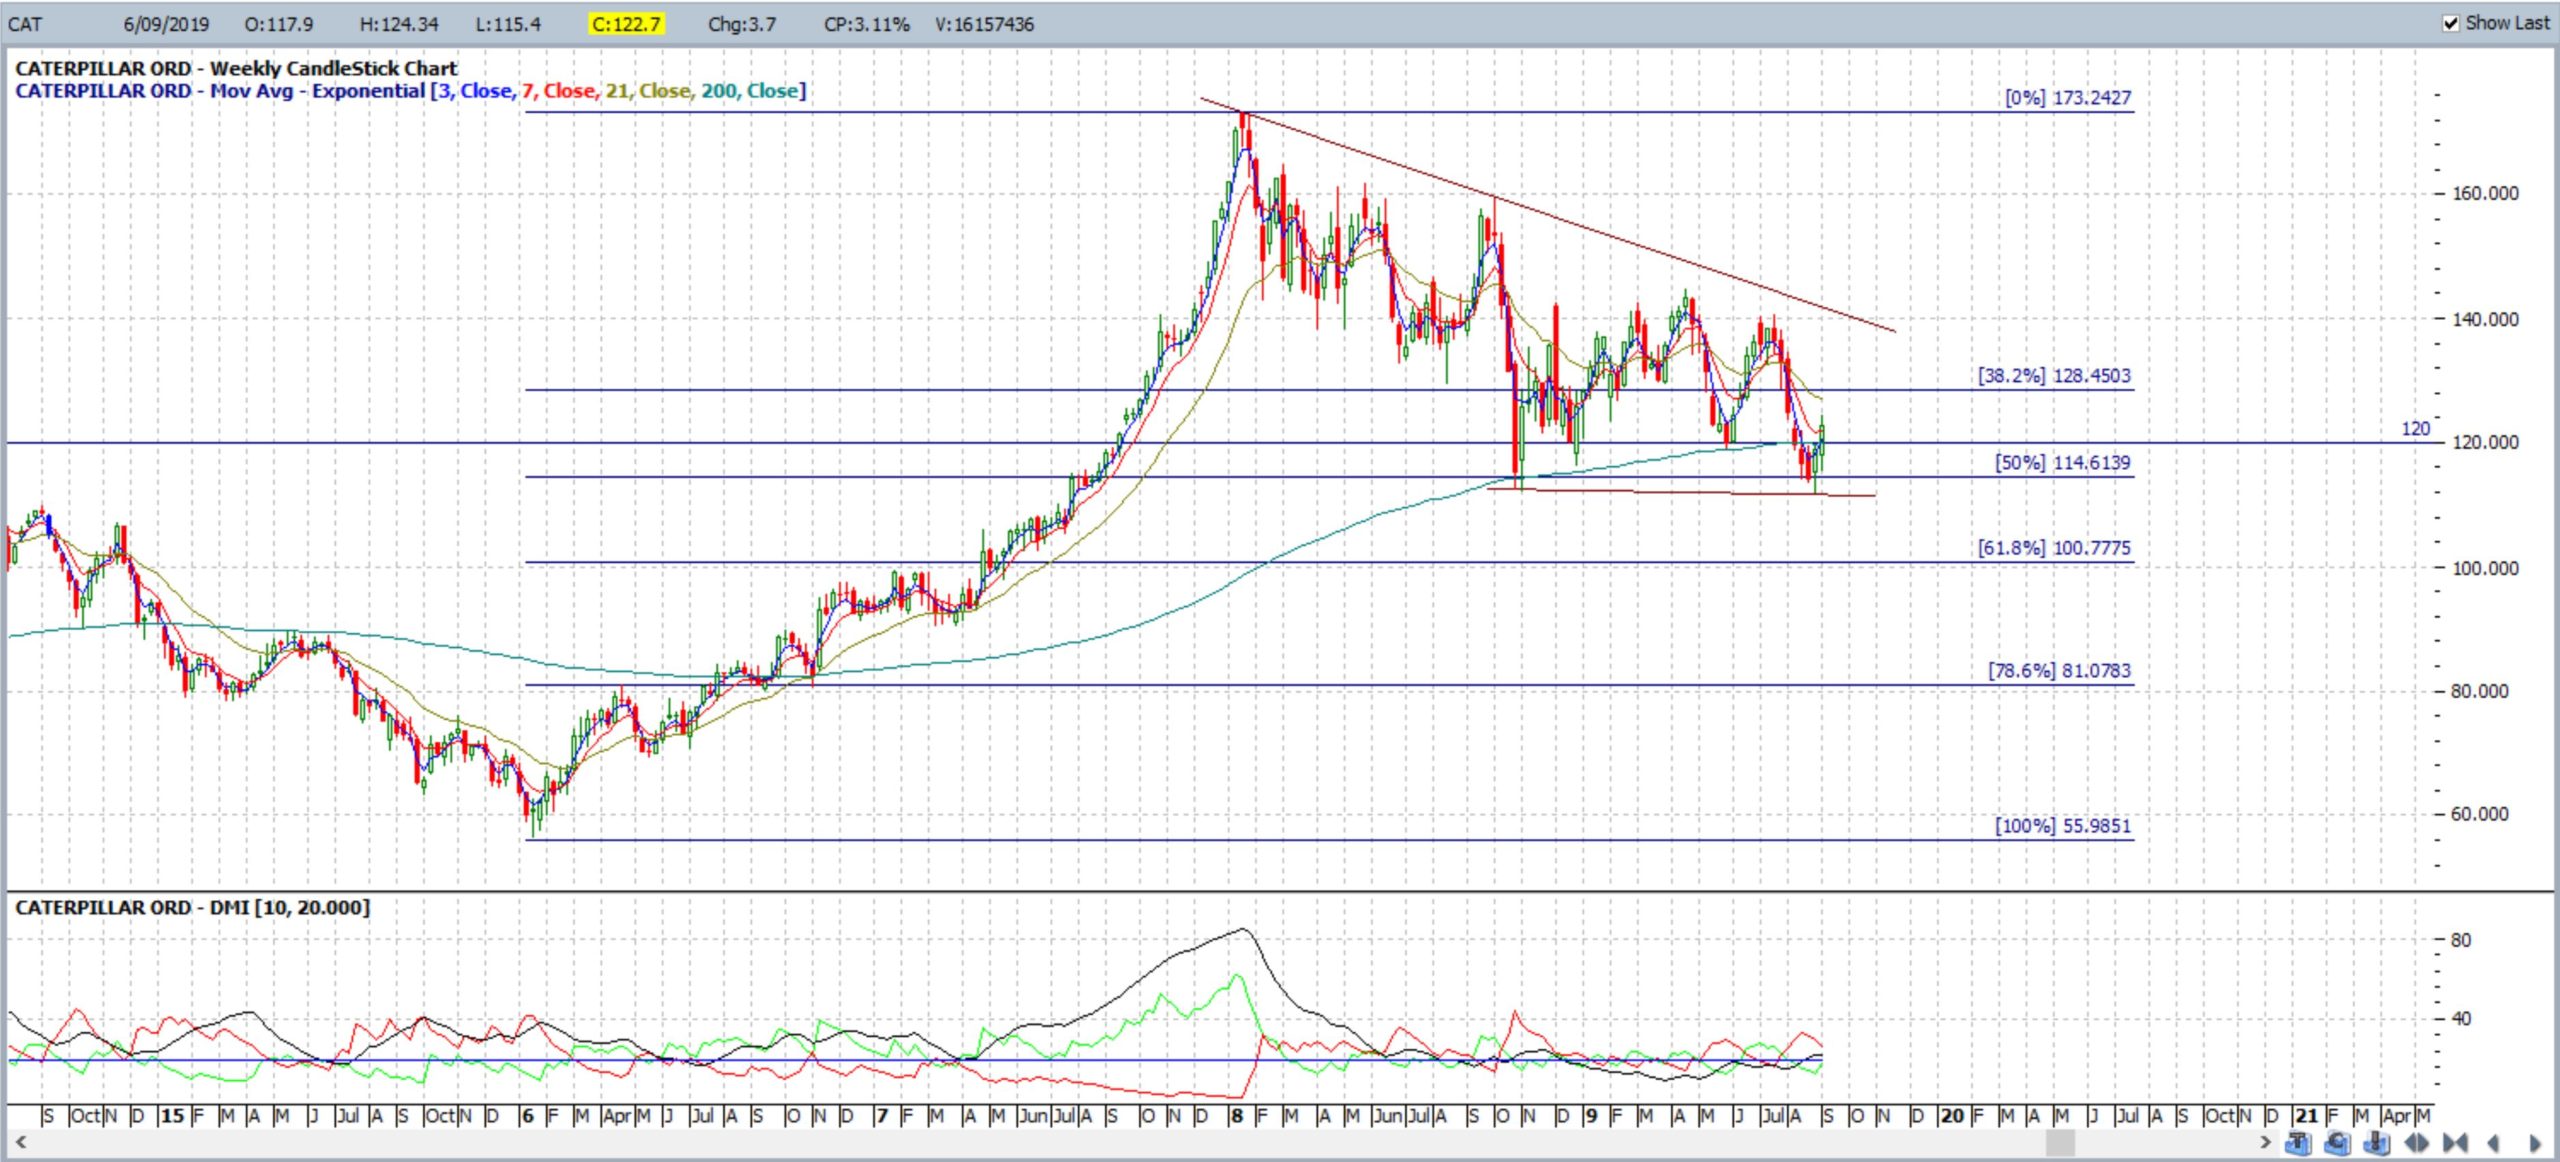
CAT.ASX weekly: this has been a classic style wedge breakout:
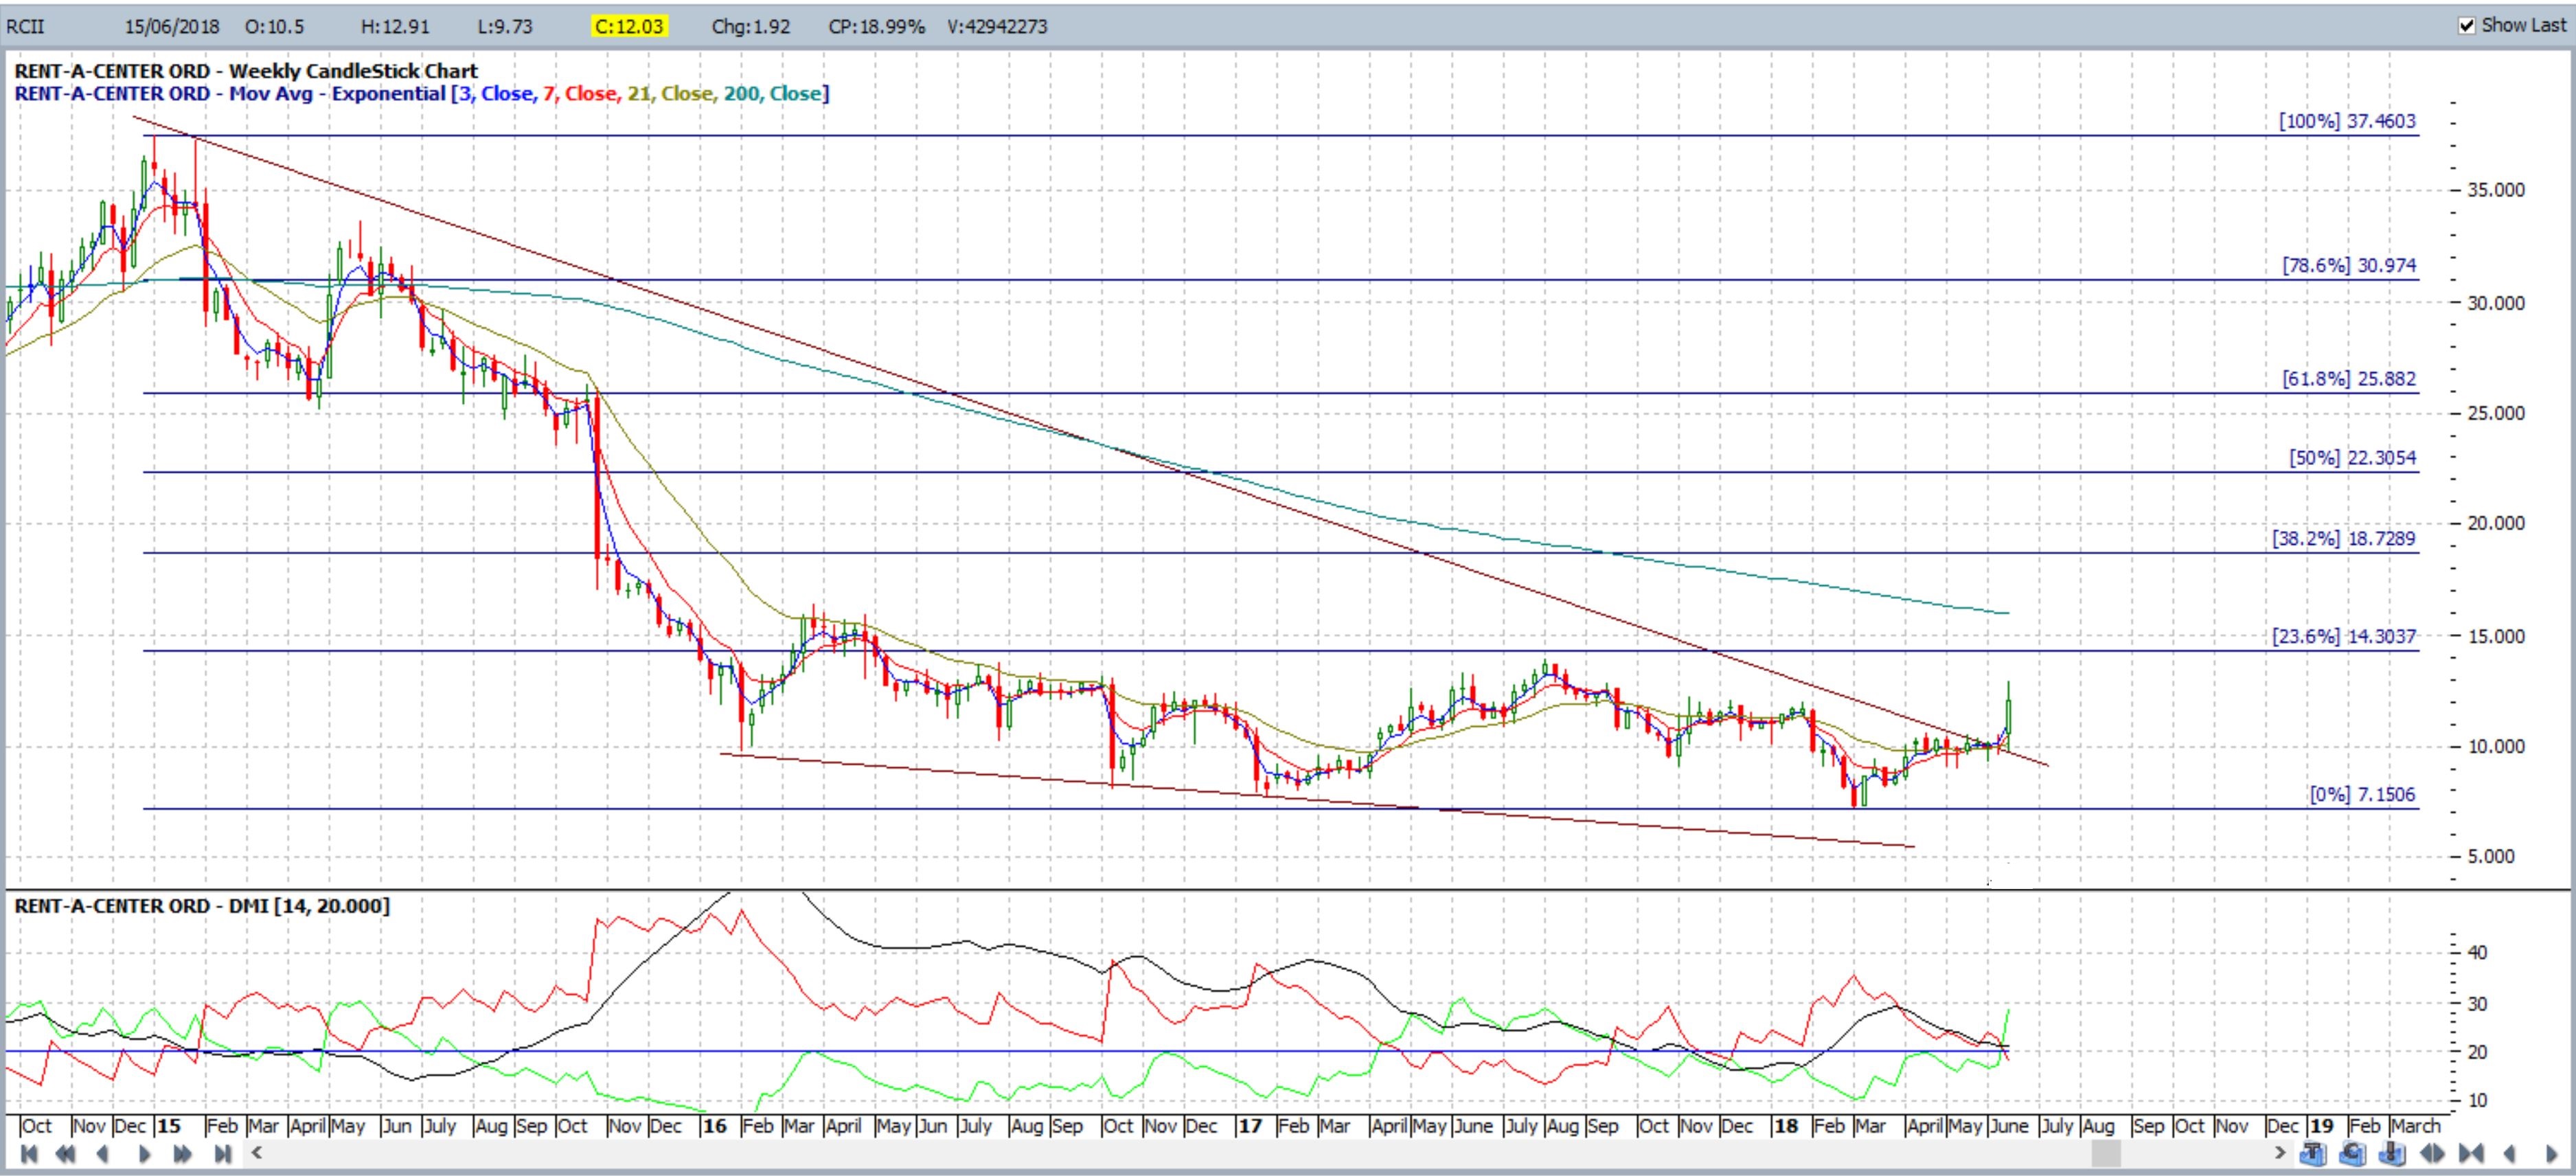
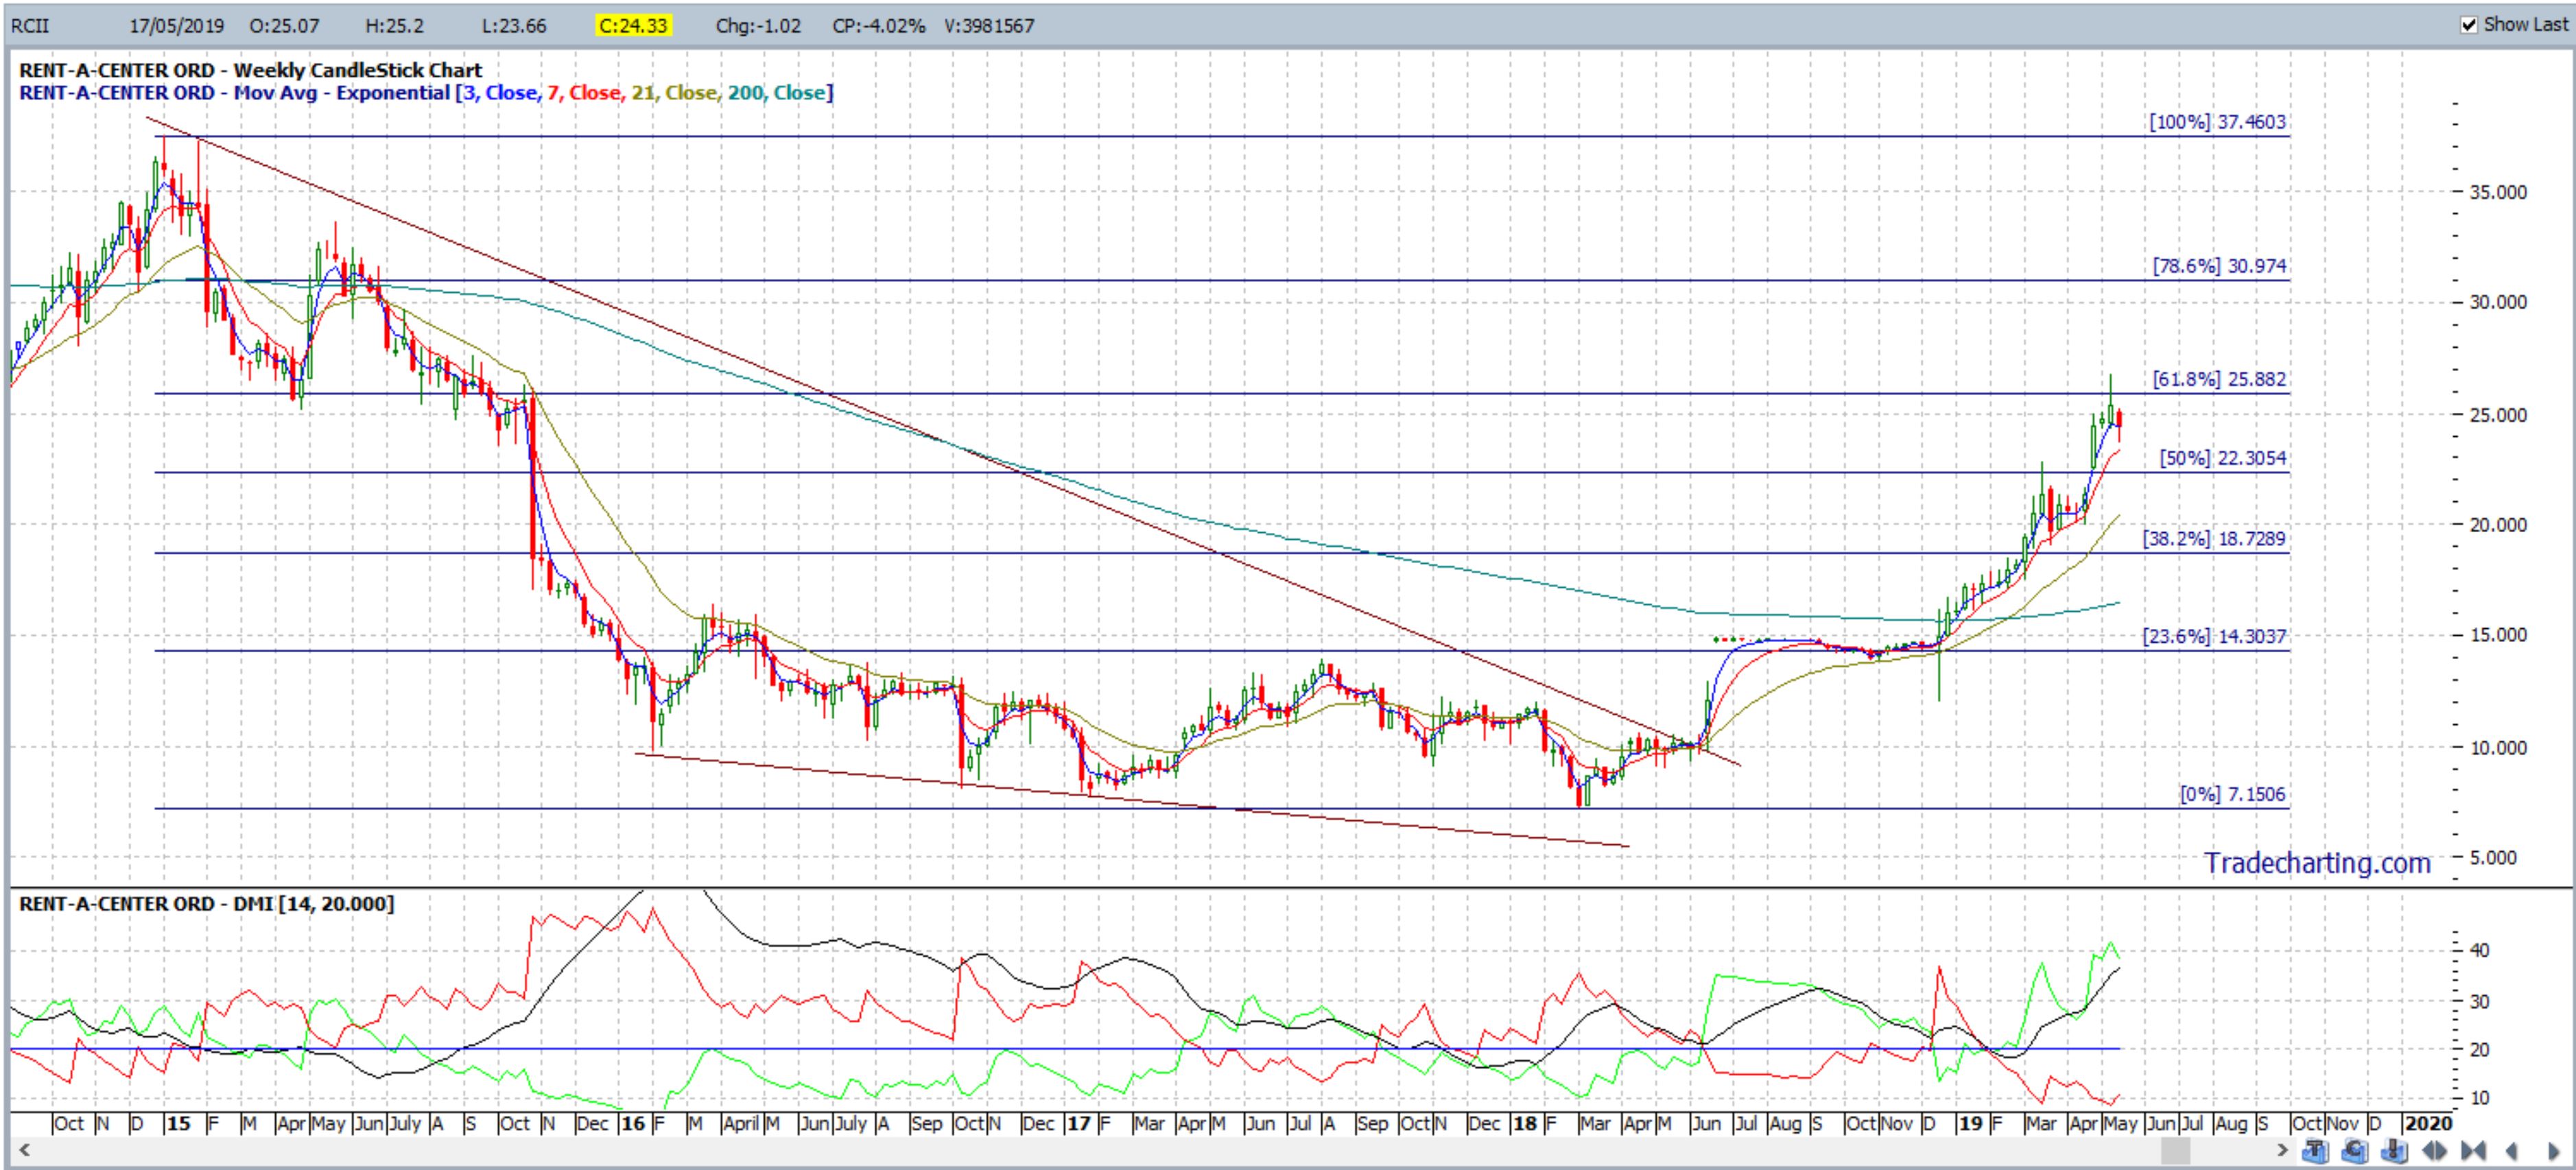
RCII weekly May 2019: This breakout triggered in mid 2018 but note where price action stalled! At the 61.8% Fib target for the breakout move:
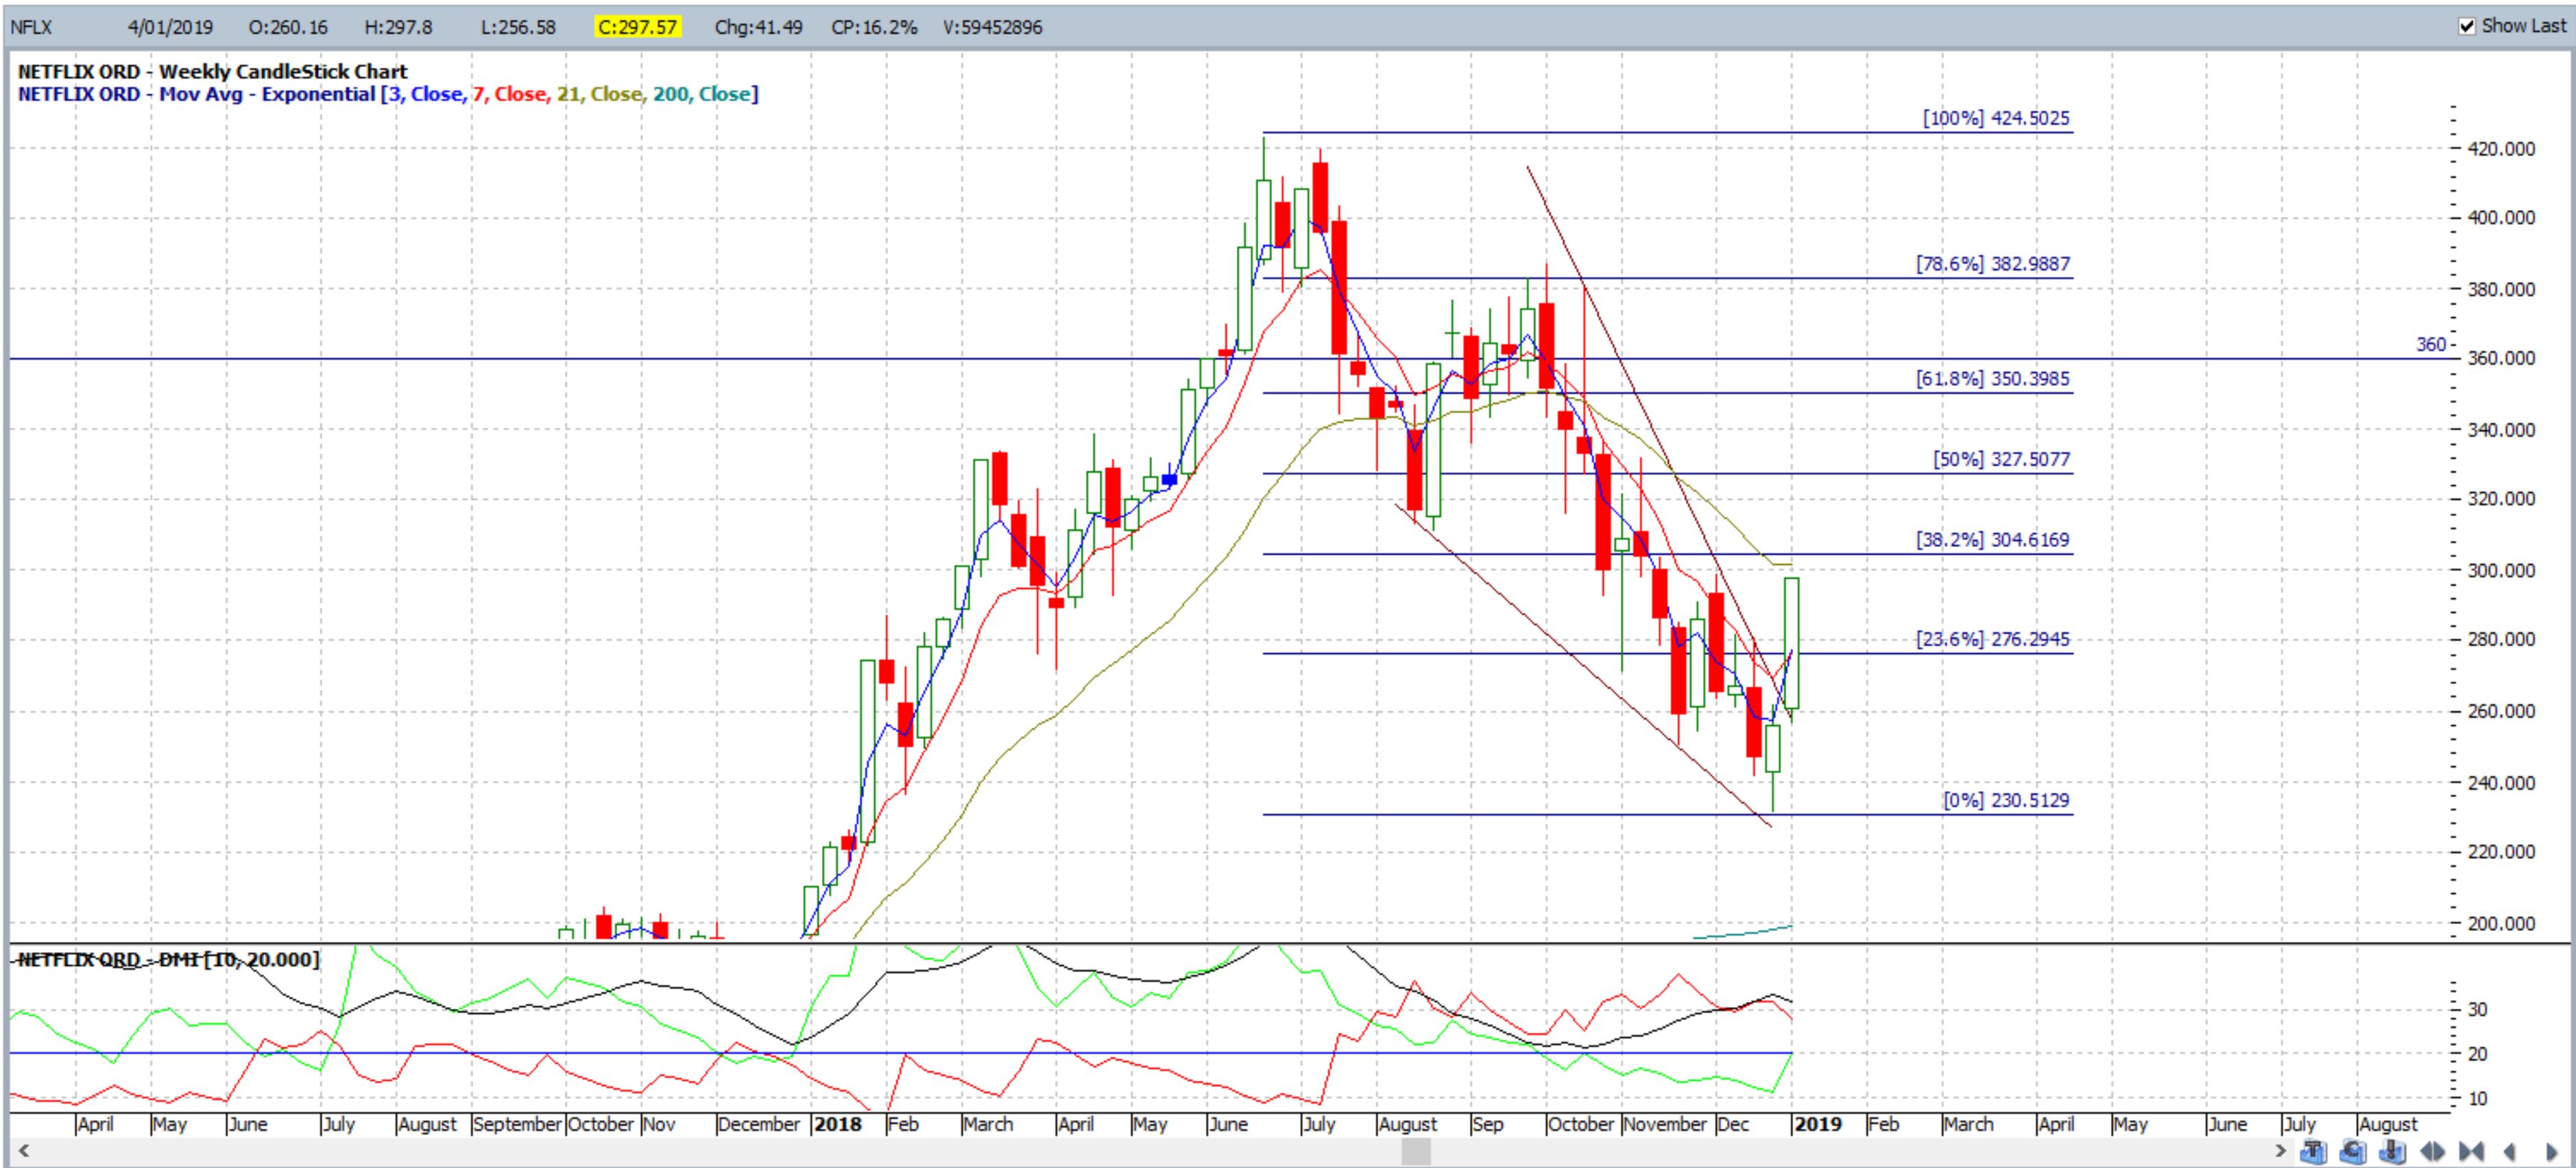
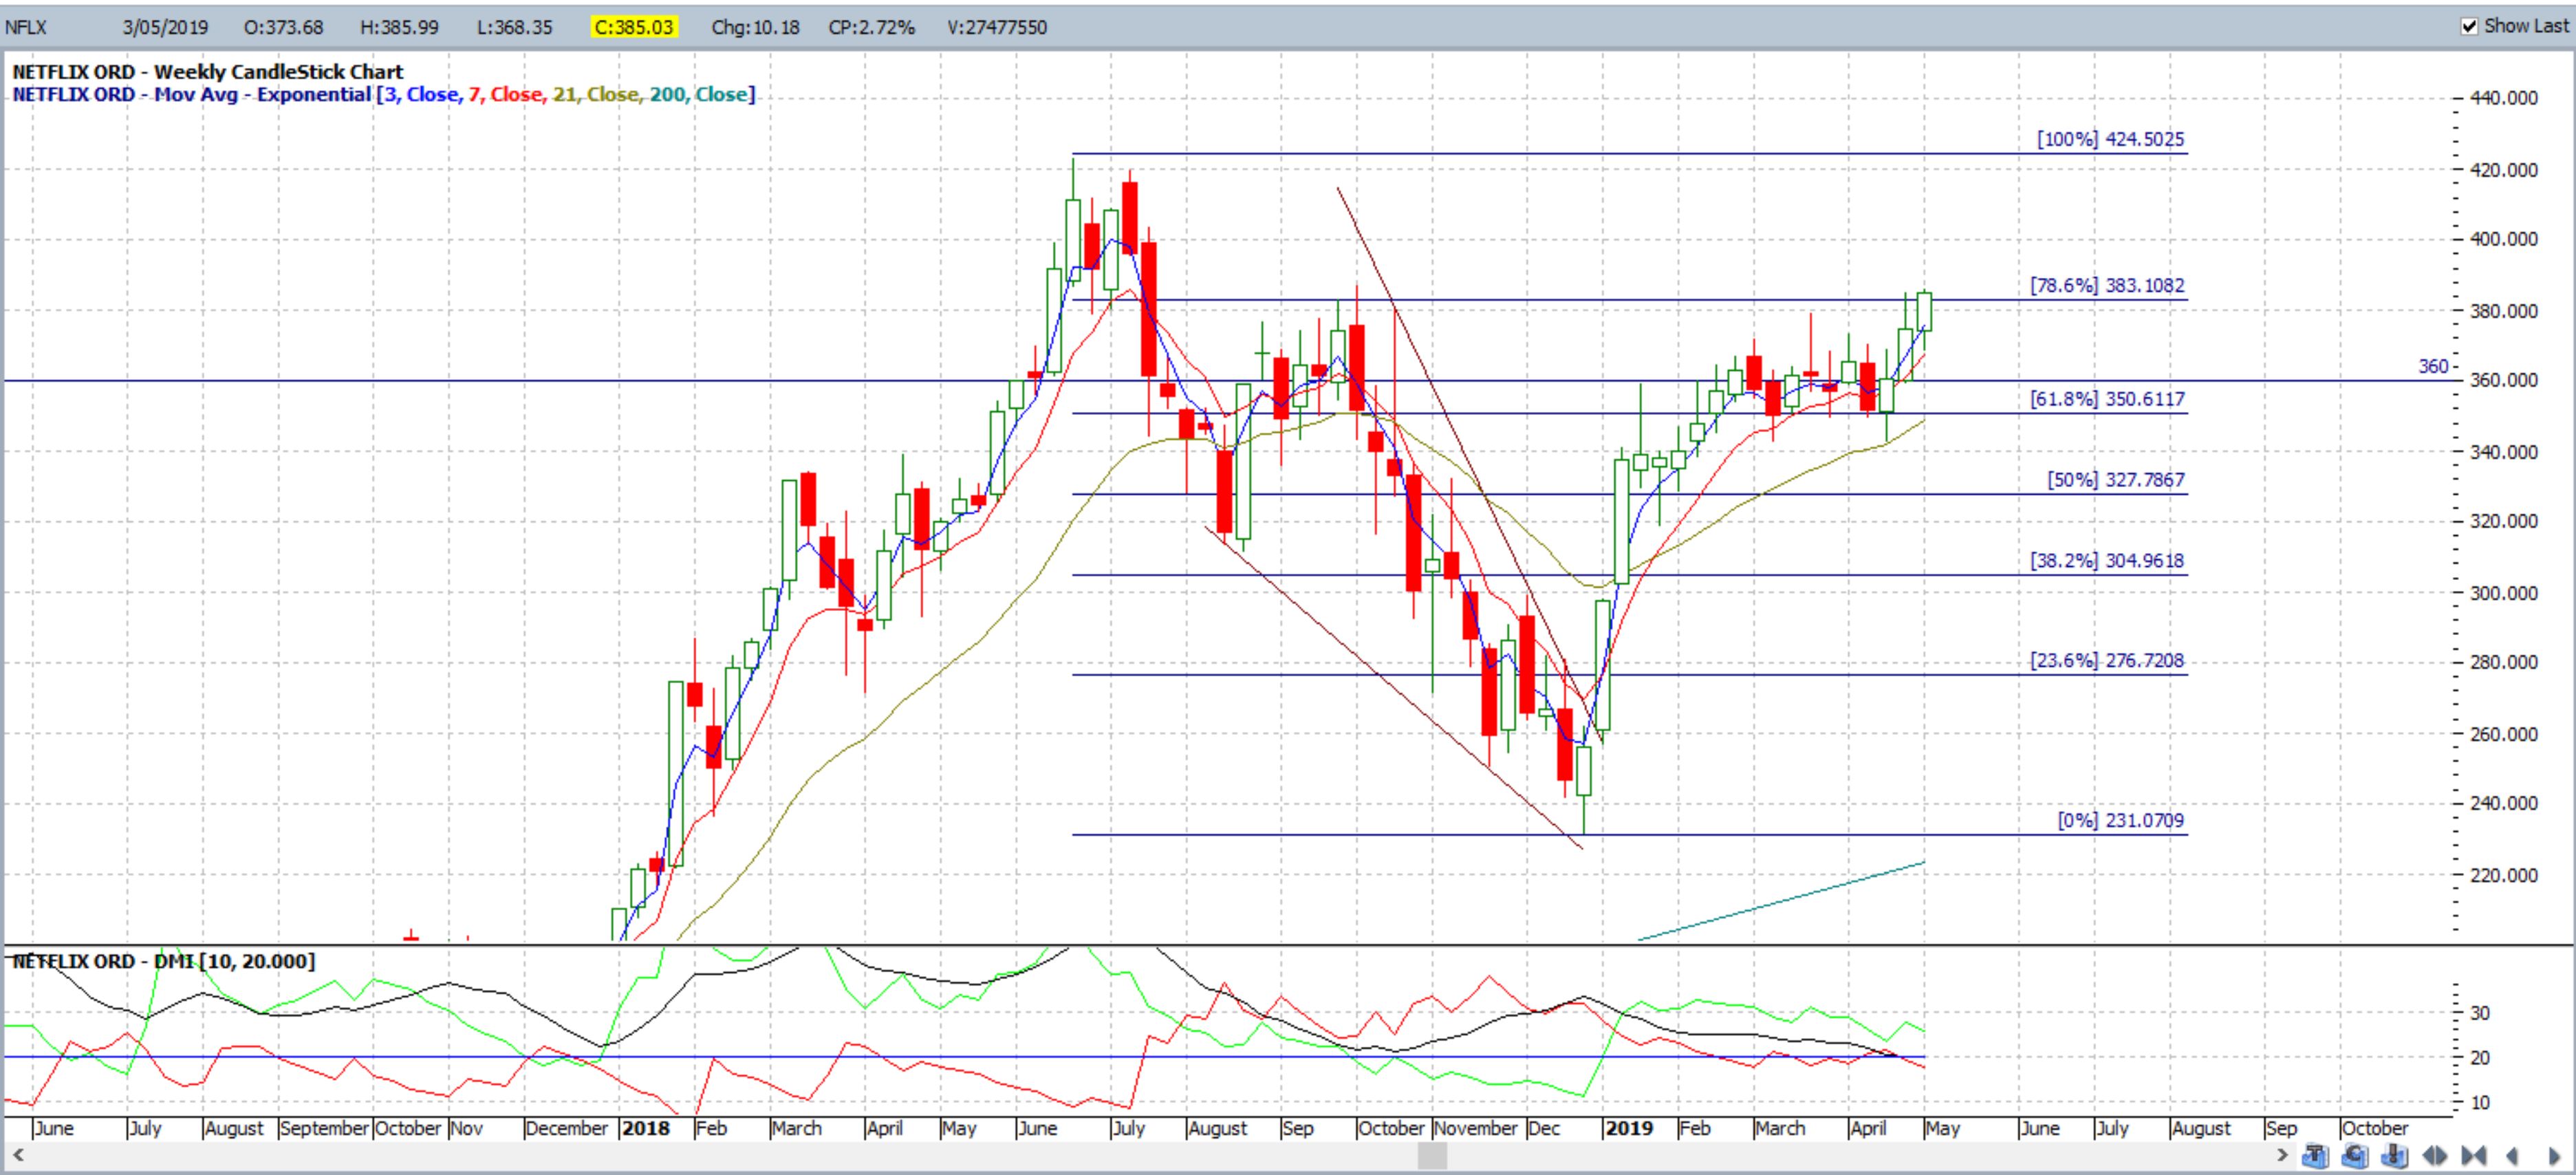
NFLX weekly May 2019: I posted a descending wedge chart of Netflix stock back in January 2019. The first chart shows the stock prior to the breakout, The second chart shows the new wedge breakout in progress. The third chart shows that the 61.8% fib target was reached, and then some, by May 2019:

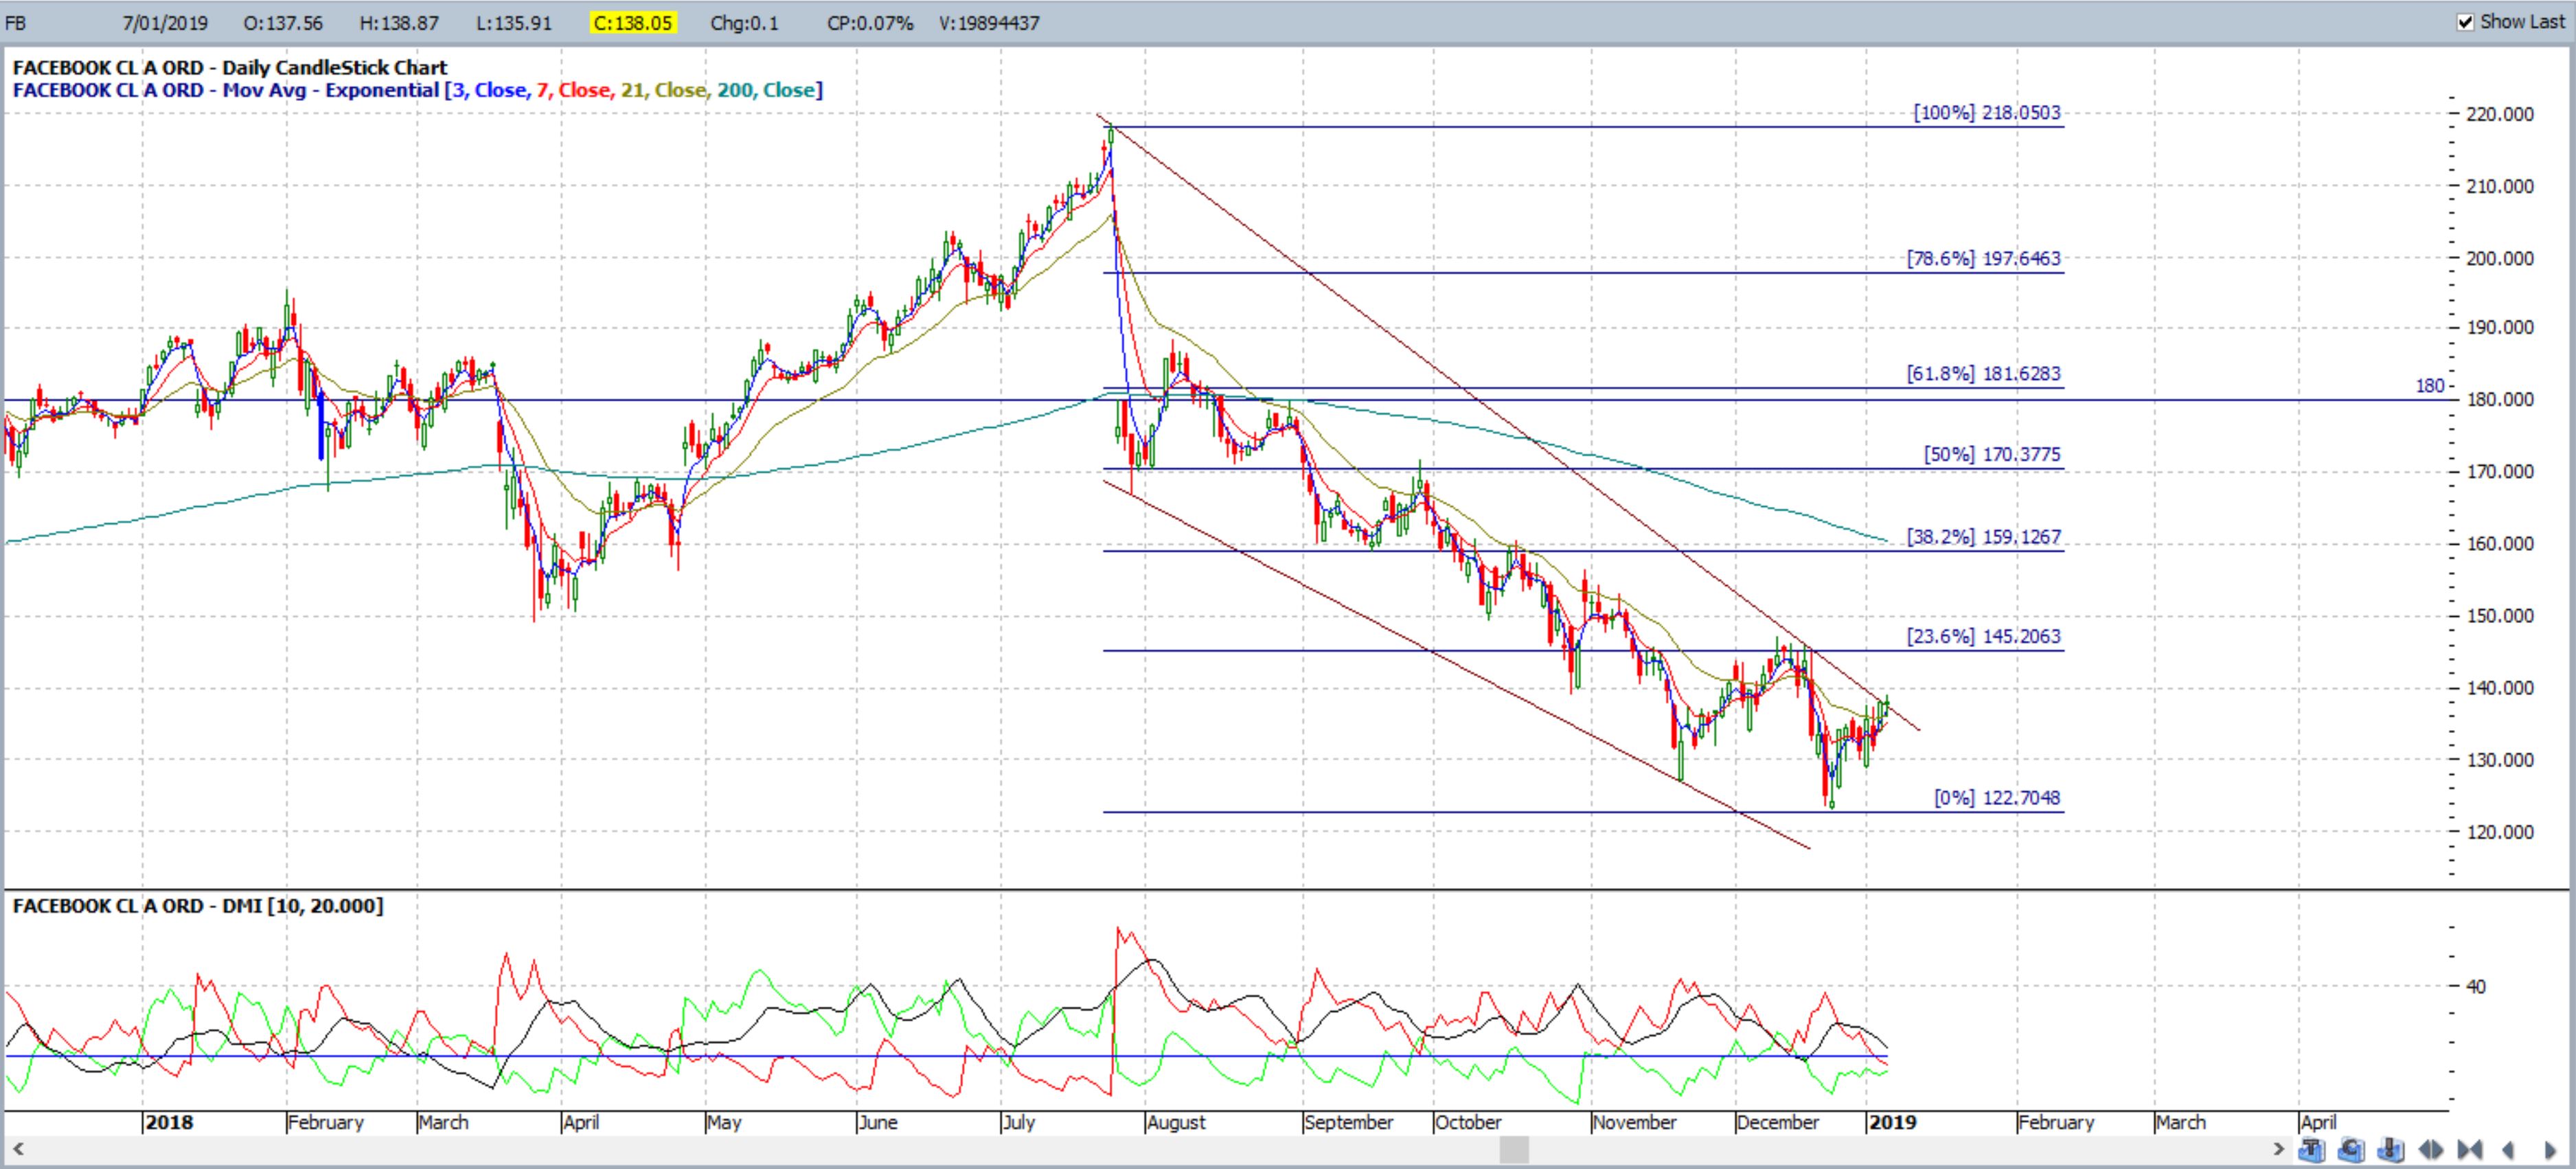
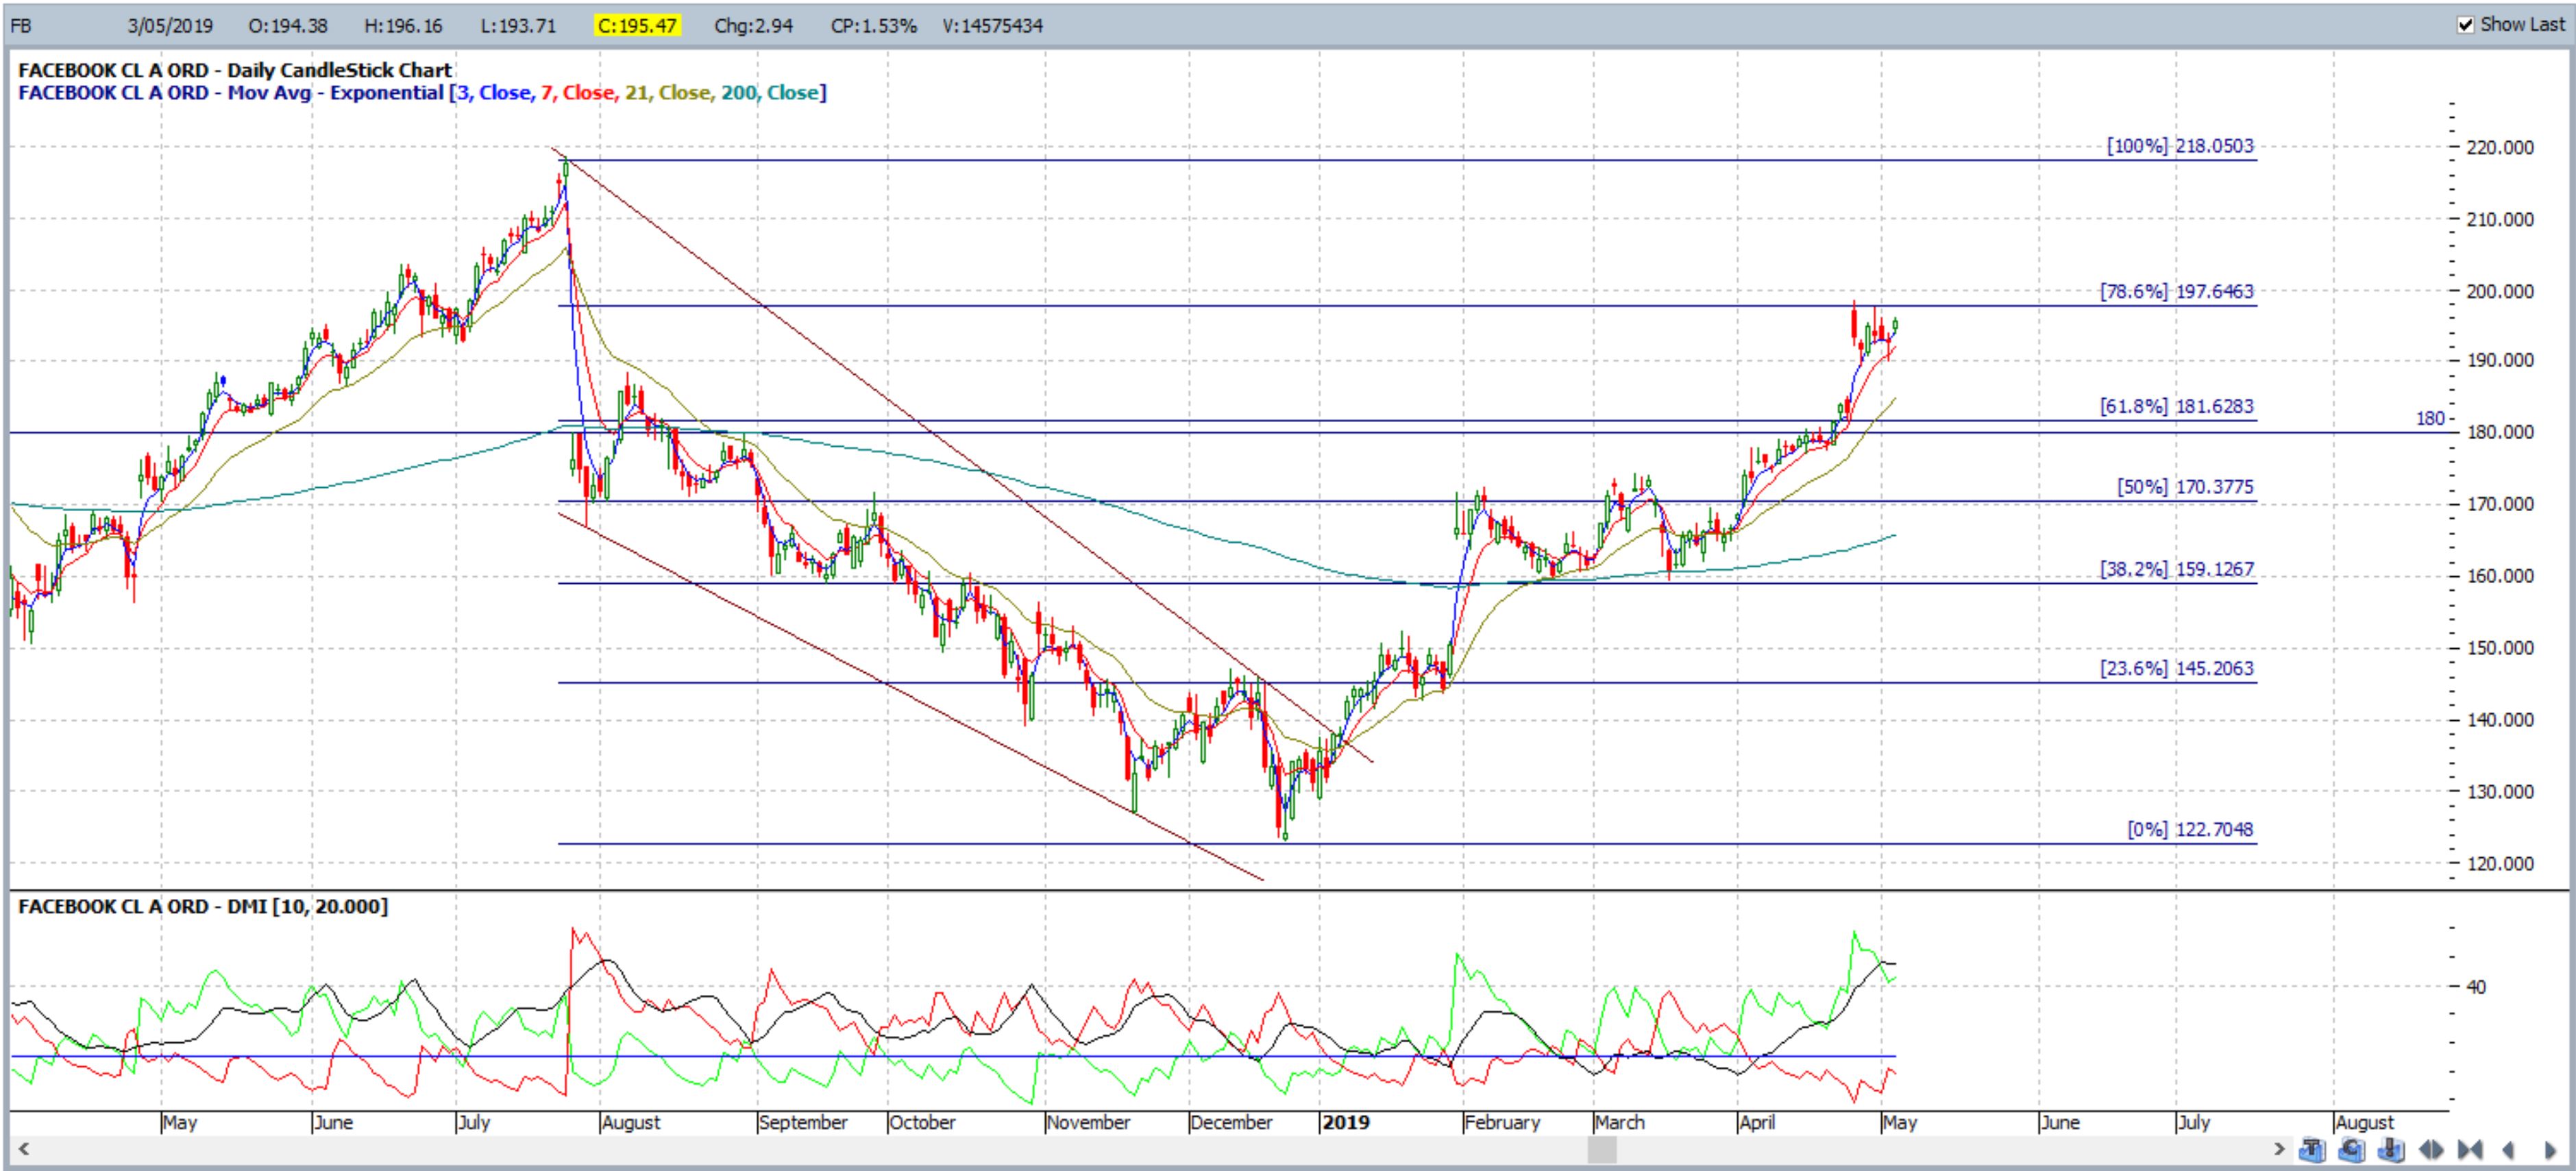
FB daily May 2019: I posted a descending wedge chart of Facebook stock back in January 2019. The chart derived from this post can be seen in the first screen shot below. The second chart shows that the 61.8% fib target was reached, and then some, by May 2019:
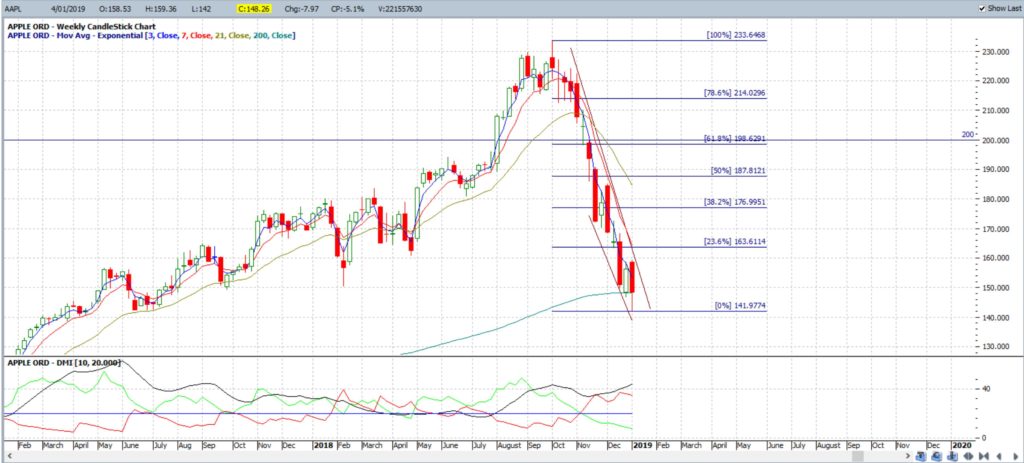
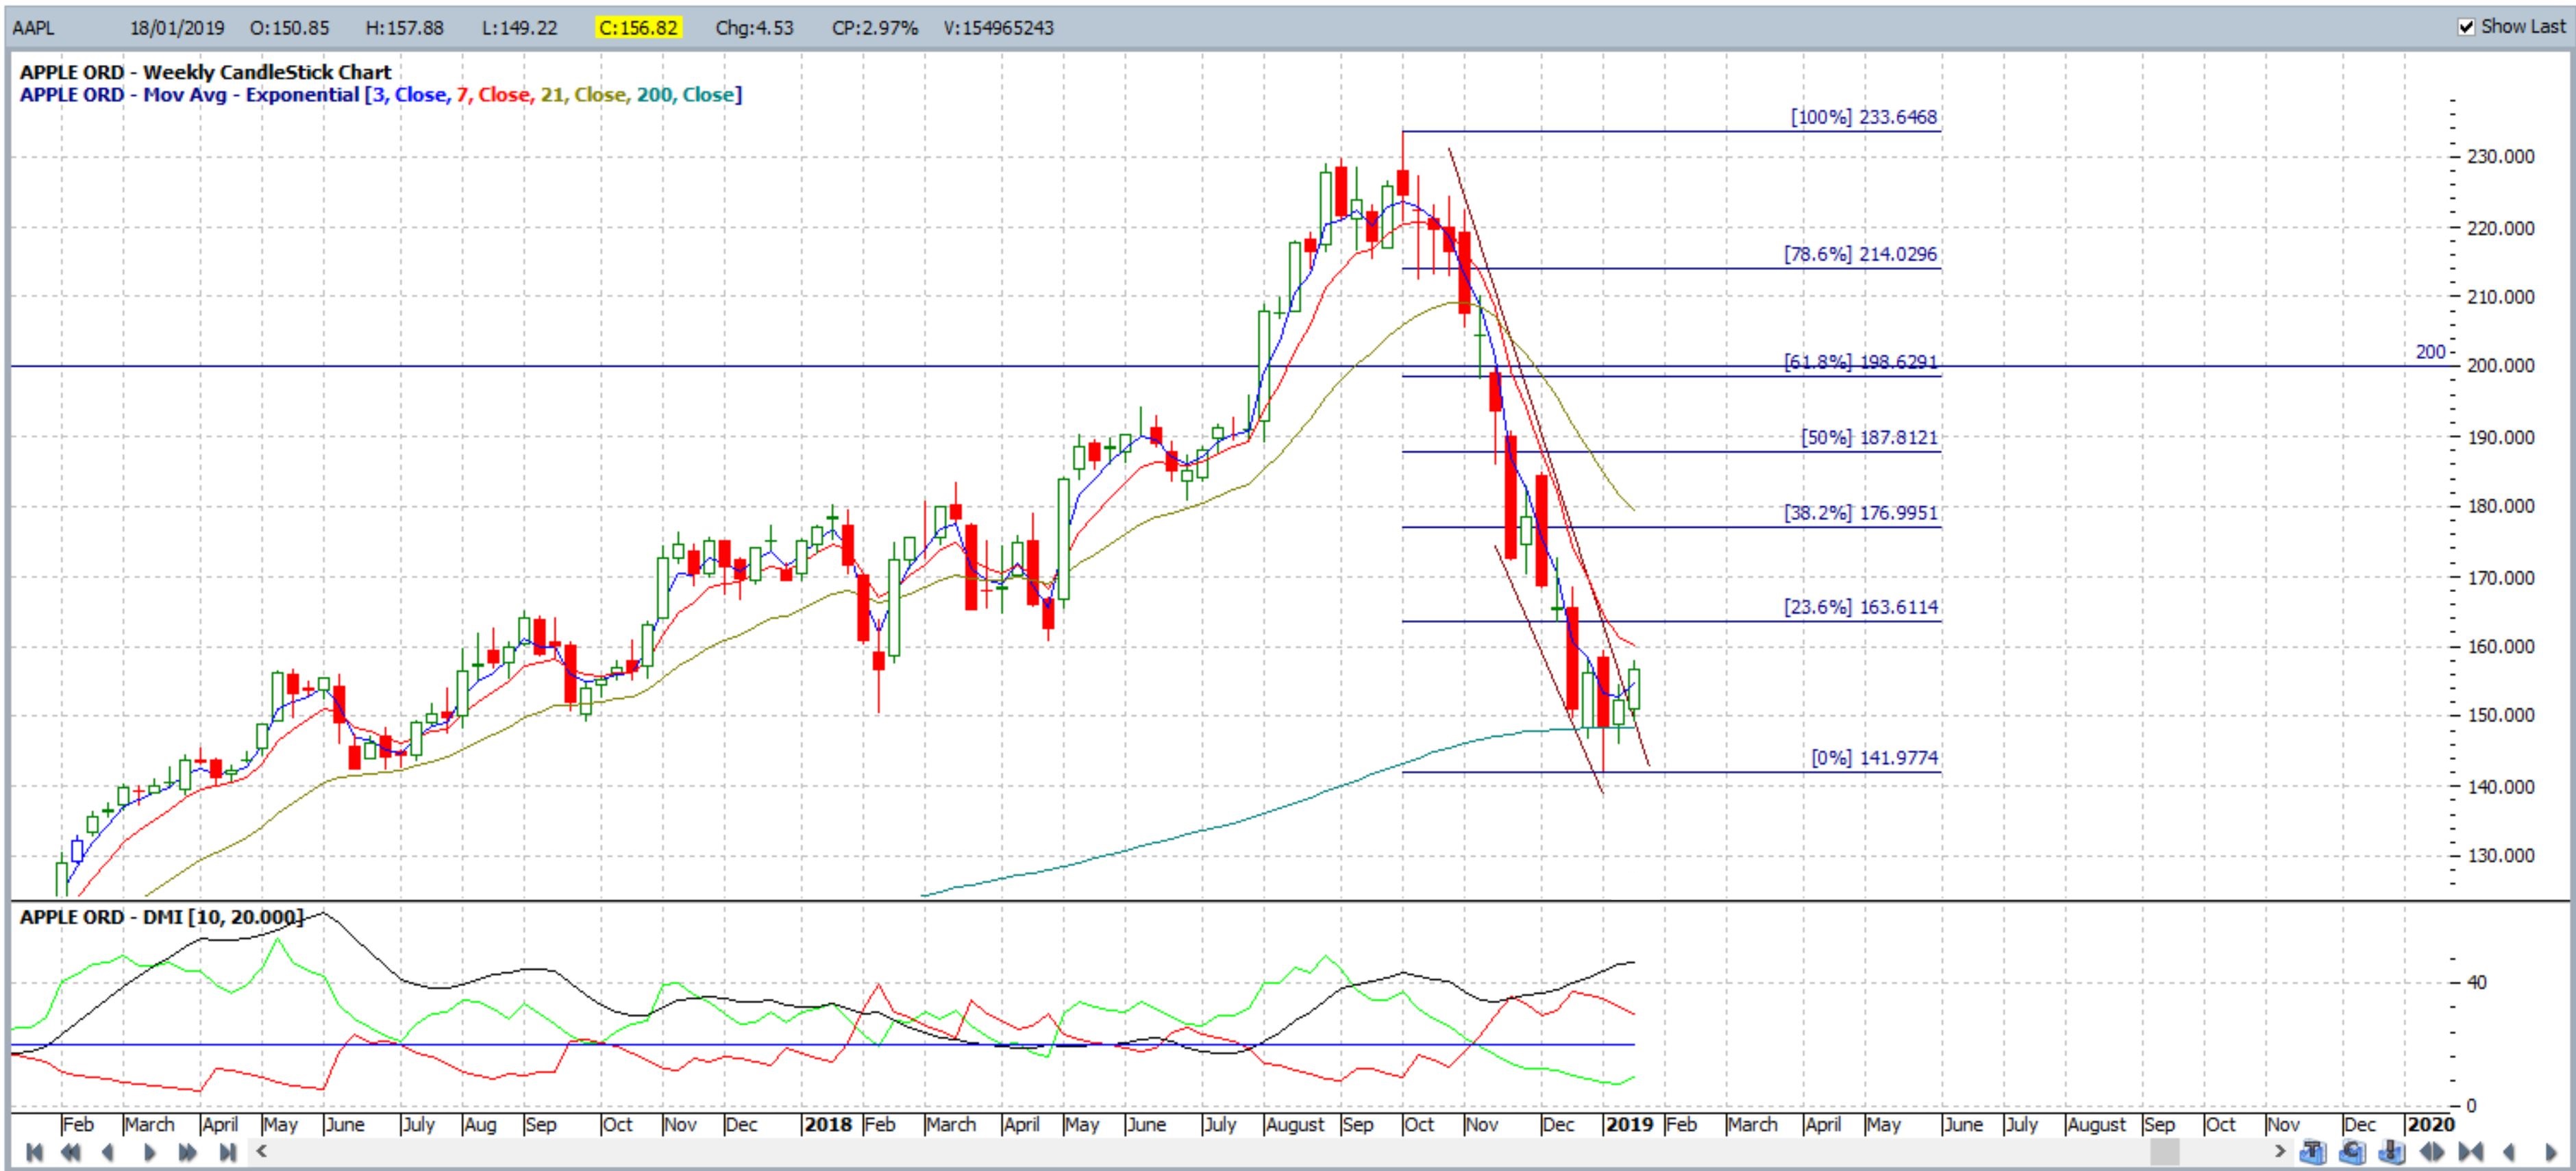
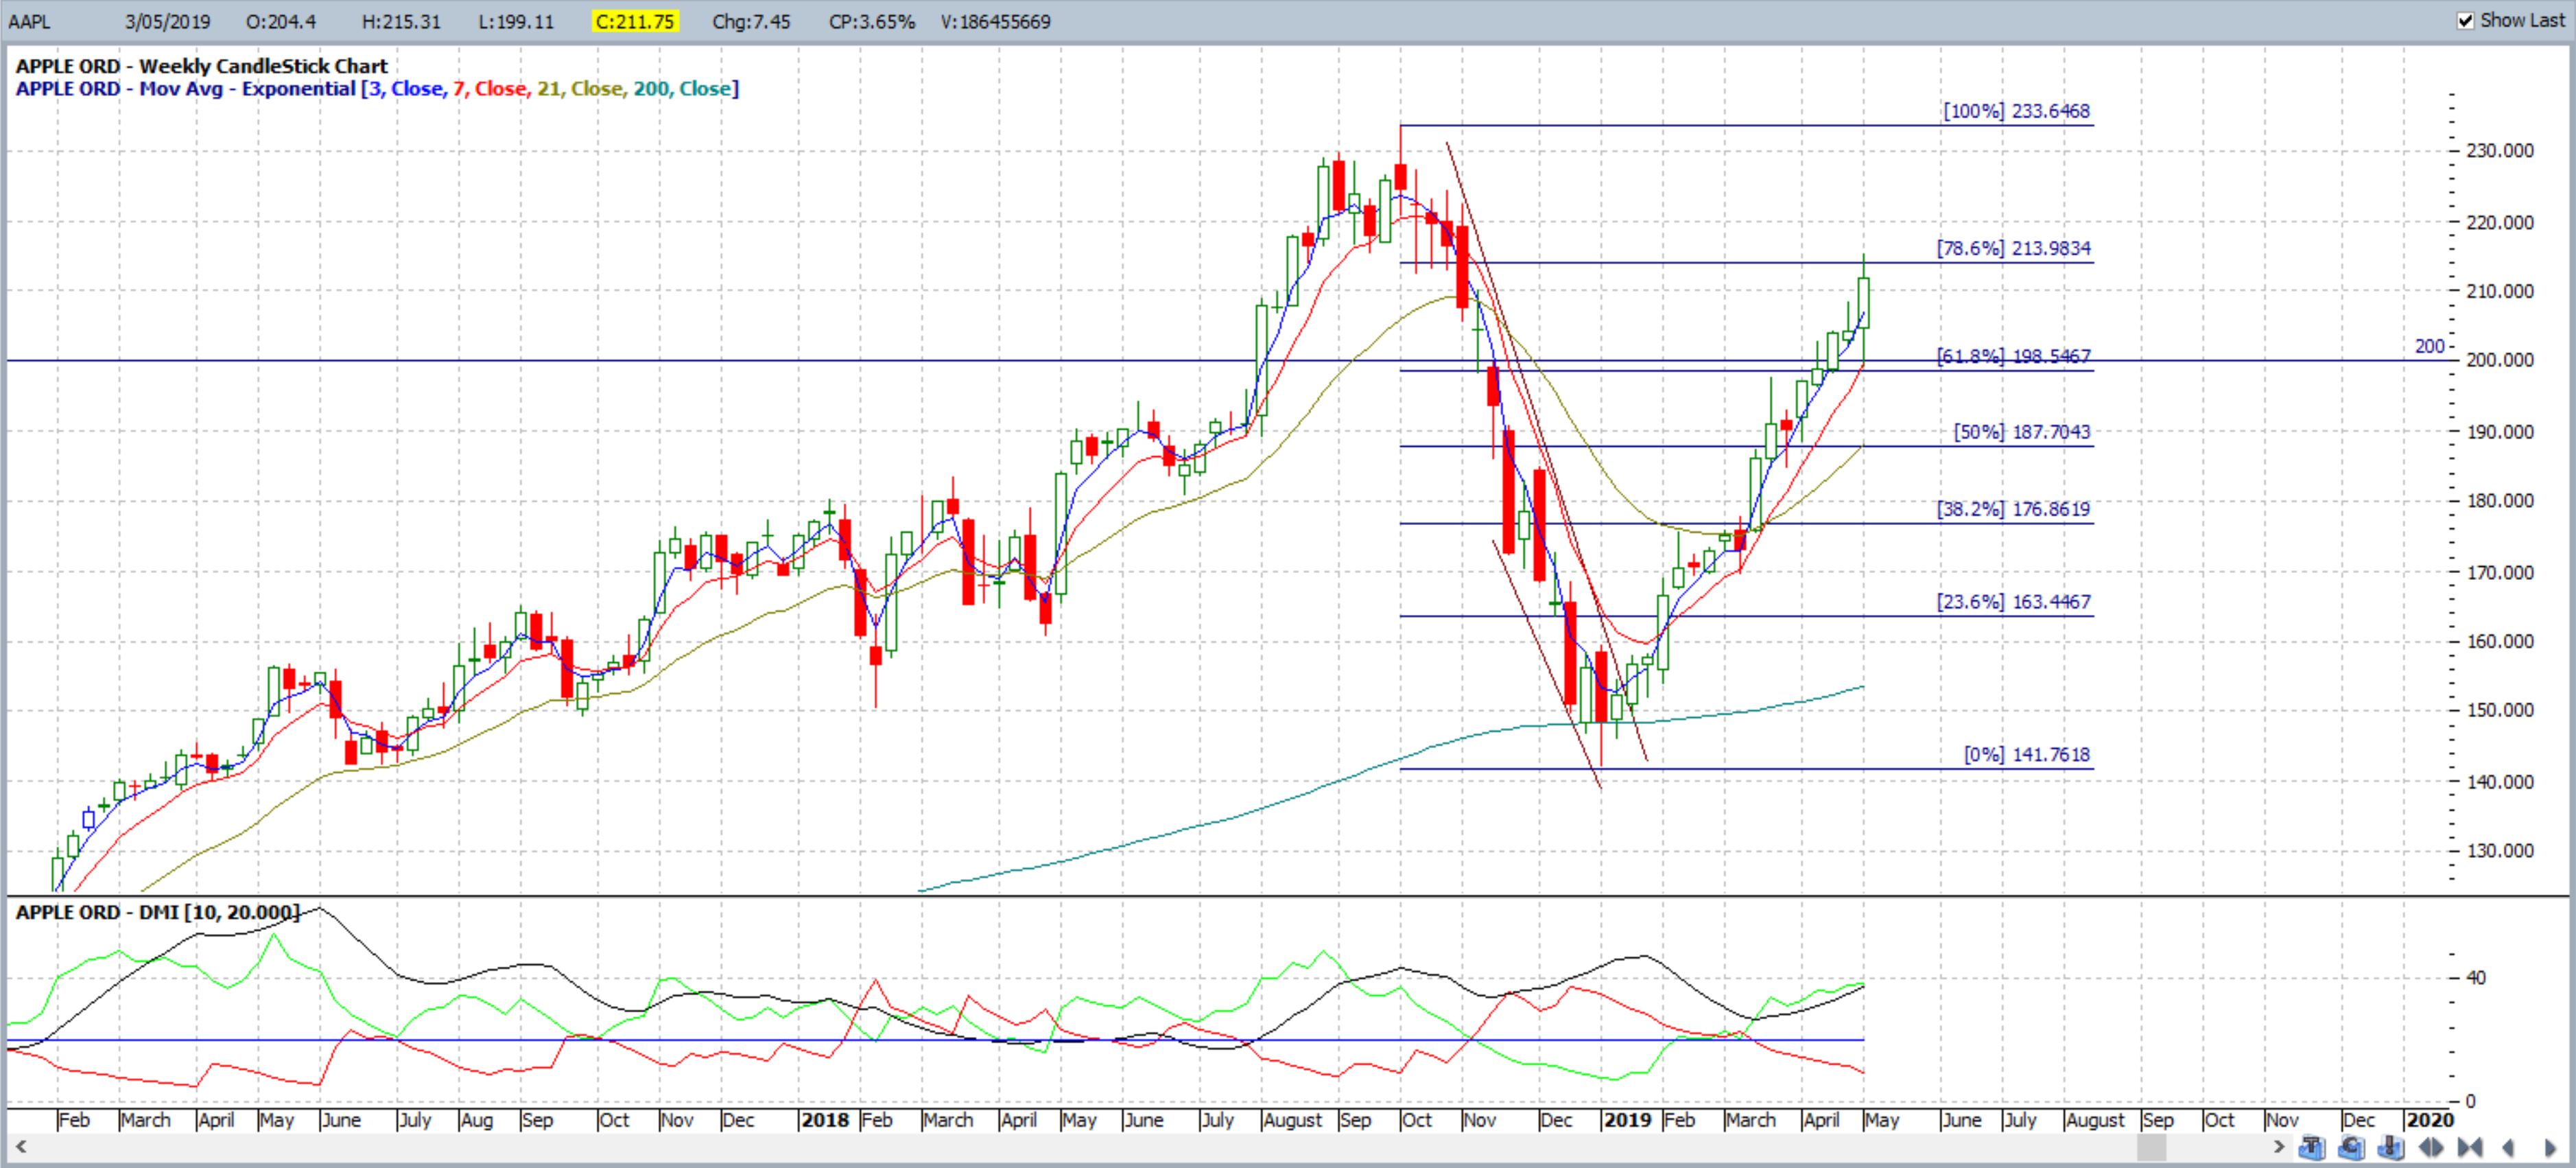
AAPL weekly: May 2019: I posted a descending wedge chart of Apple stock back in January 2019. The chart from this post can be seen in the first screen shot below. The second chart shows the breakout a week or so later and the third chart shows that the 61.8% fib target was reached, and then some, by May 2019:
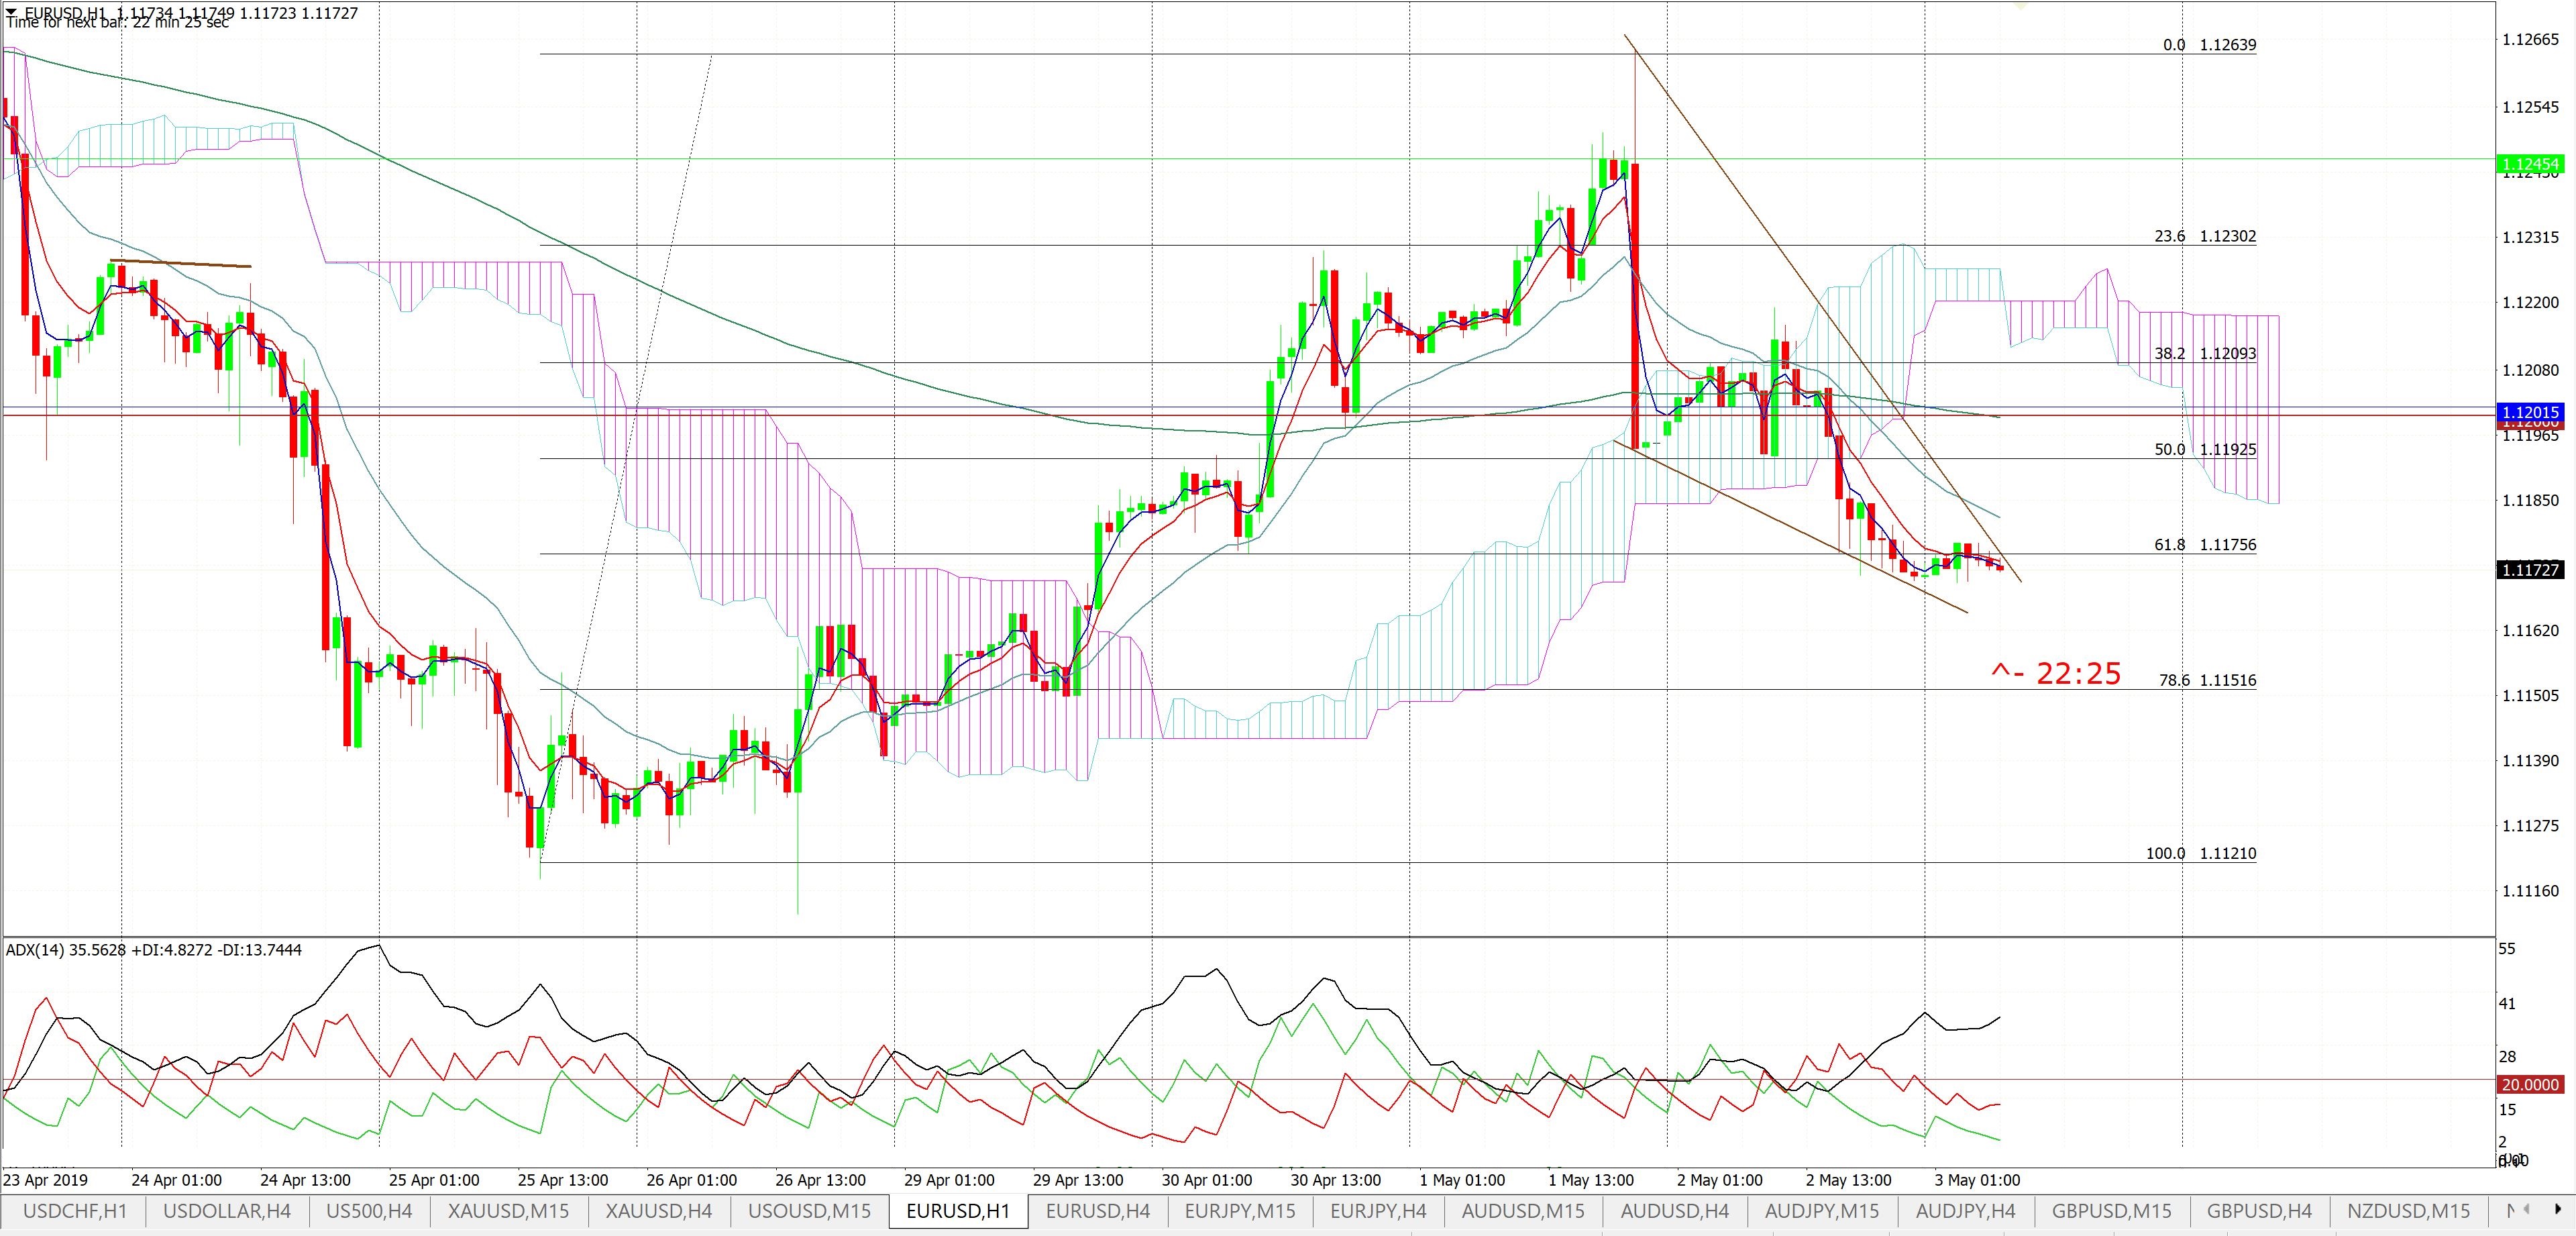
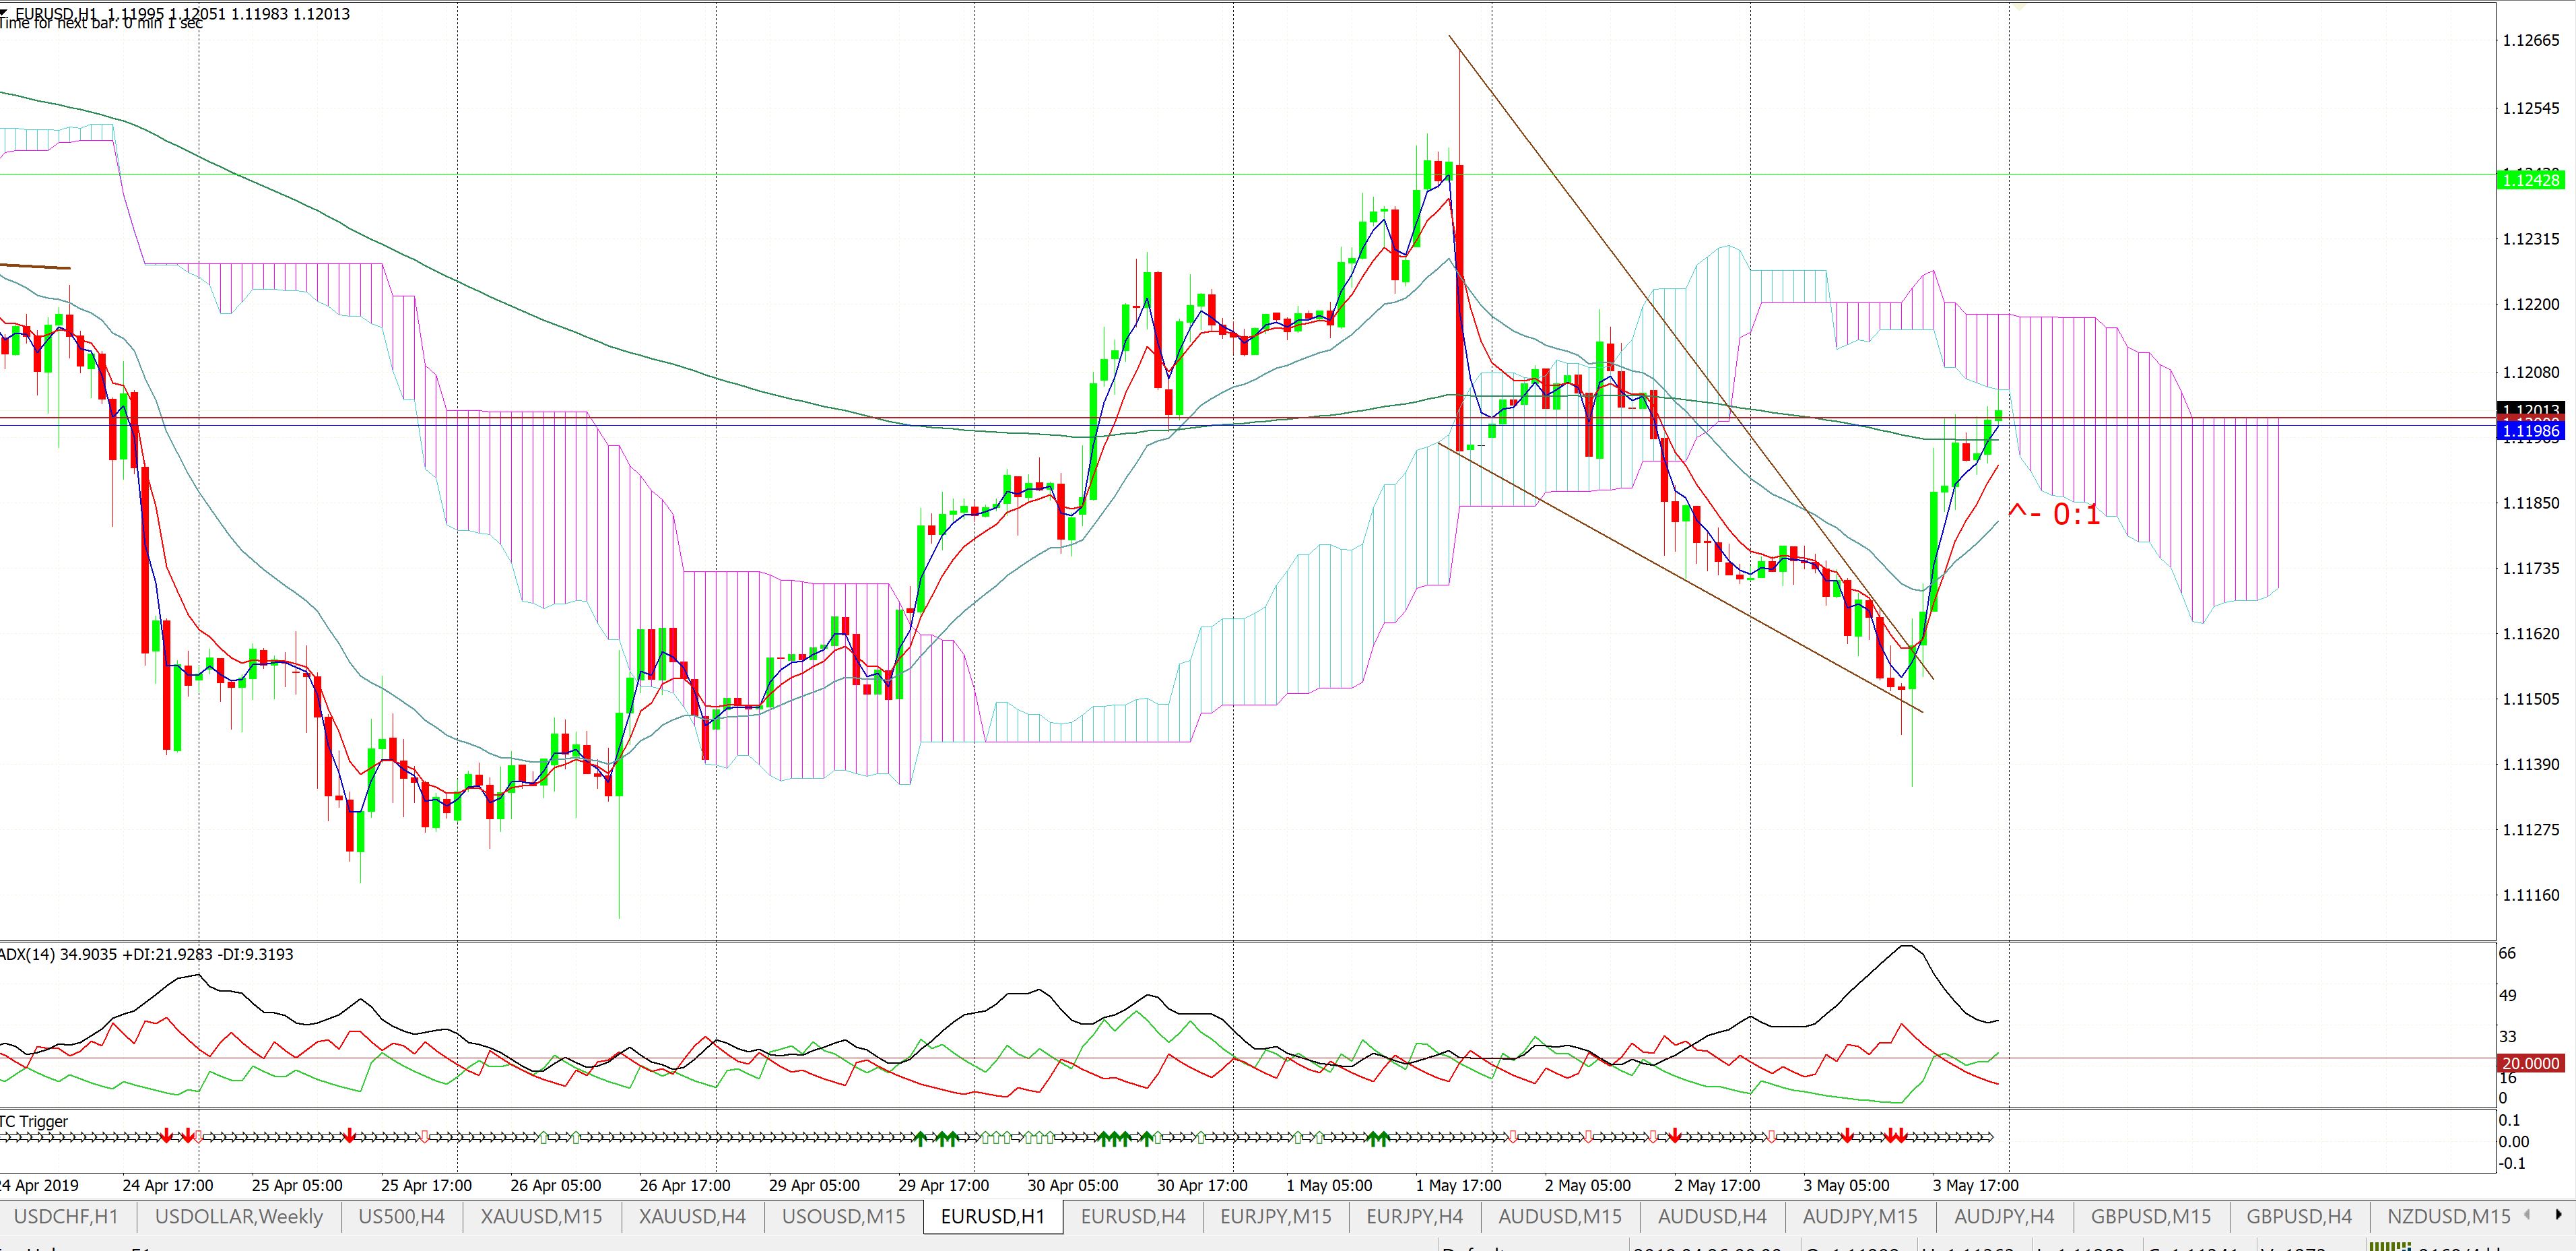
EUR/USD 60 min: May 3rd 2019: I posted this descending wedge chart on Forex Live on Friday 3rd May. The wedge developed a bit further but did eventually breakout to the upside:
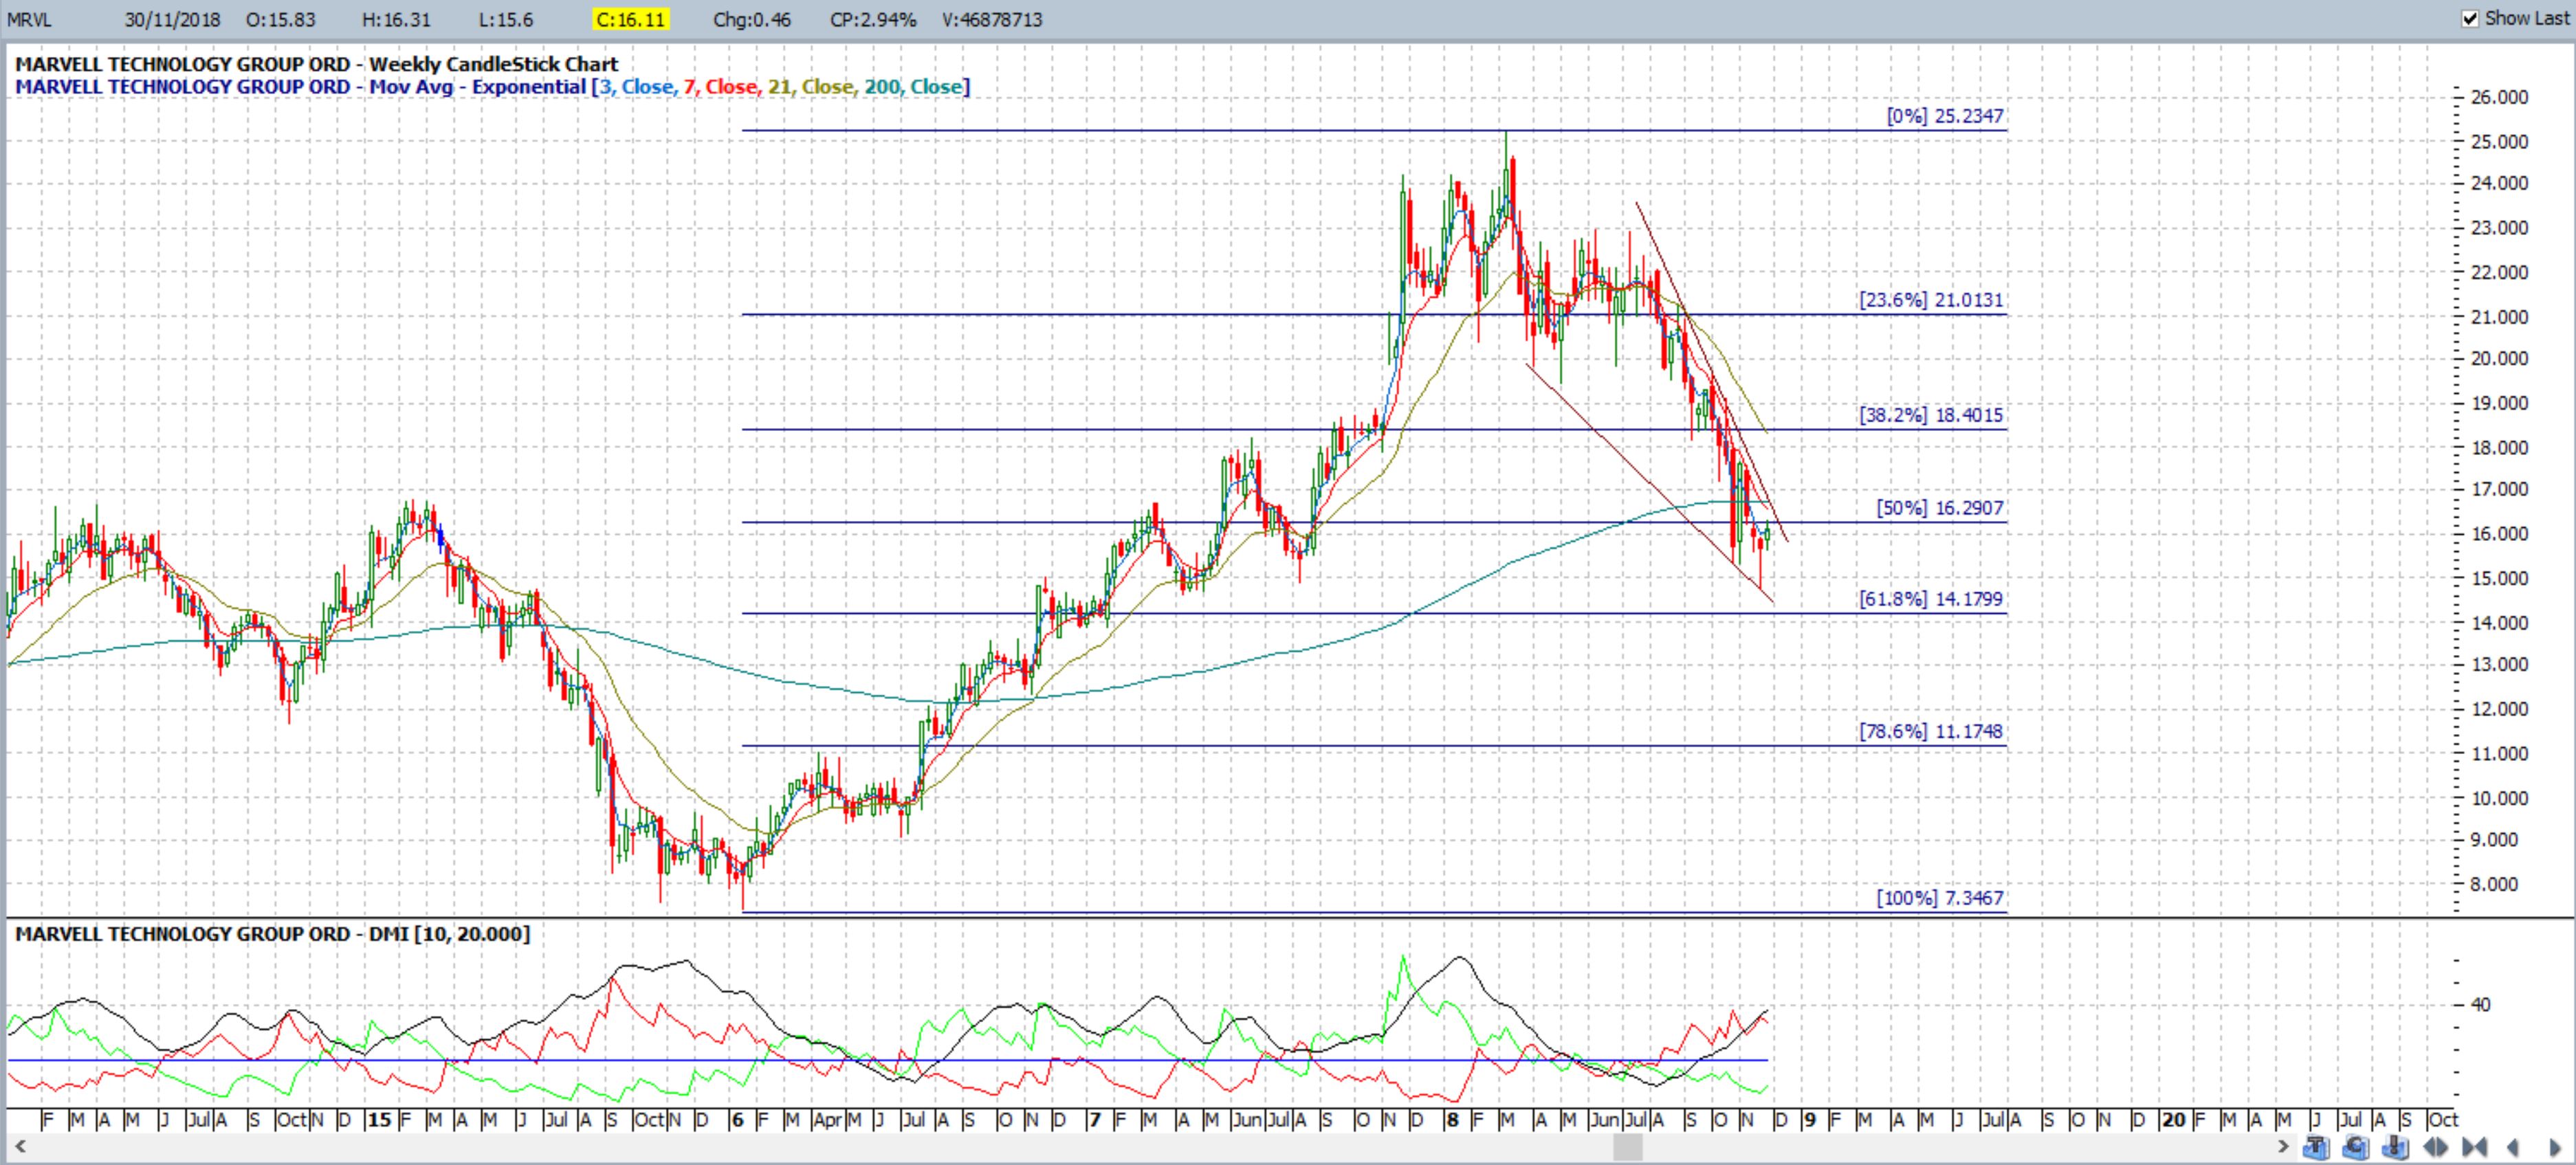
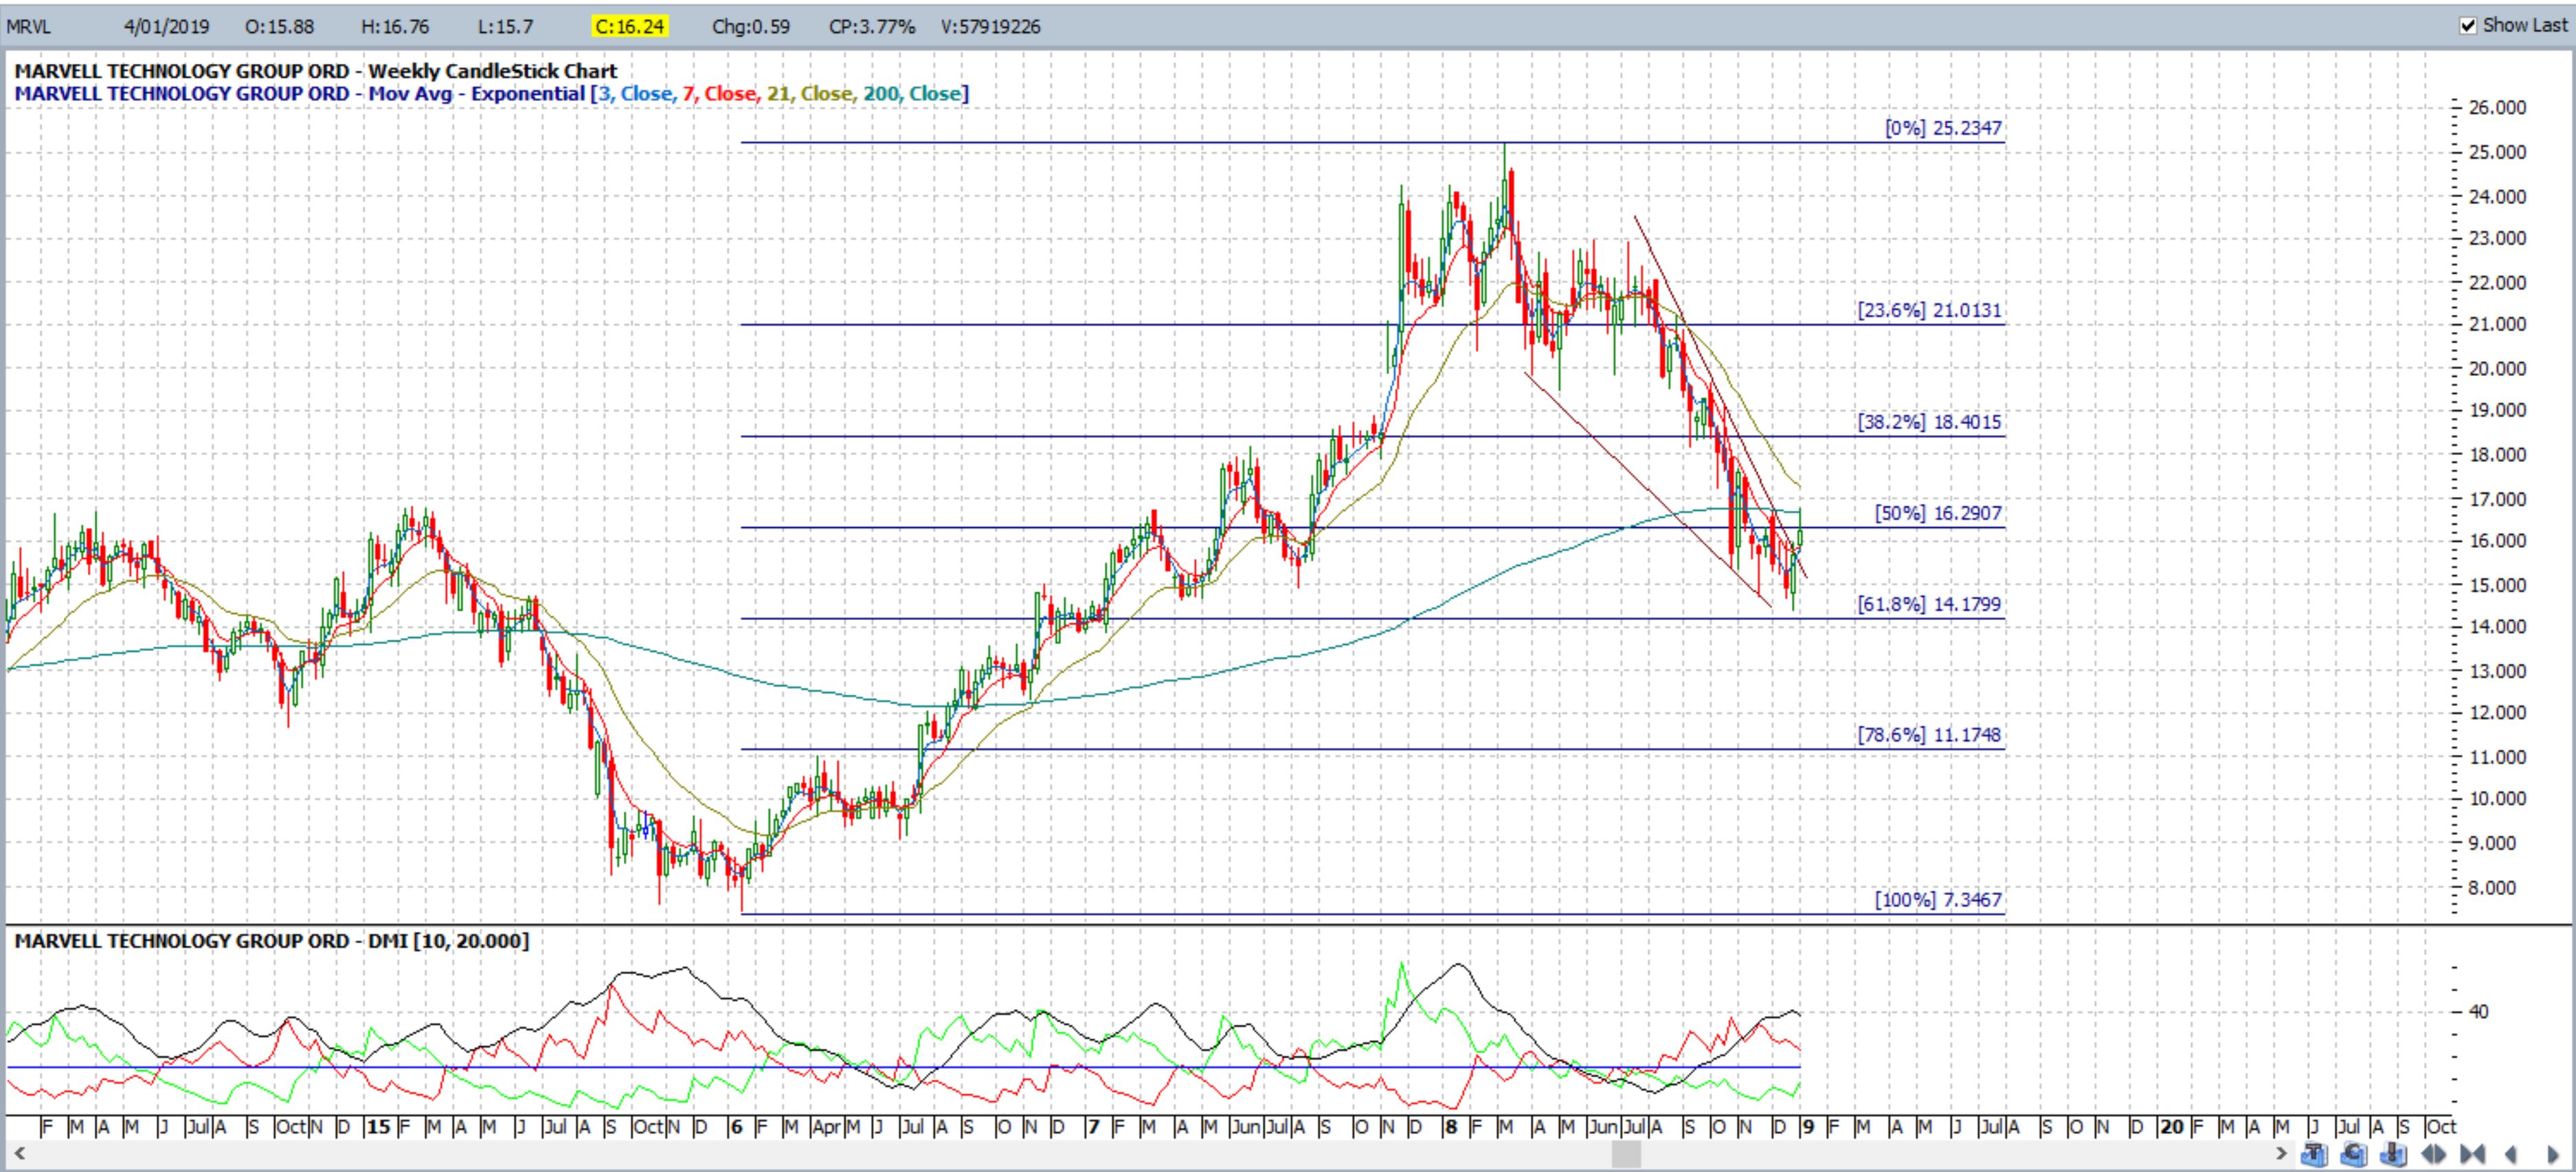
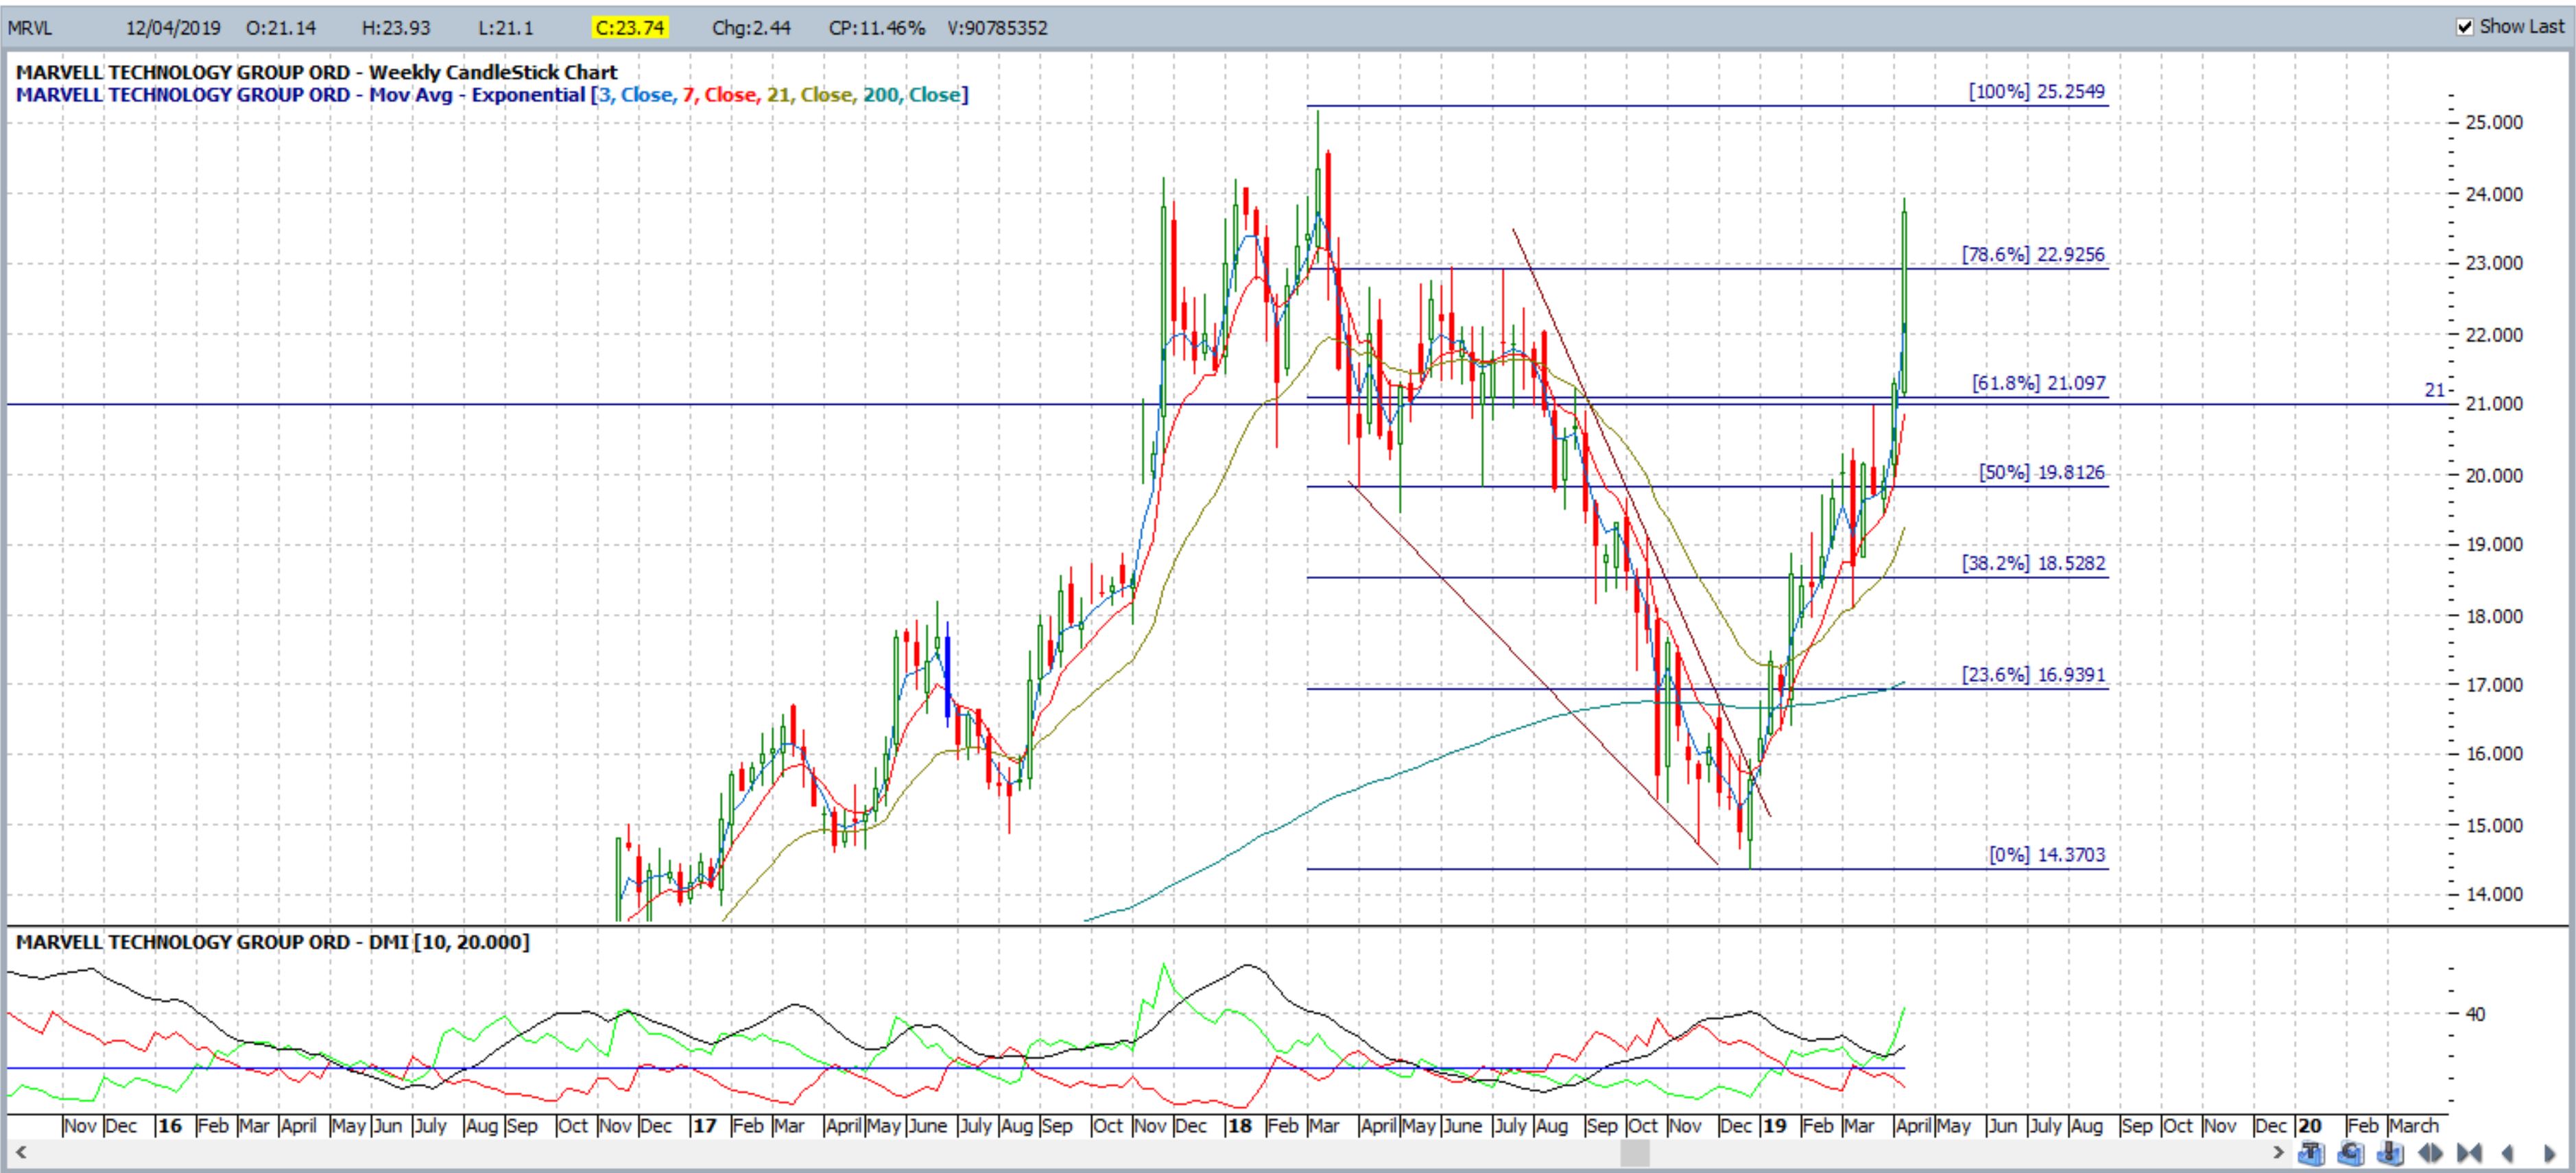
MRVL weekly: Marvel Technology: May 2019: this descending wedge was posted back in January 2019 and the first move reached the 61.8% fib target and then some! The previous High, circa $25, was in focus but has now also been reached:


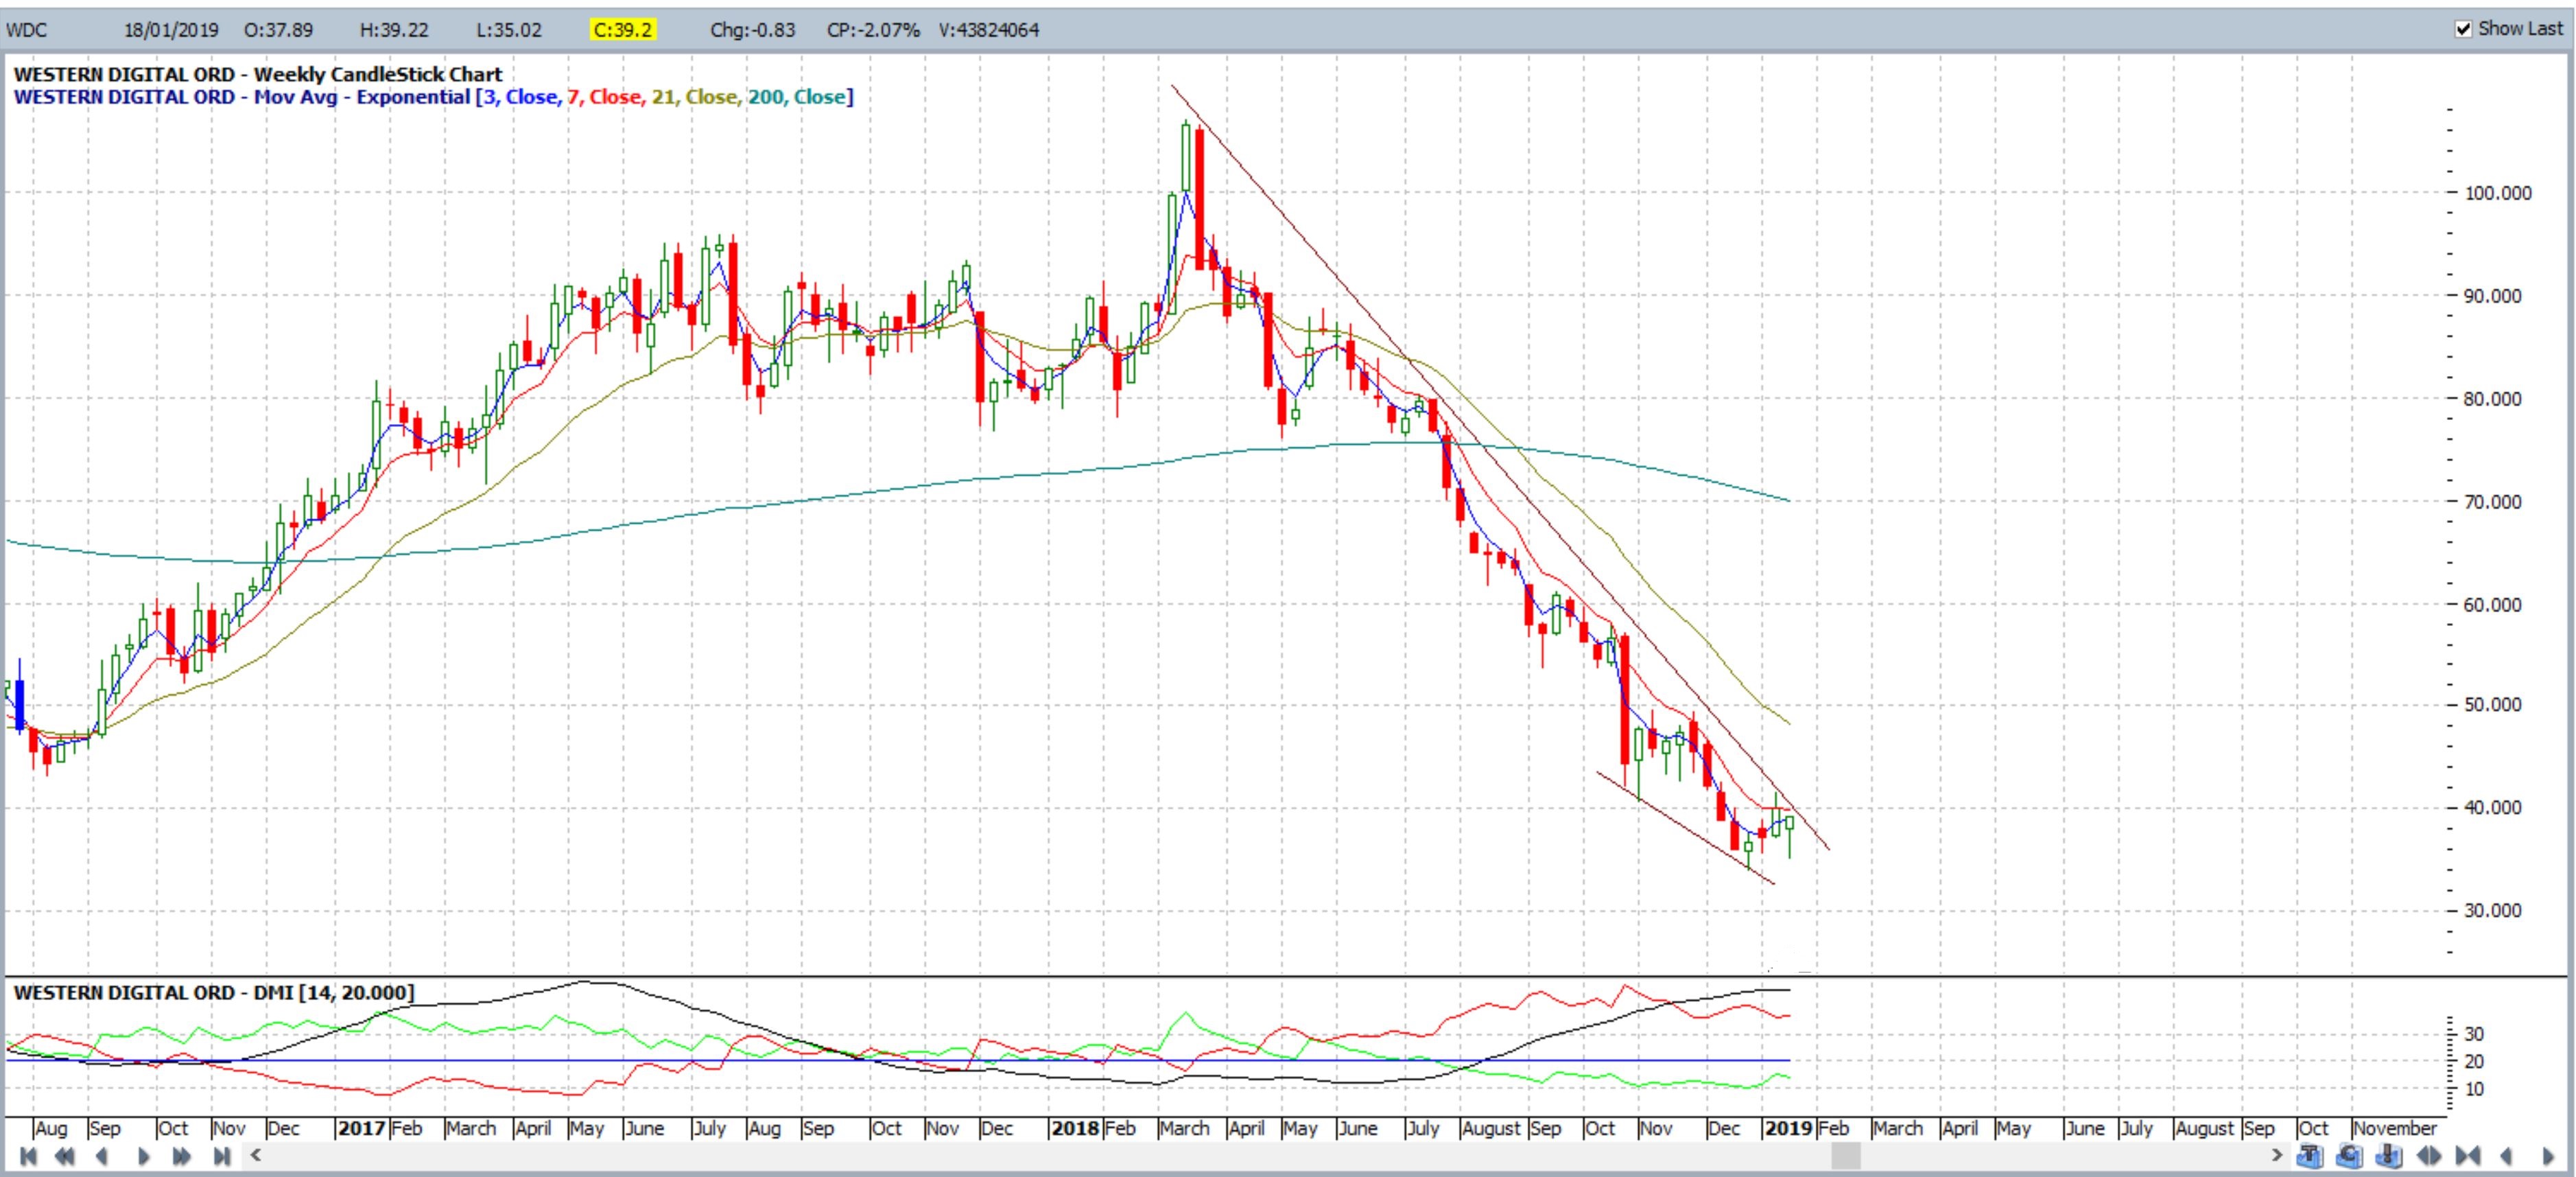
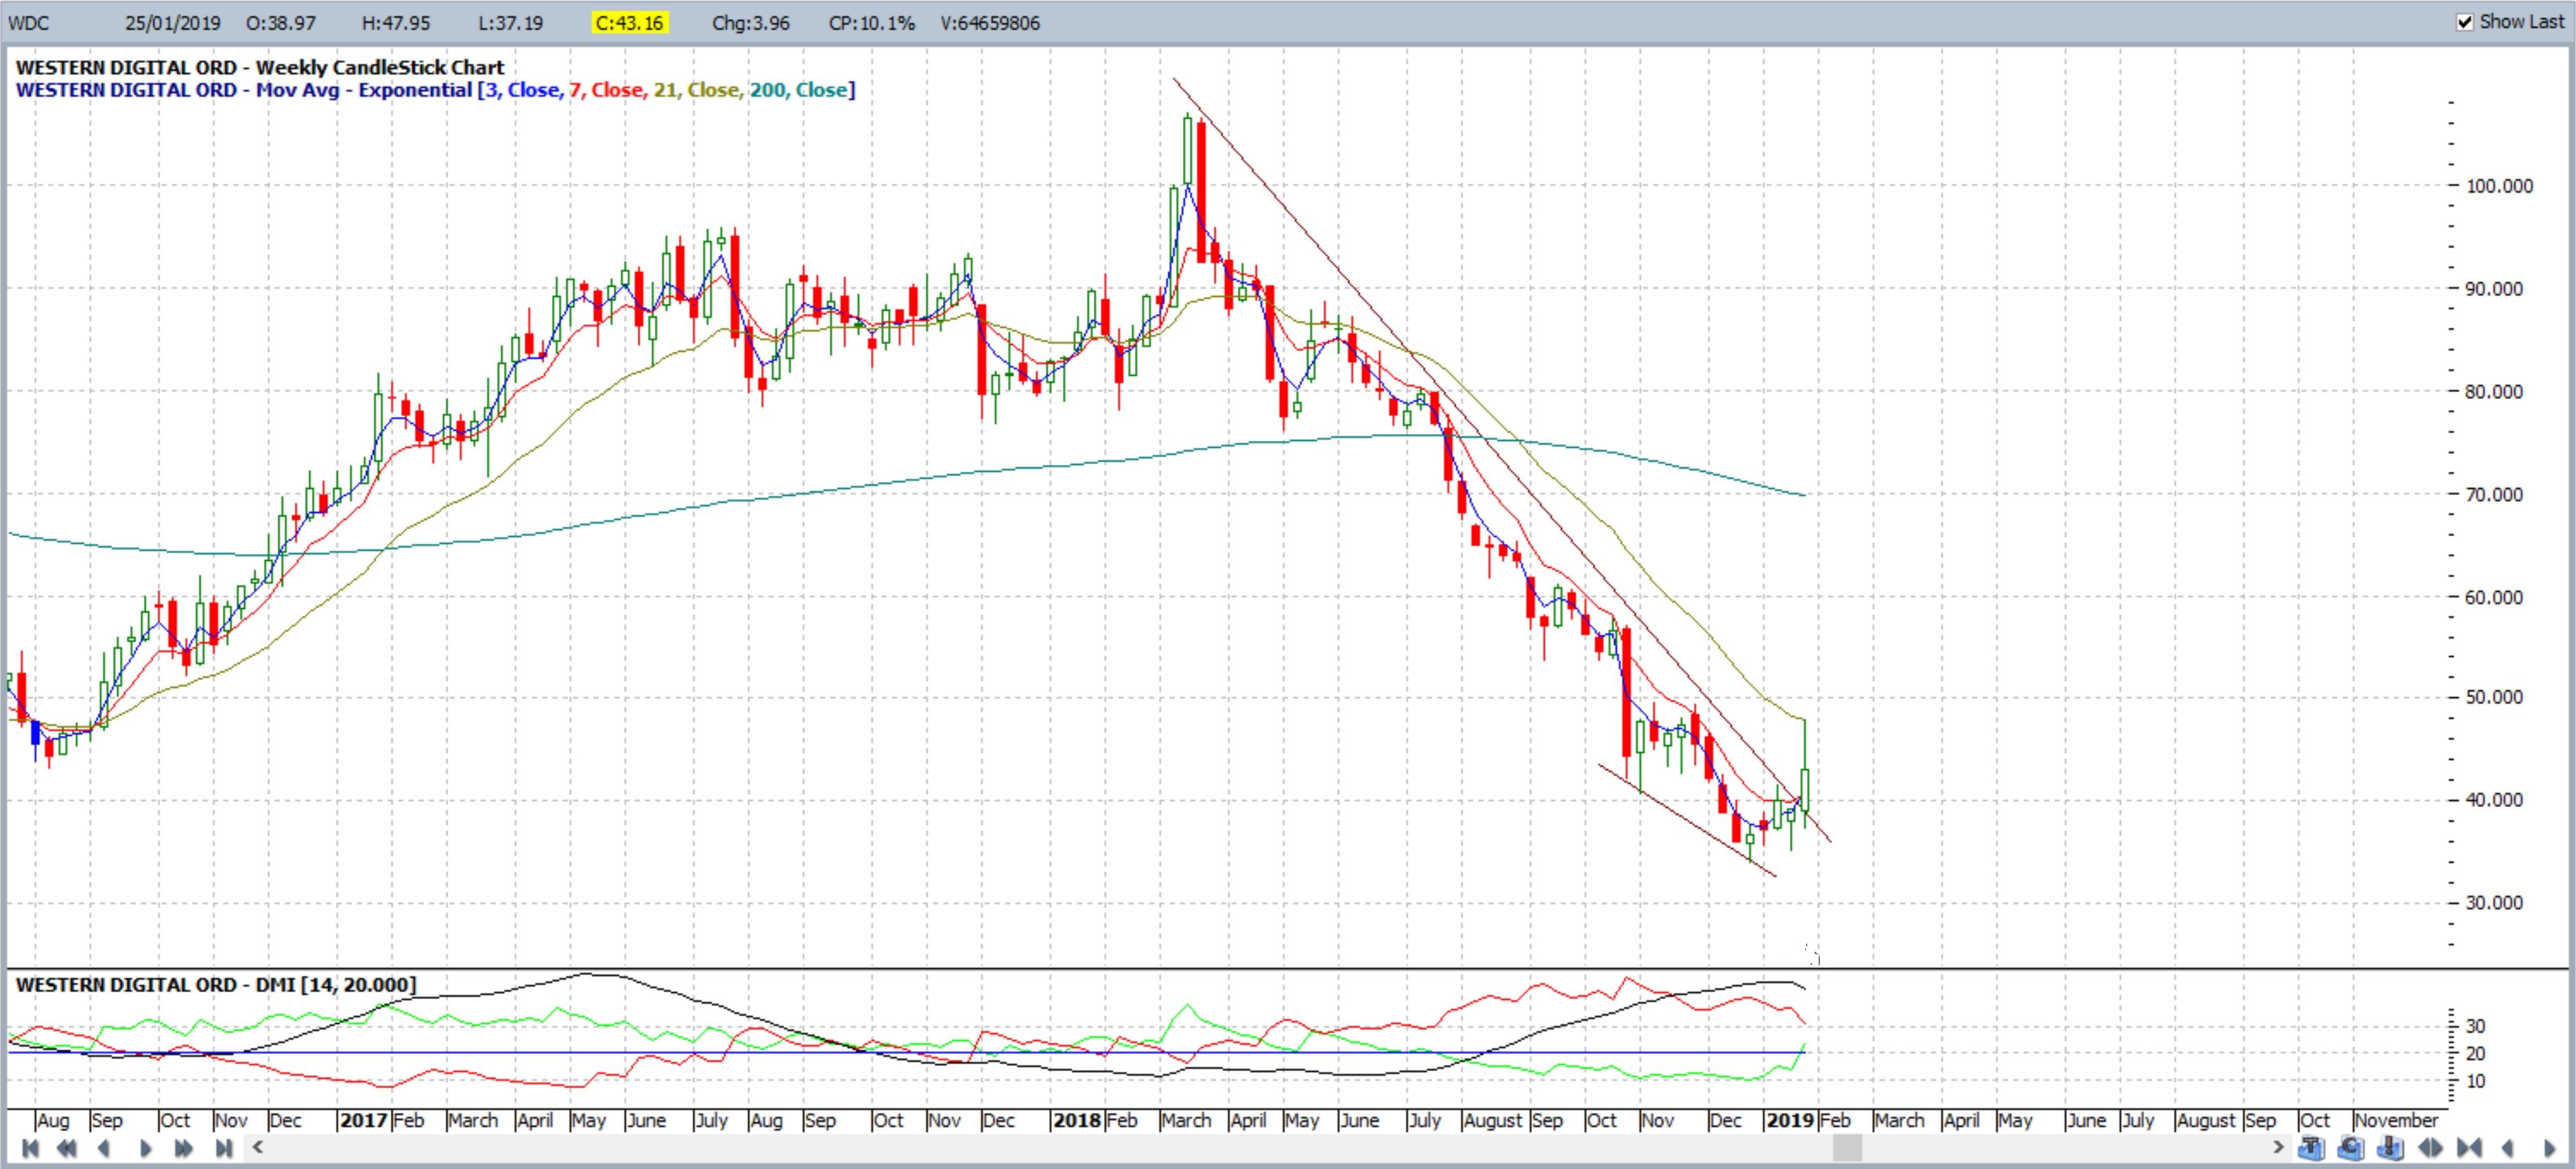
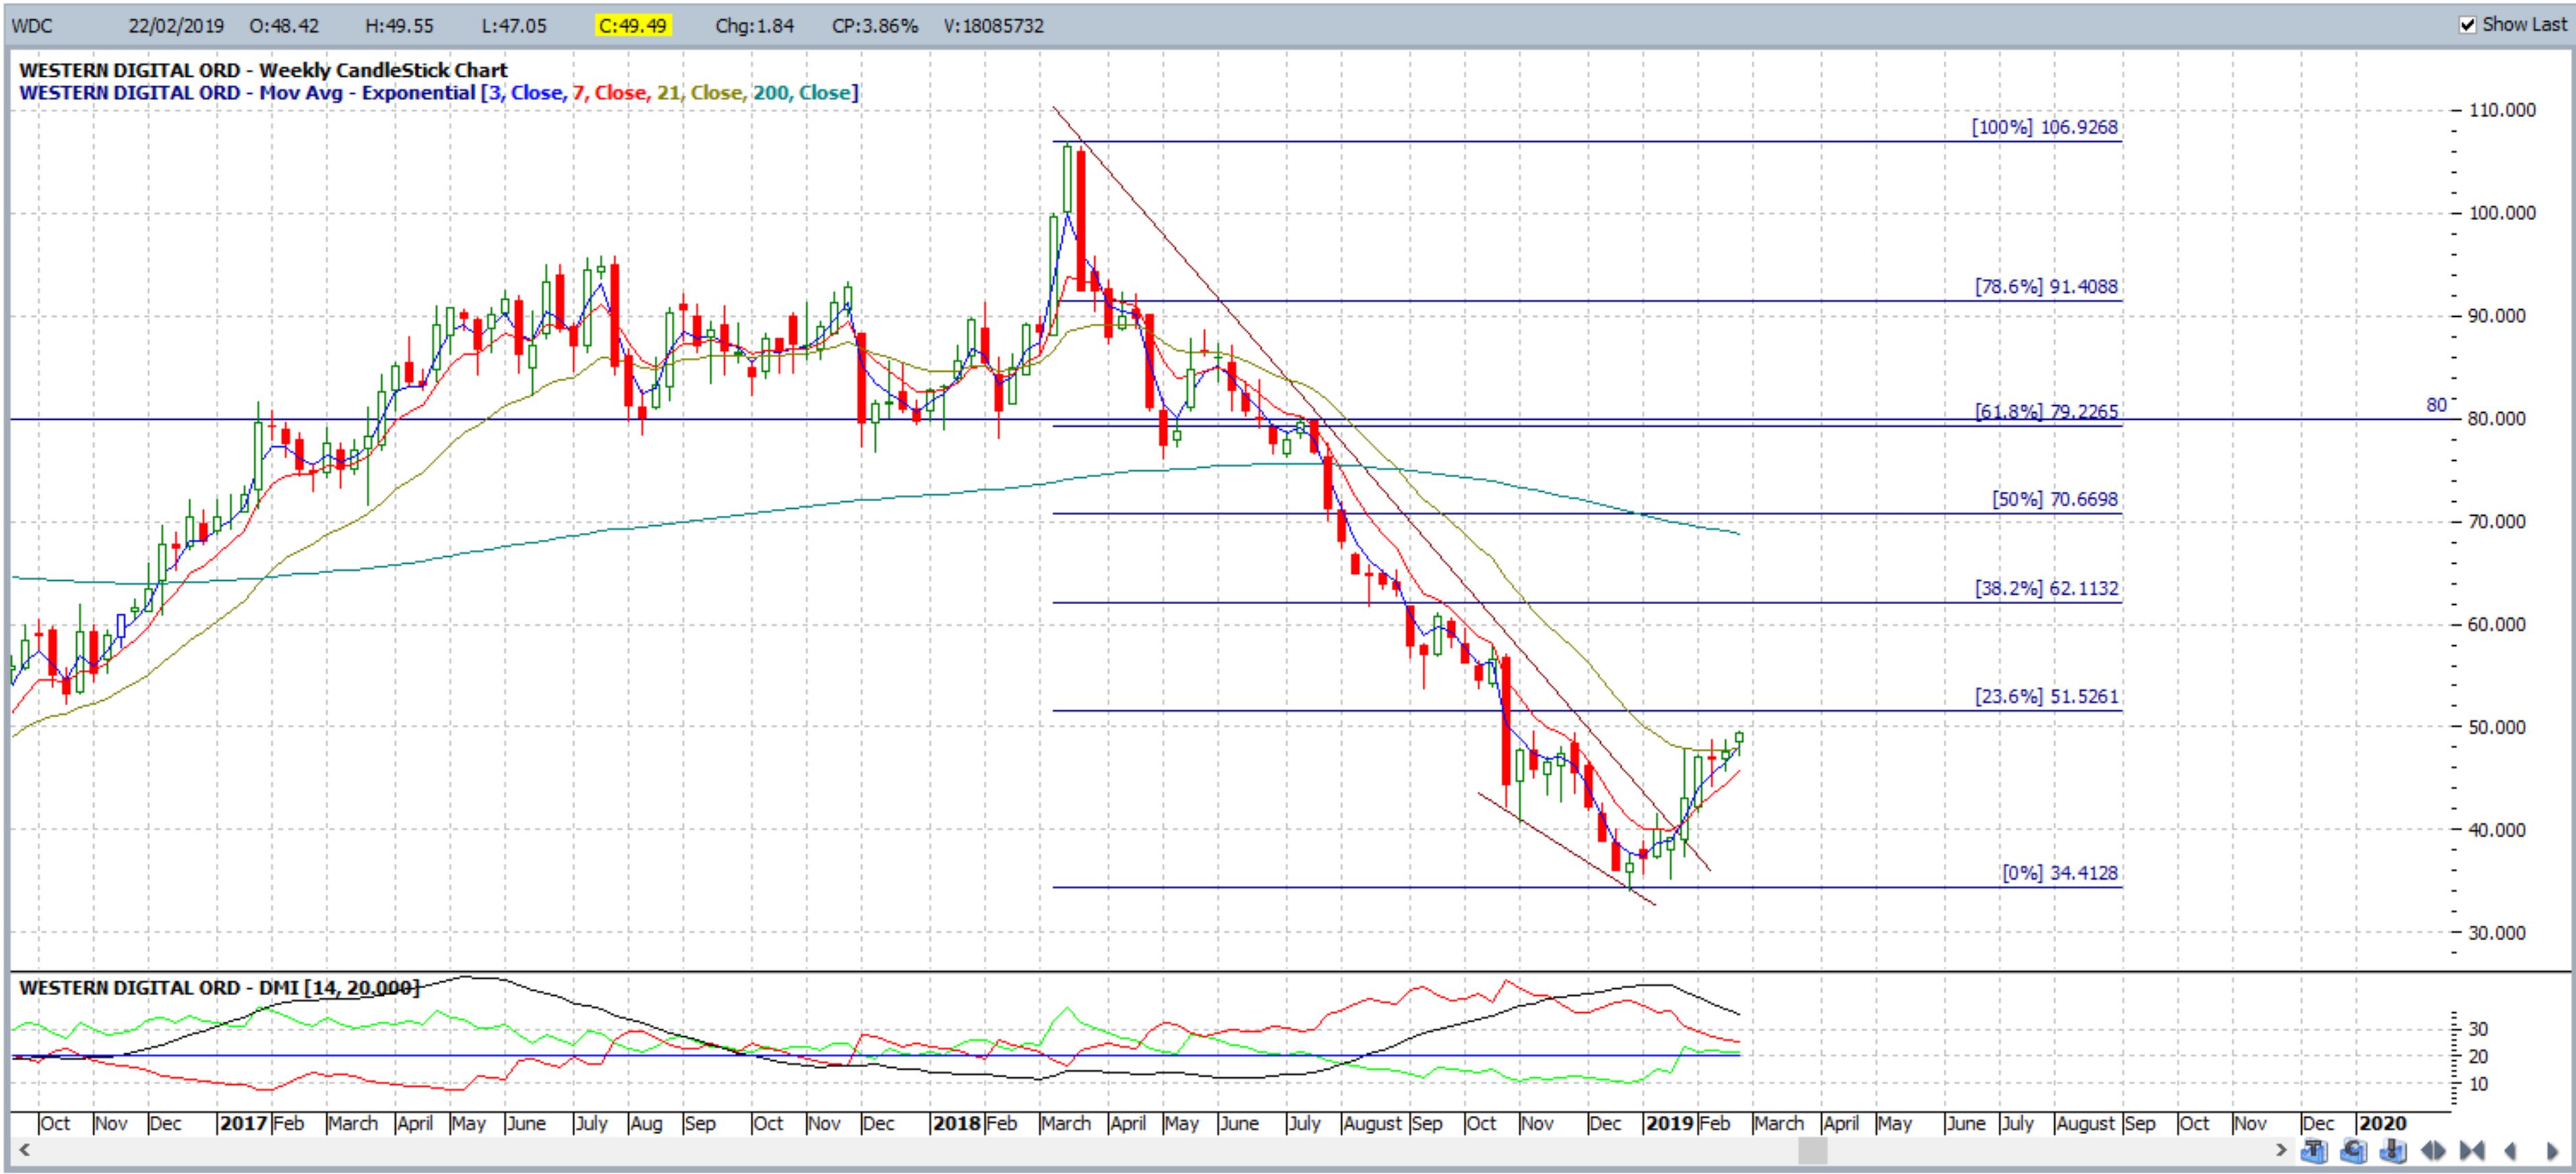
WDC weekly: Western Digital: February 2019: monitoring this new breakout:
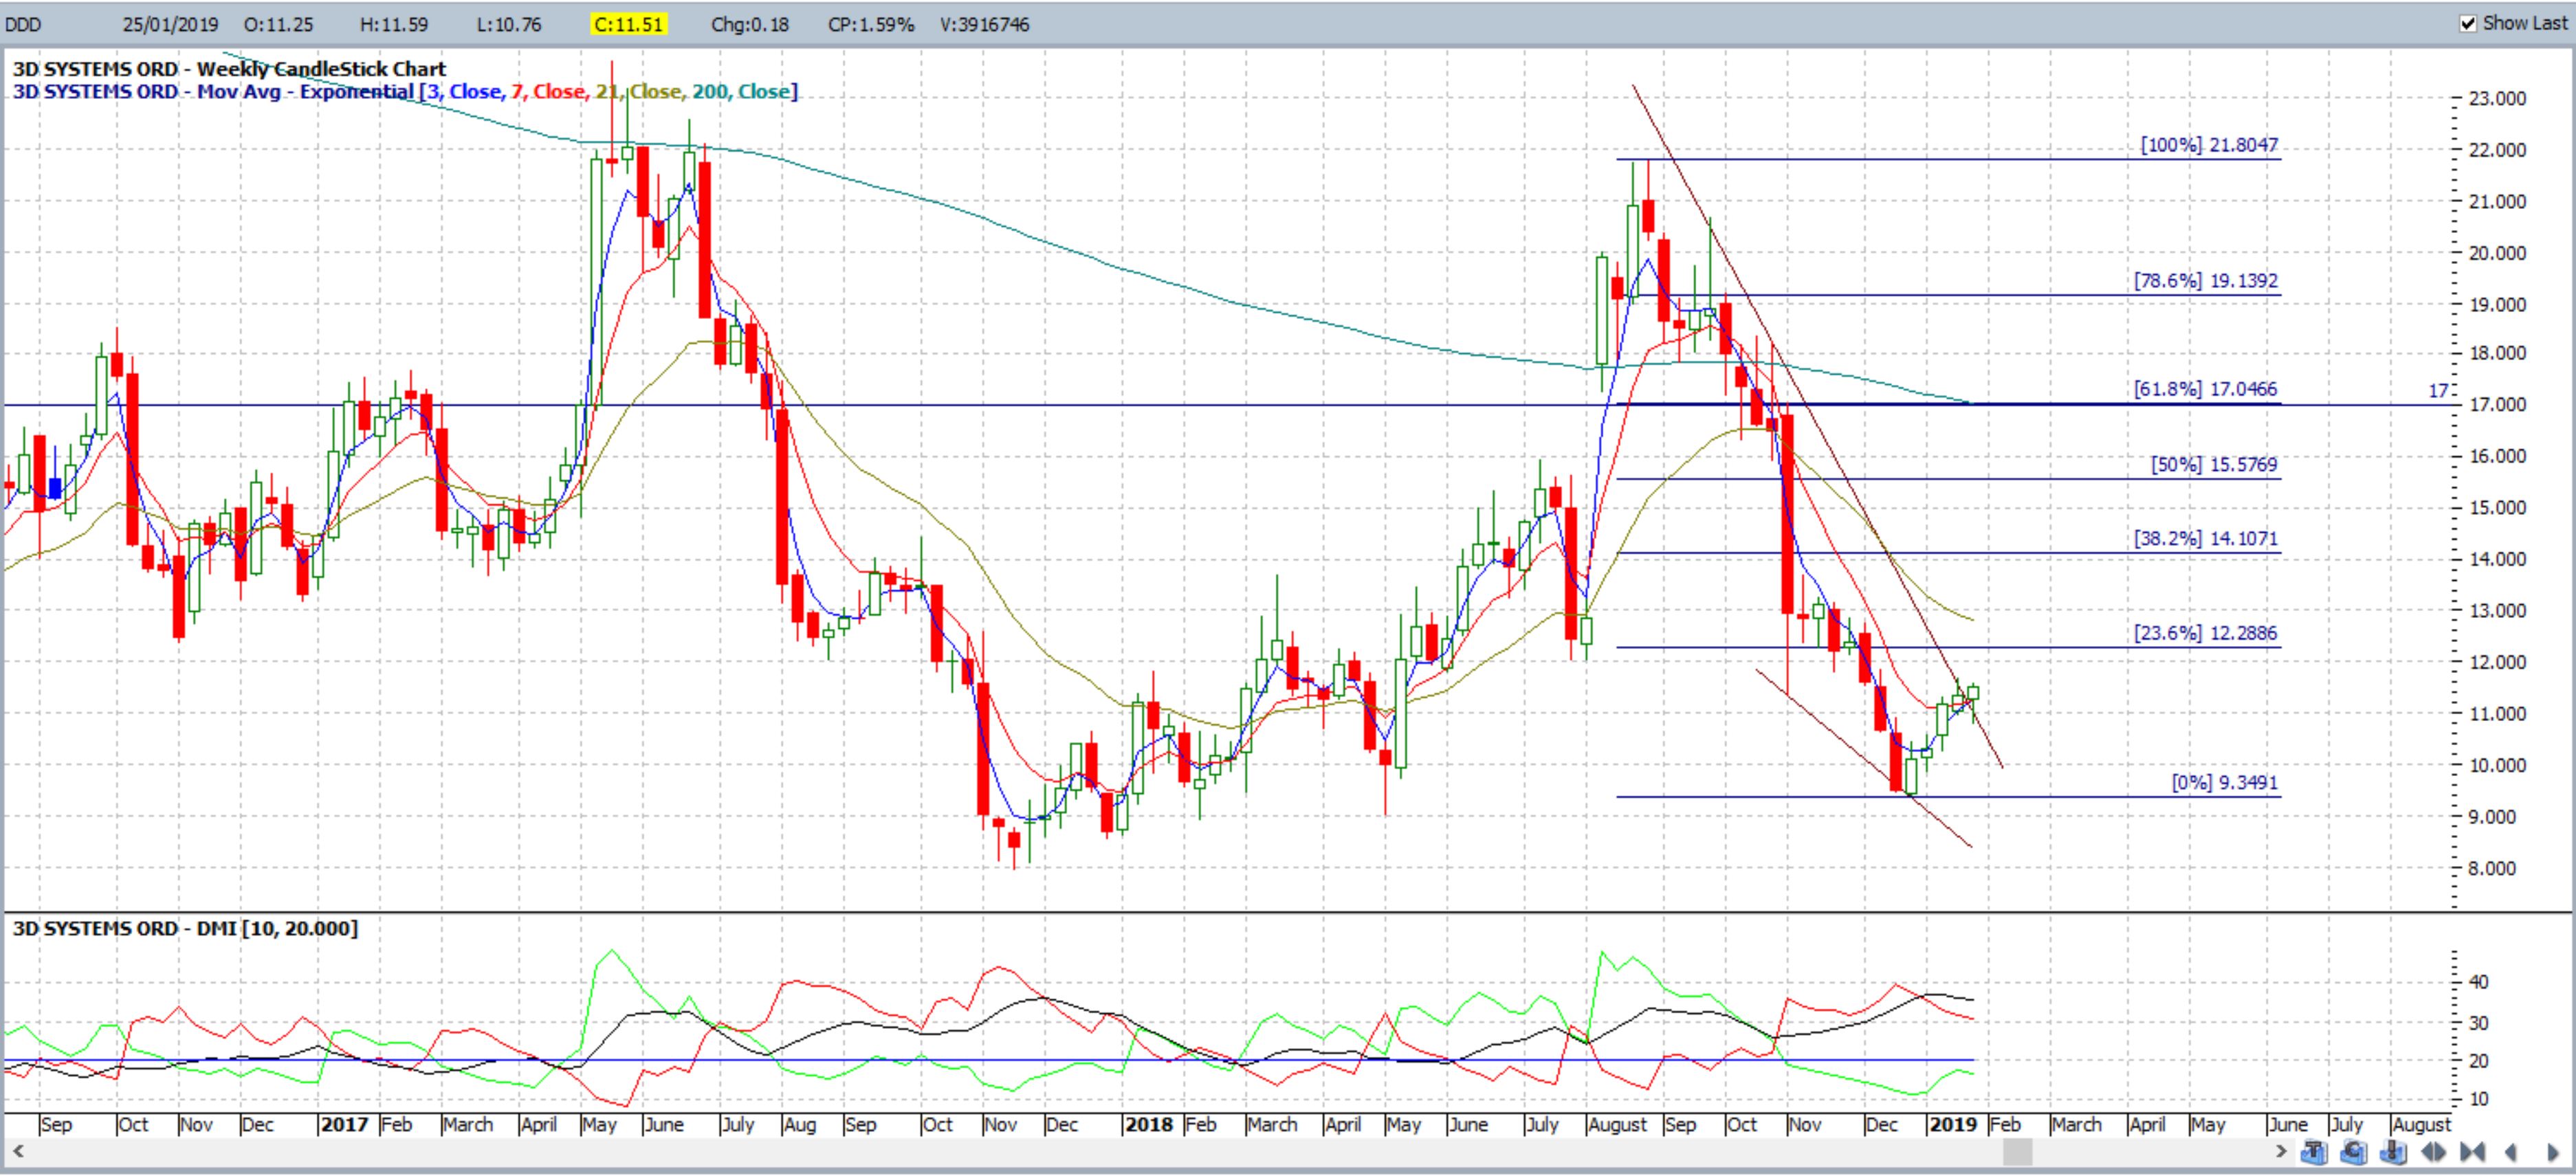
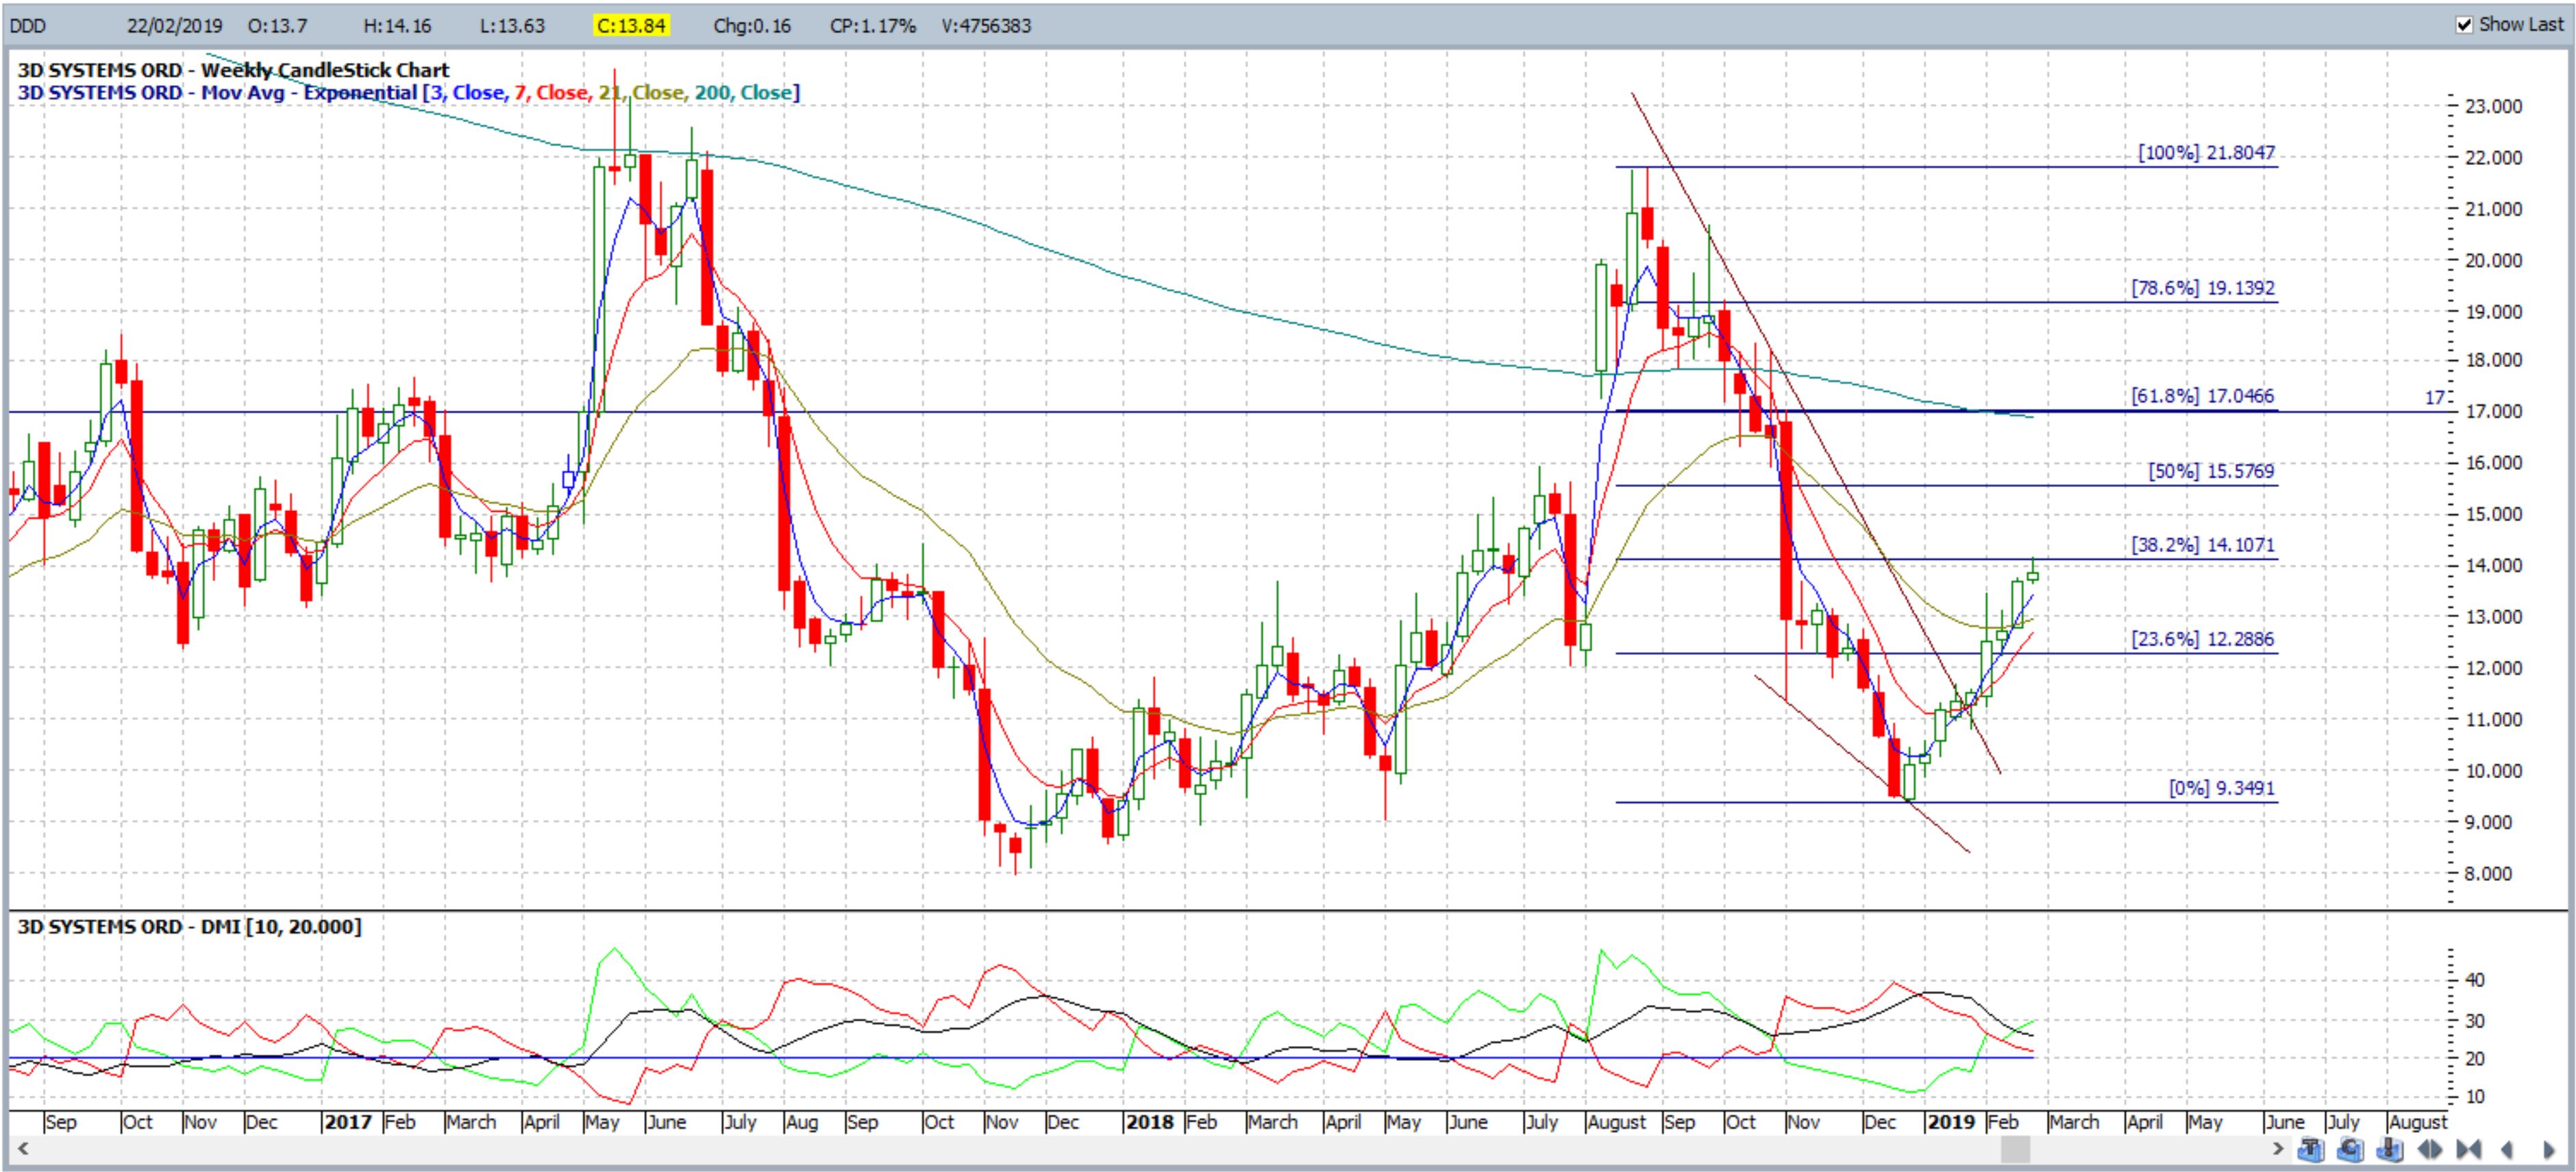
DDD weekly: 3D Systems: February 2019: the target here is $17:
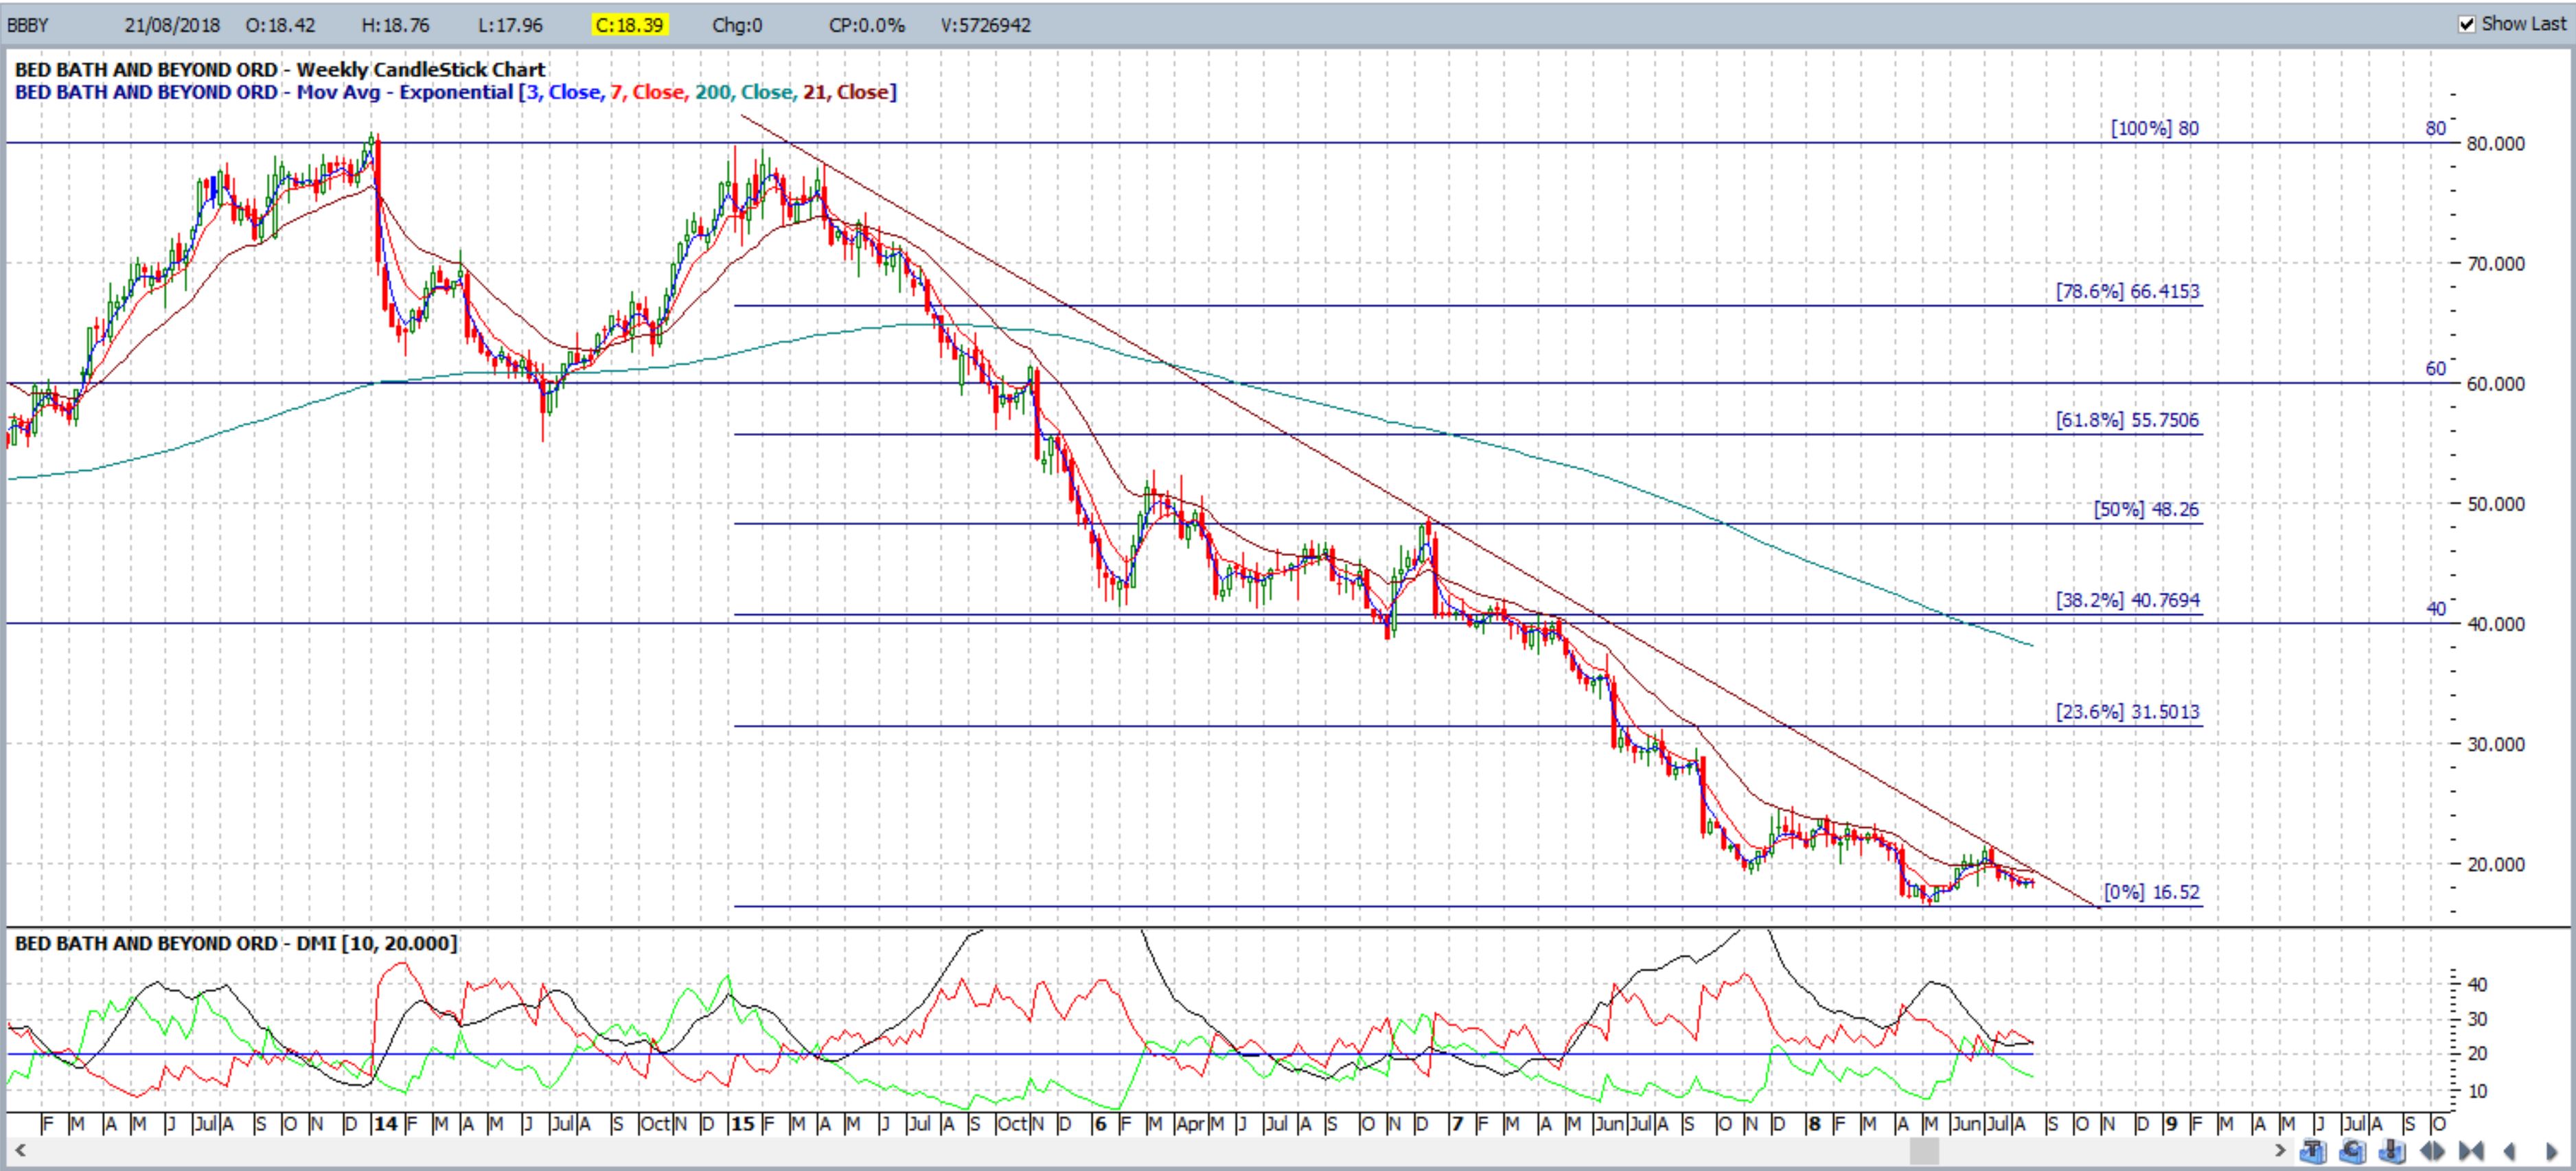
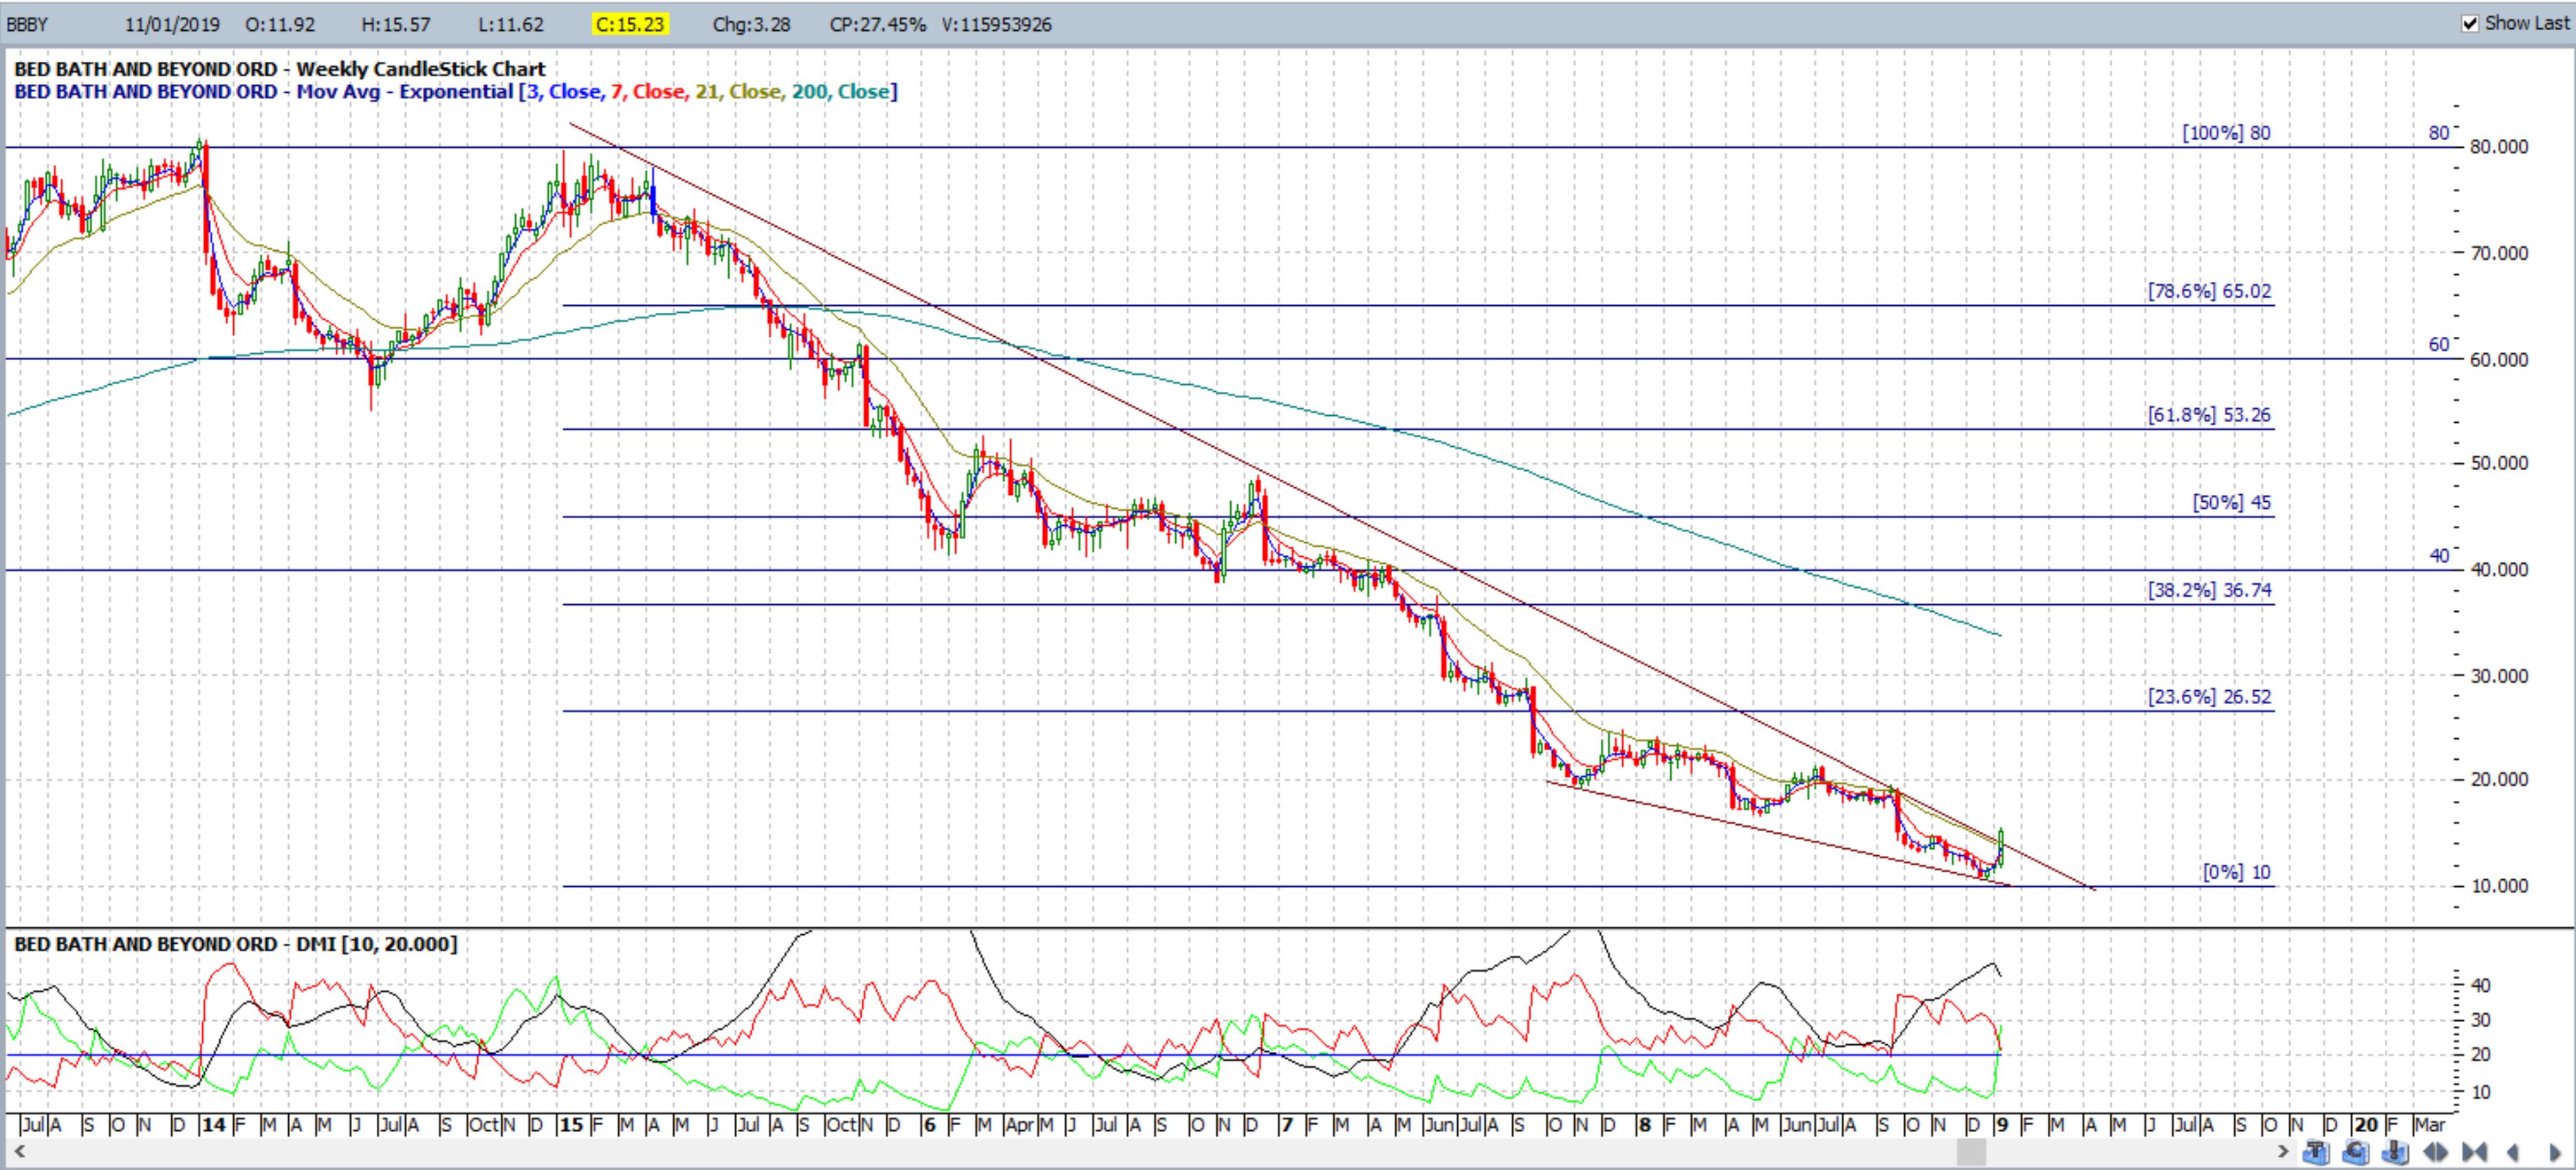
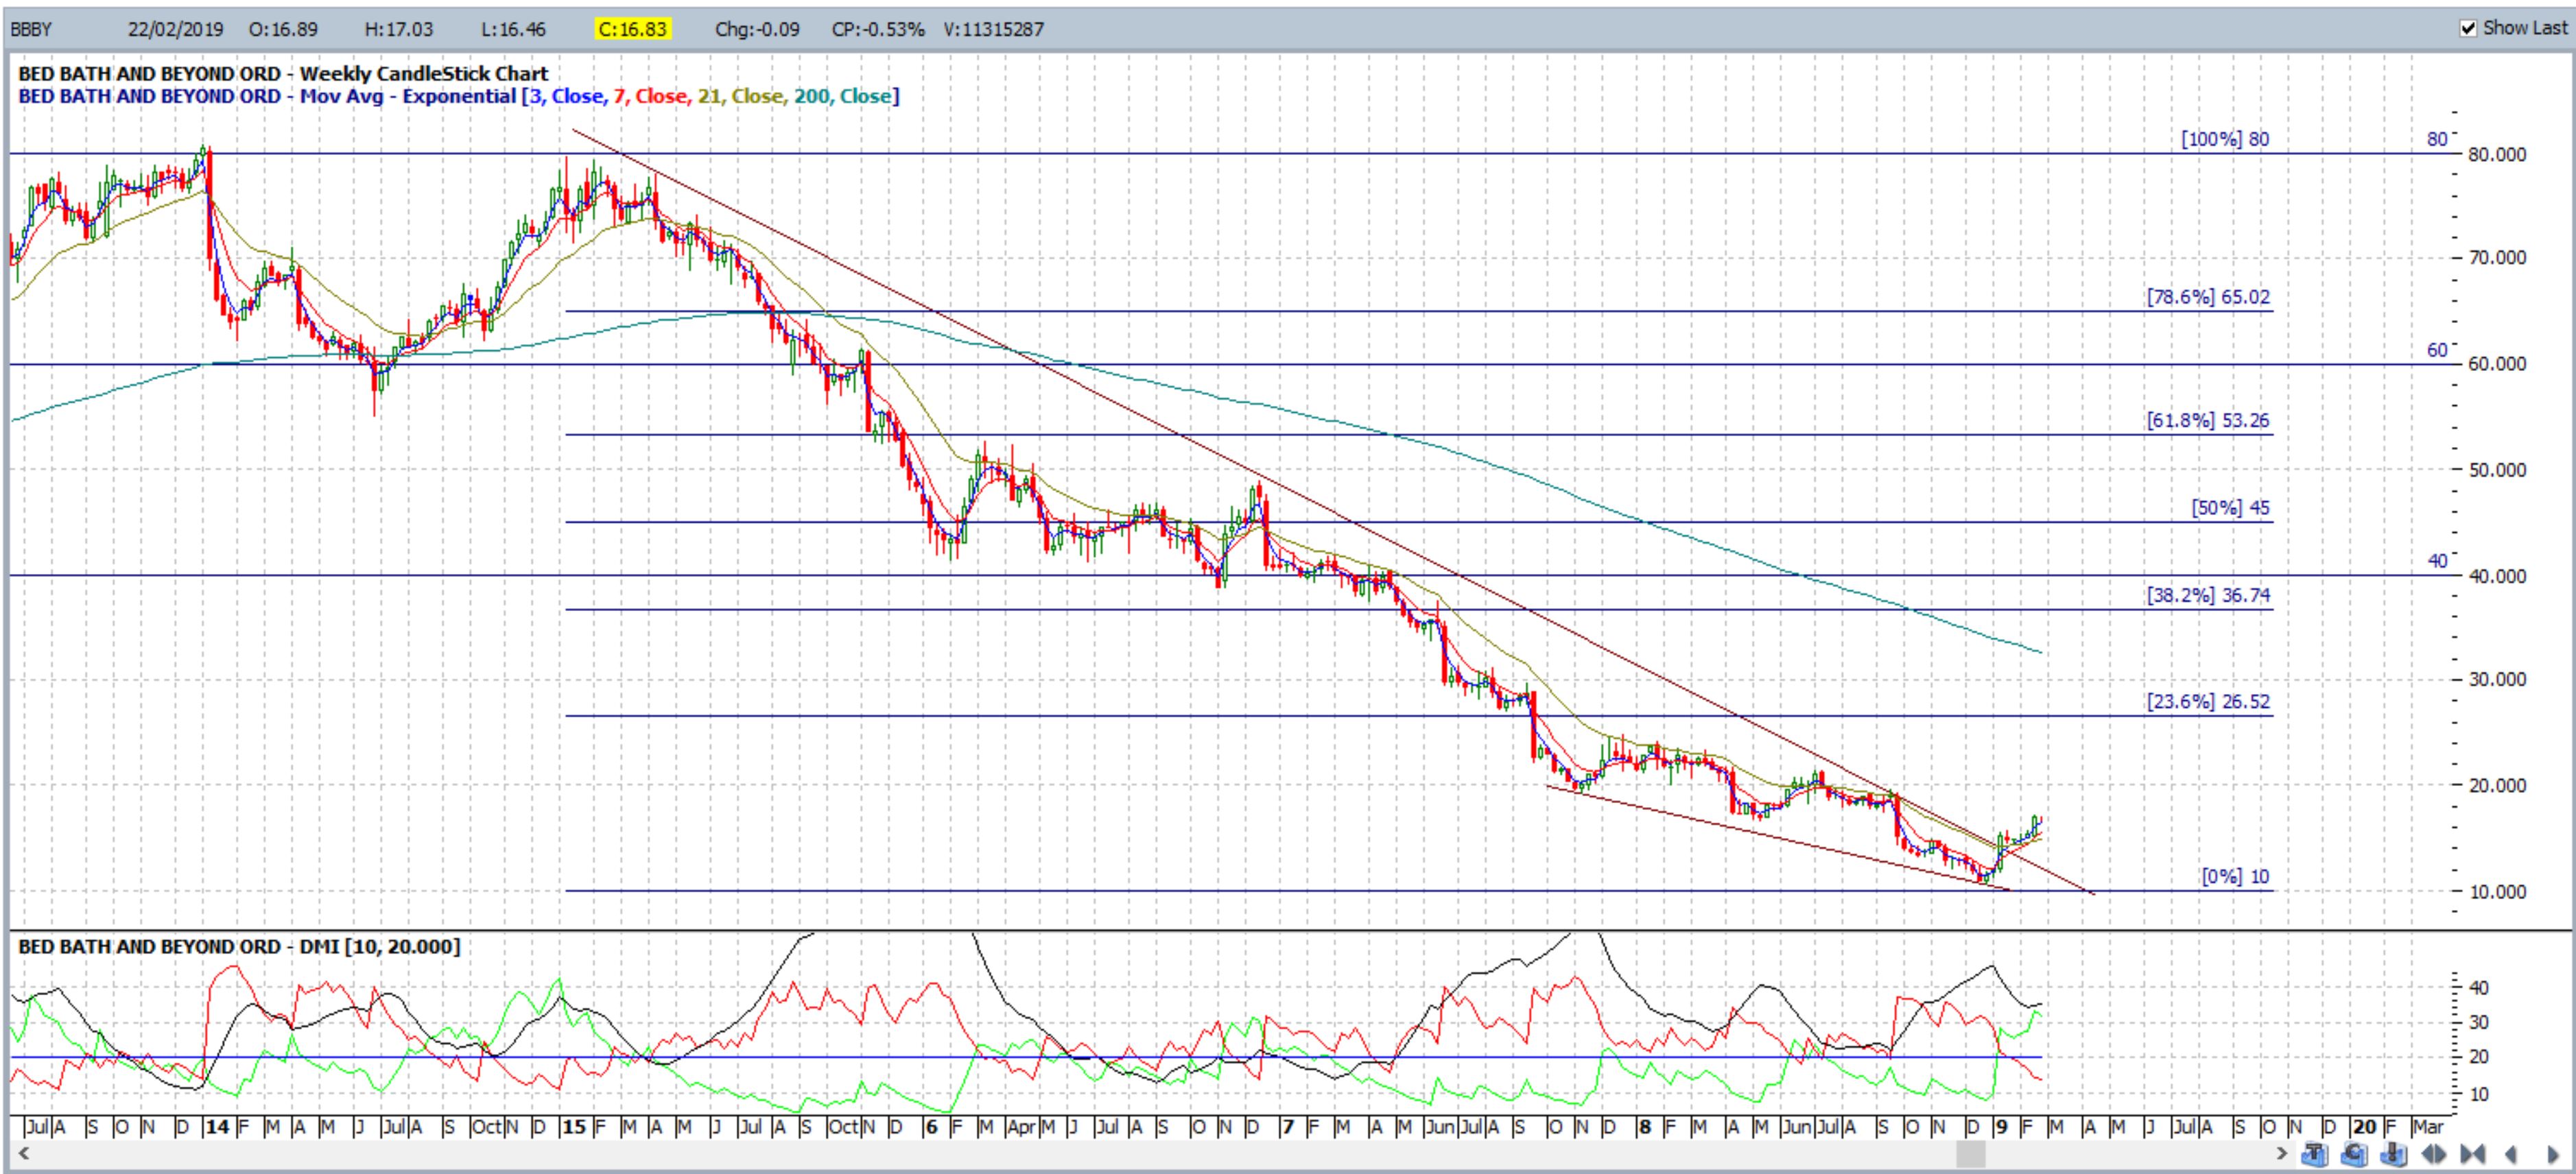
BBBY weekly: Bed, Bath Table and Beyond: February 2019: this is a very new breakout that I am tracking:
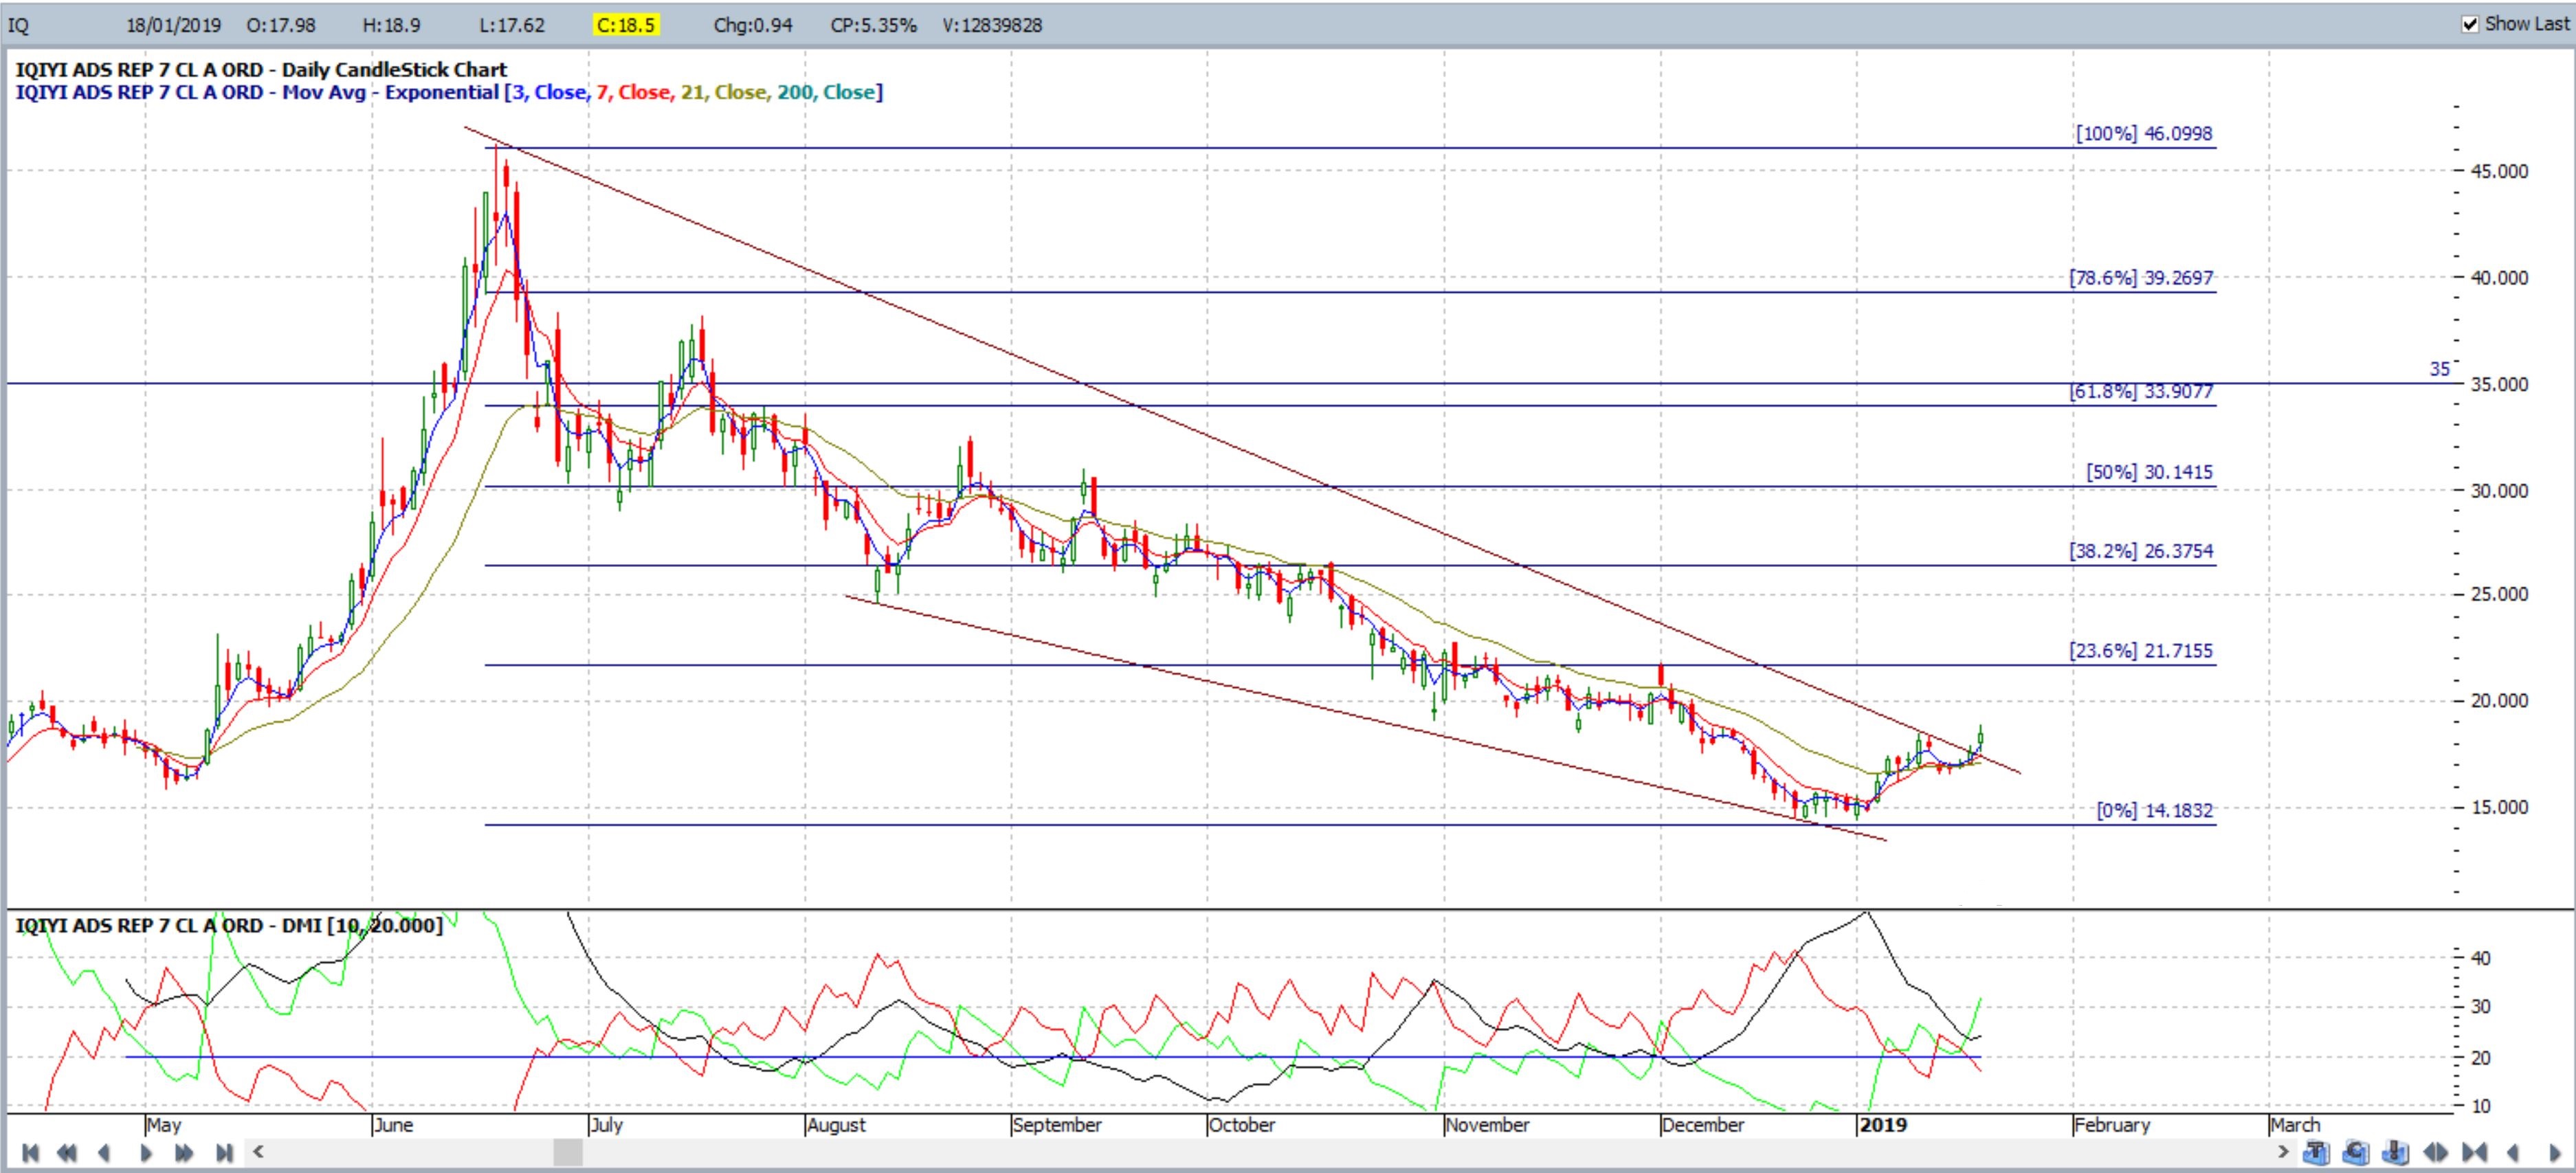
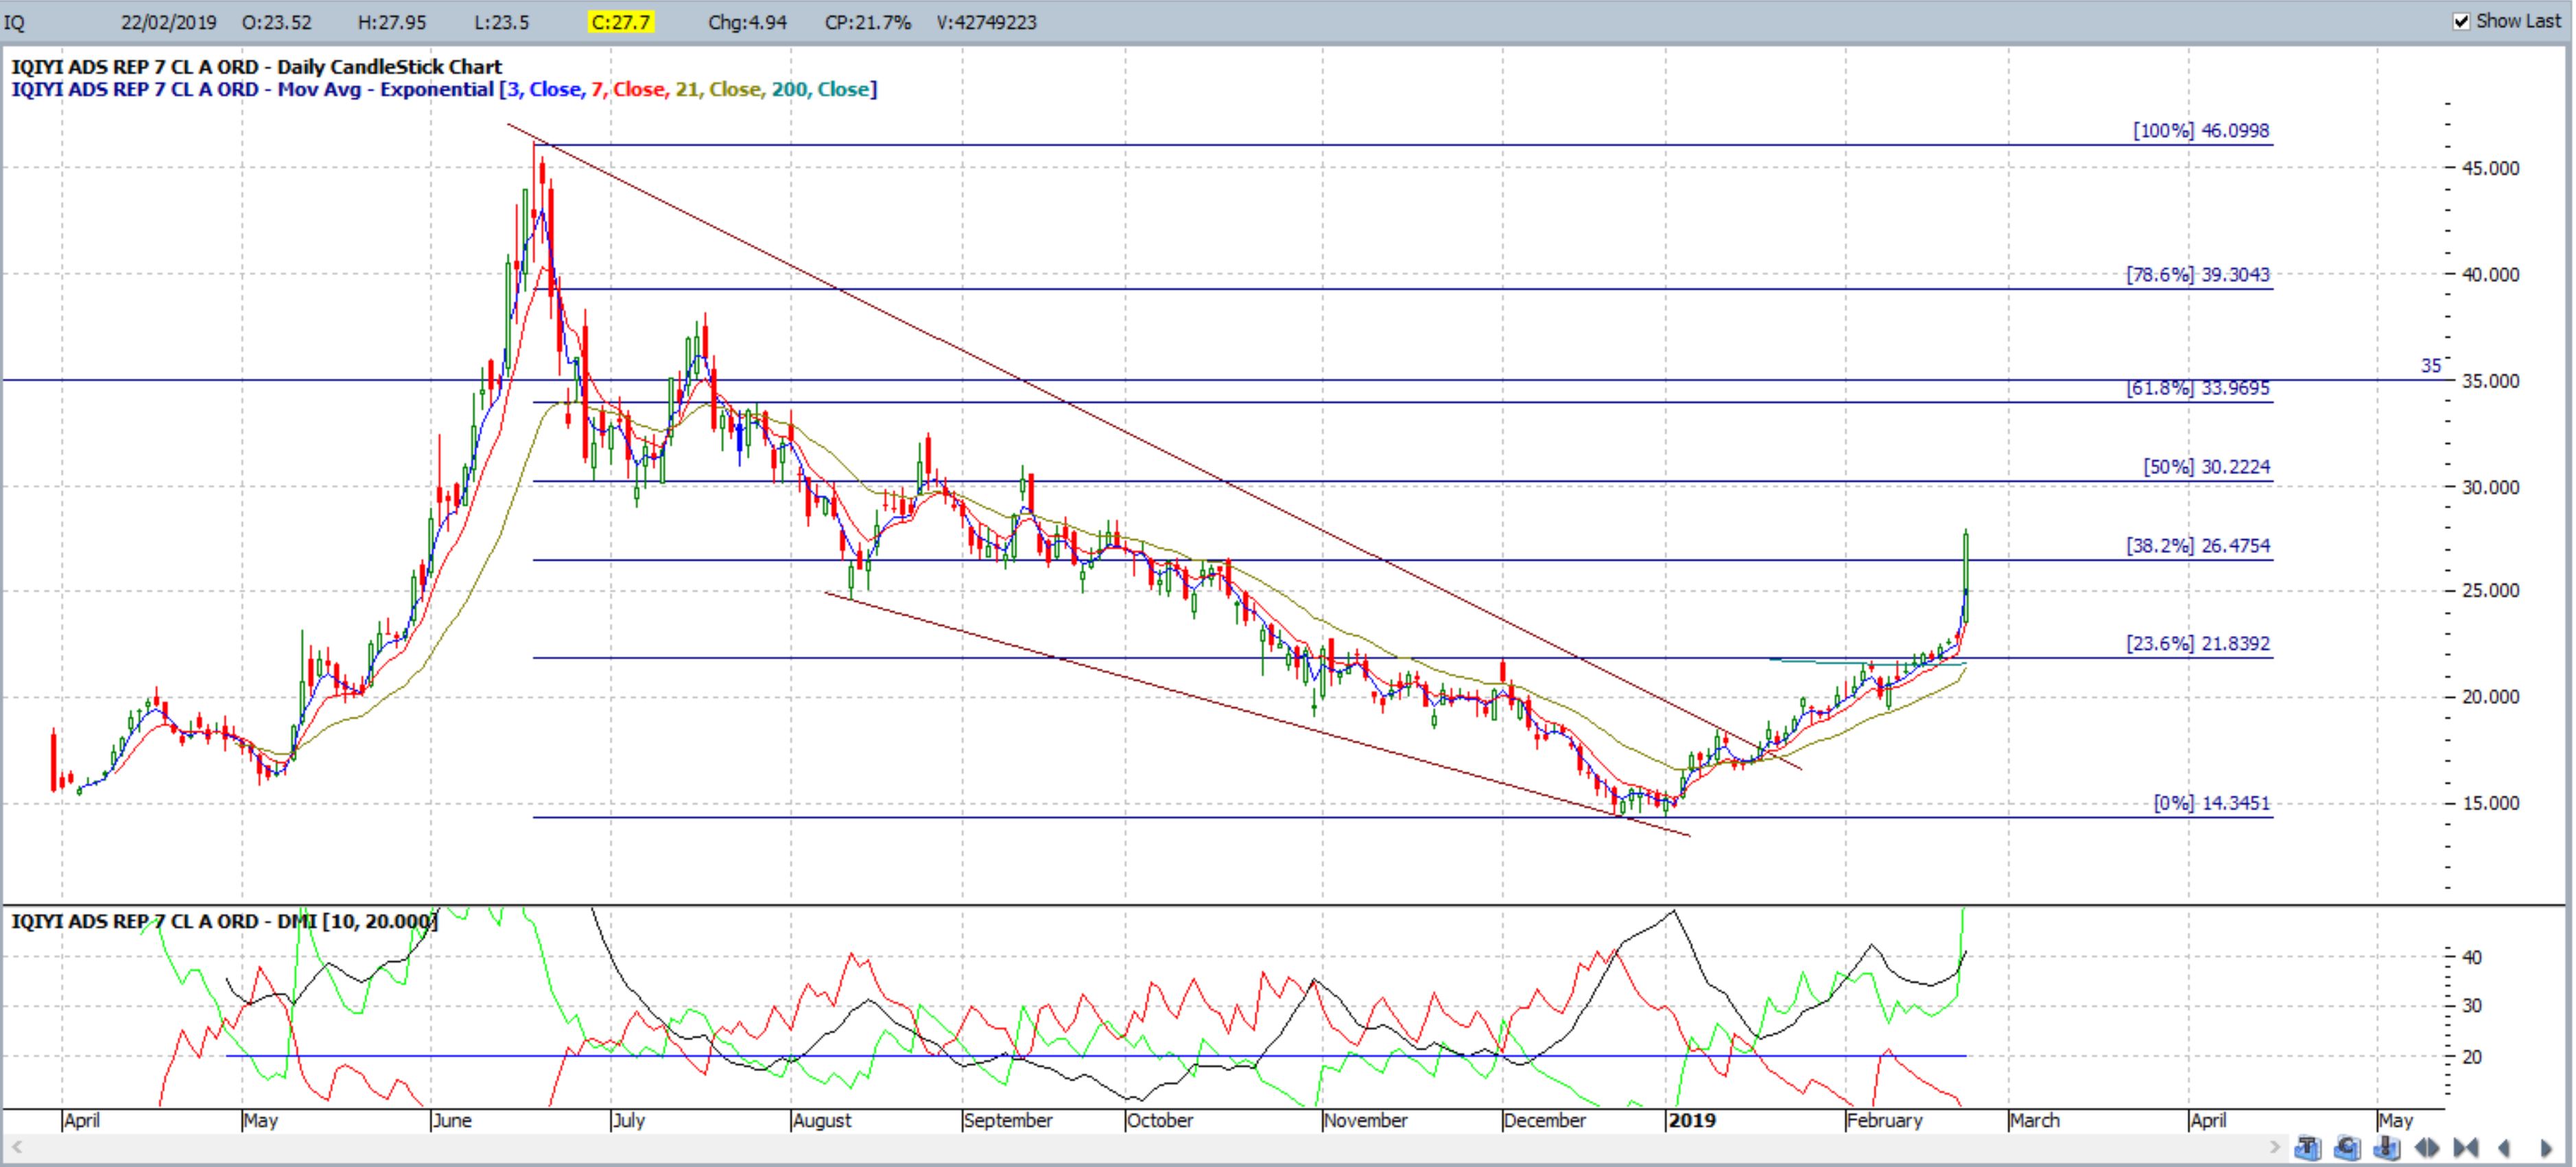
IQ daily: February 2019: this moved rather quickly:
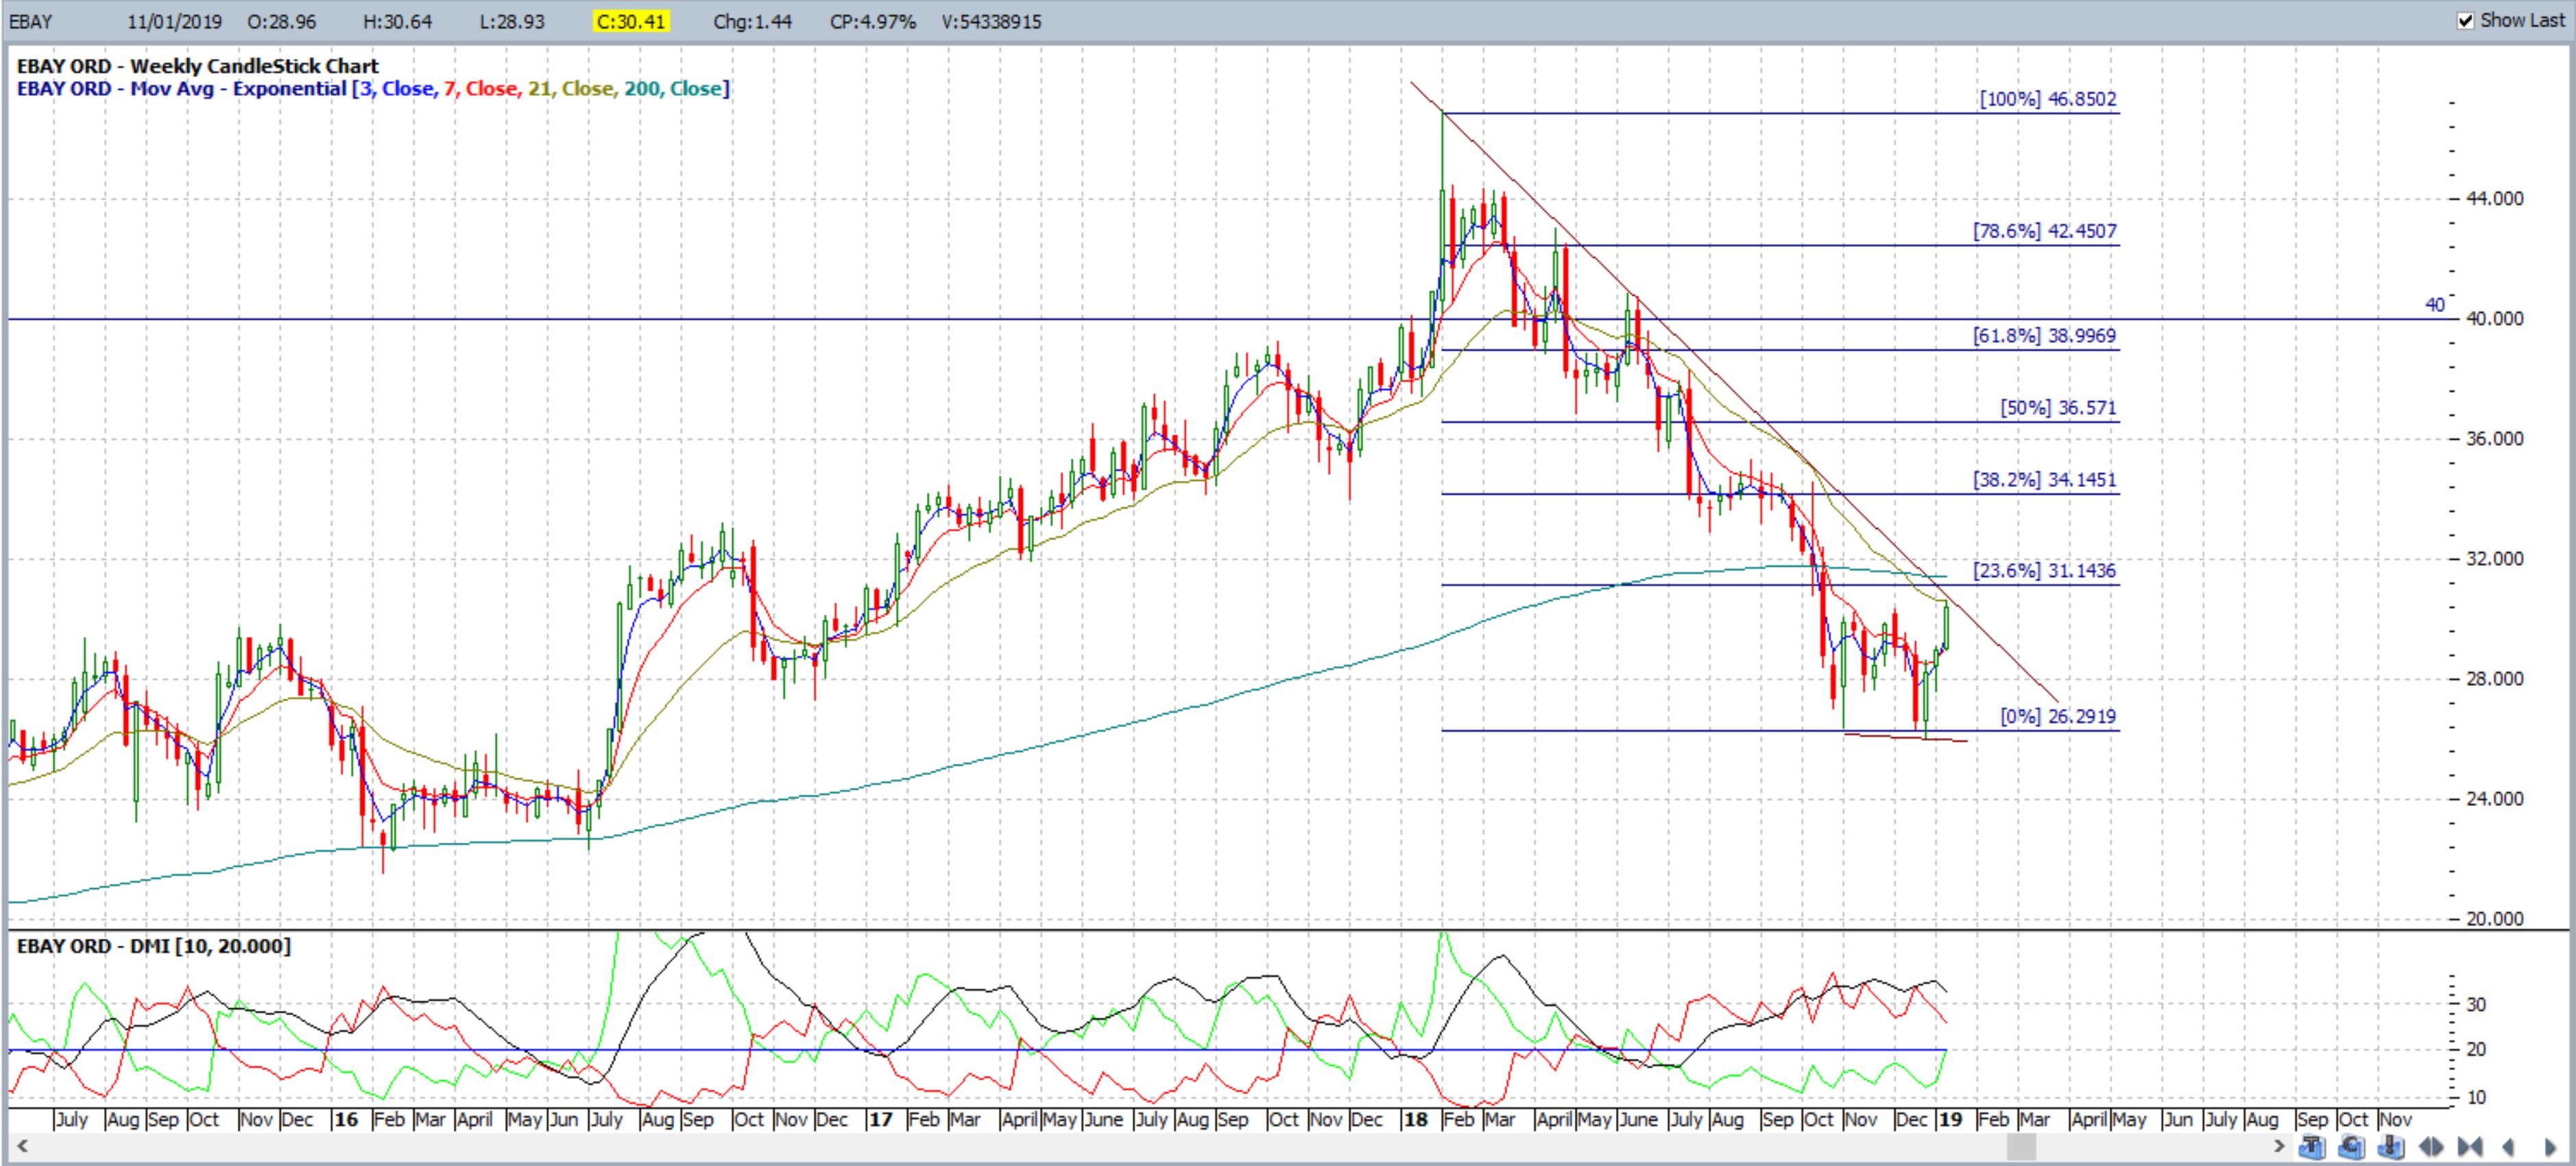
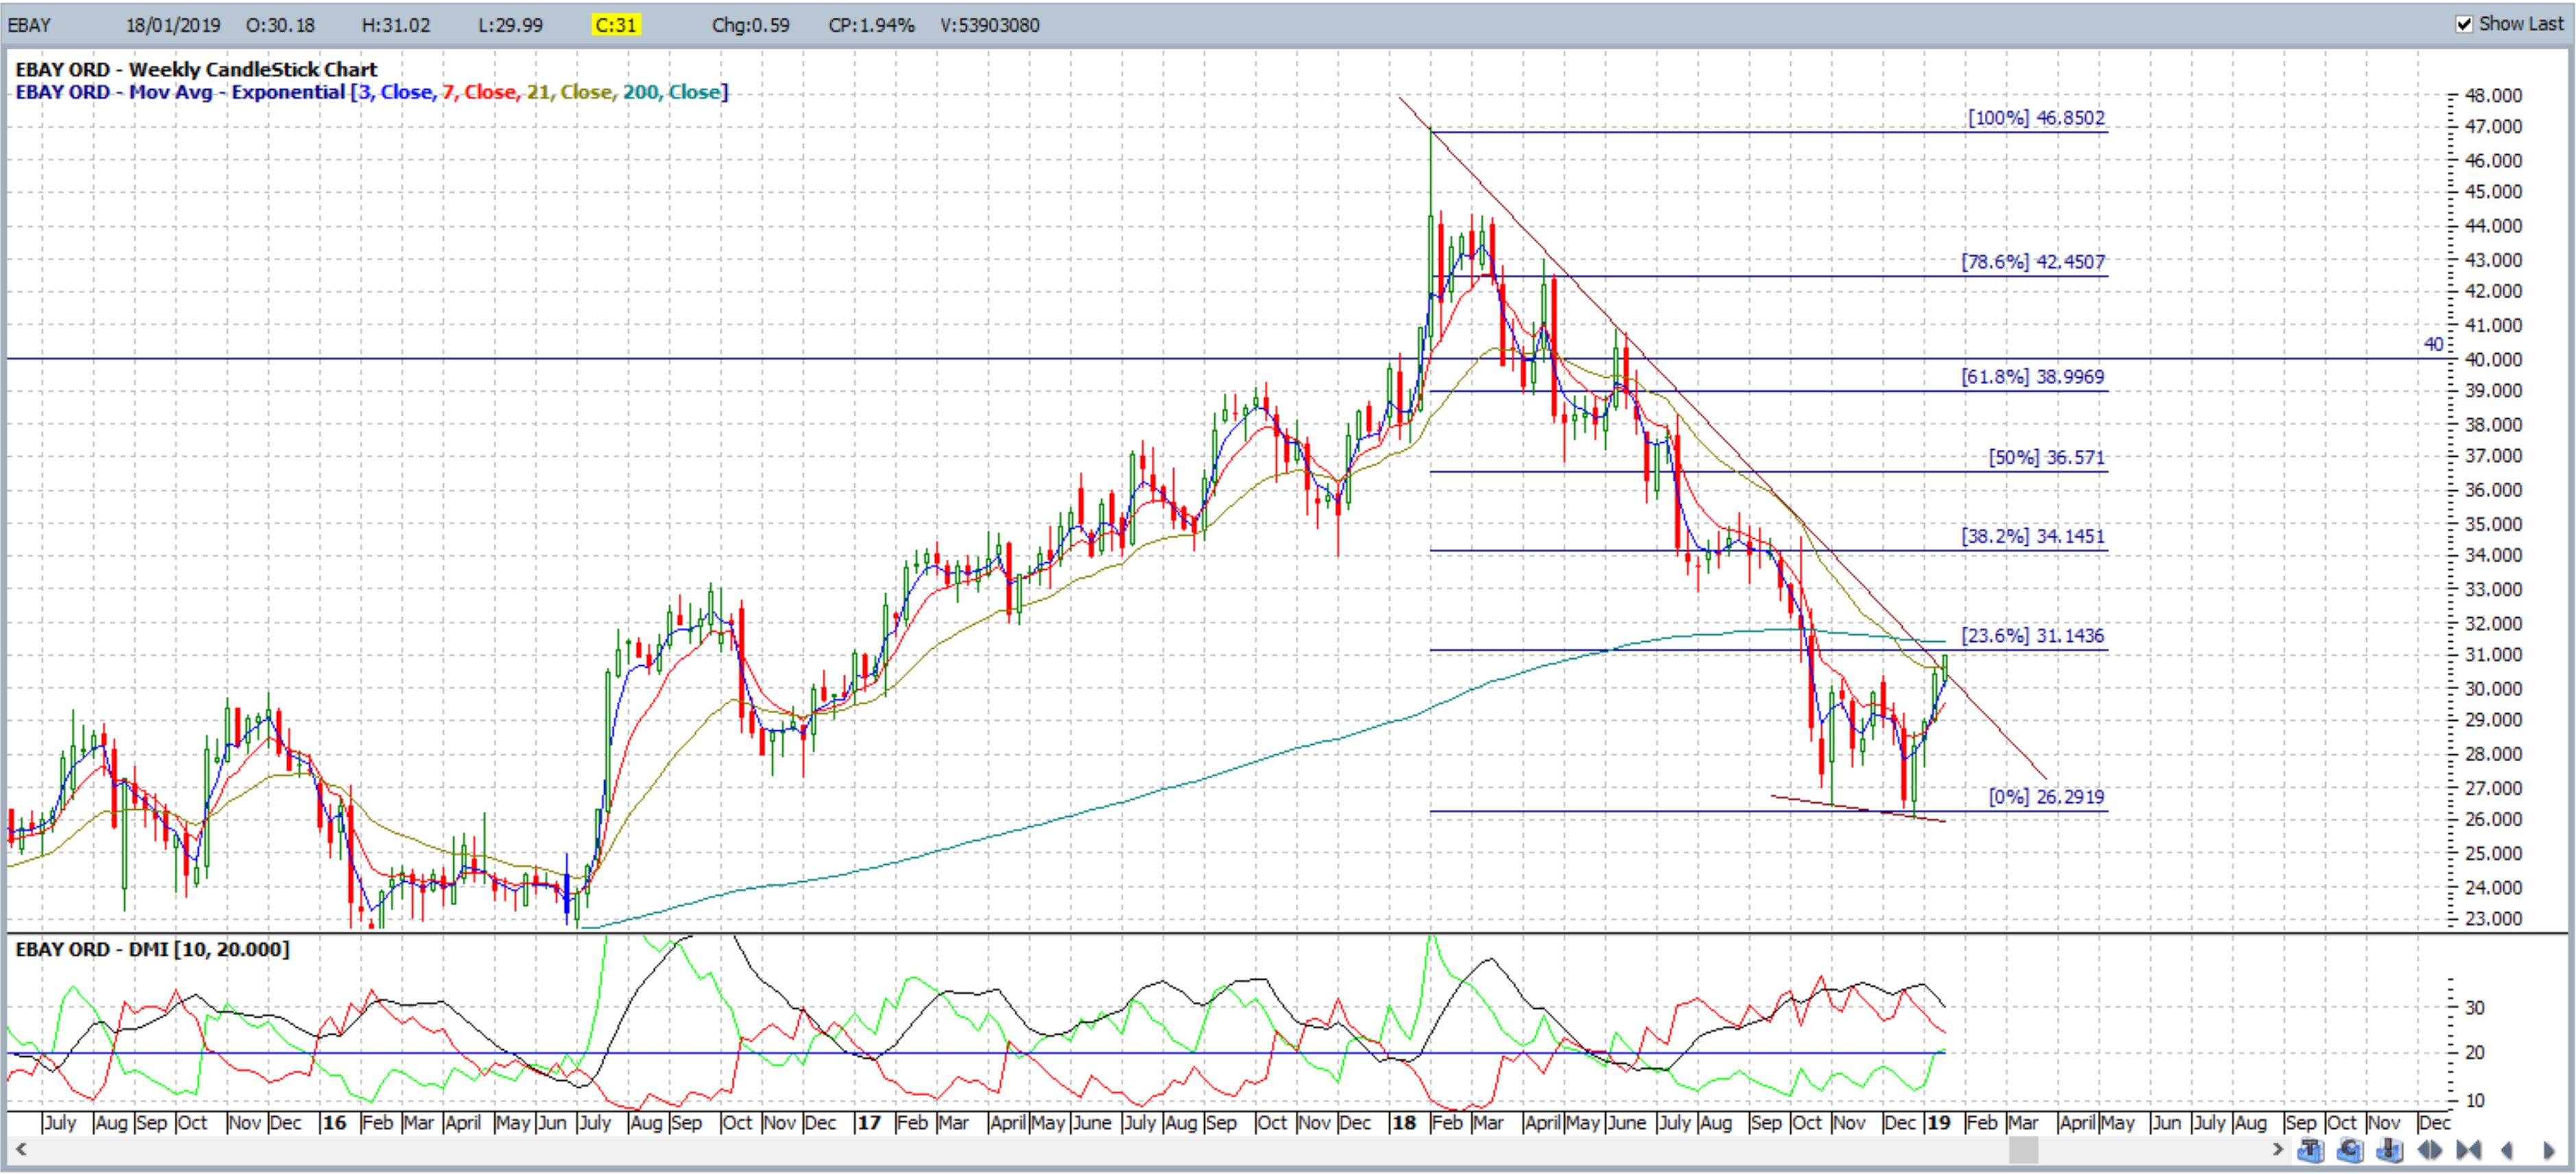
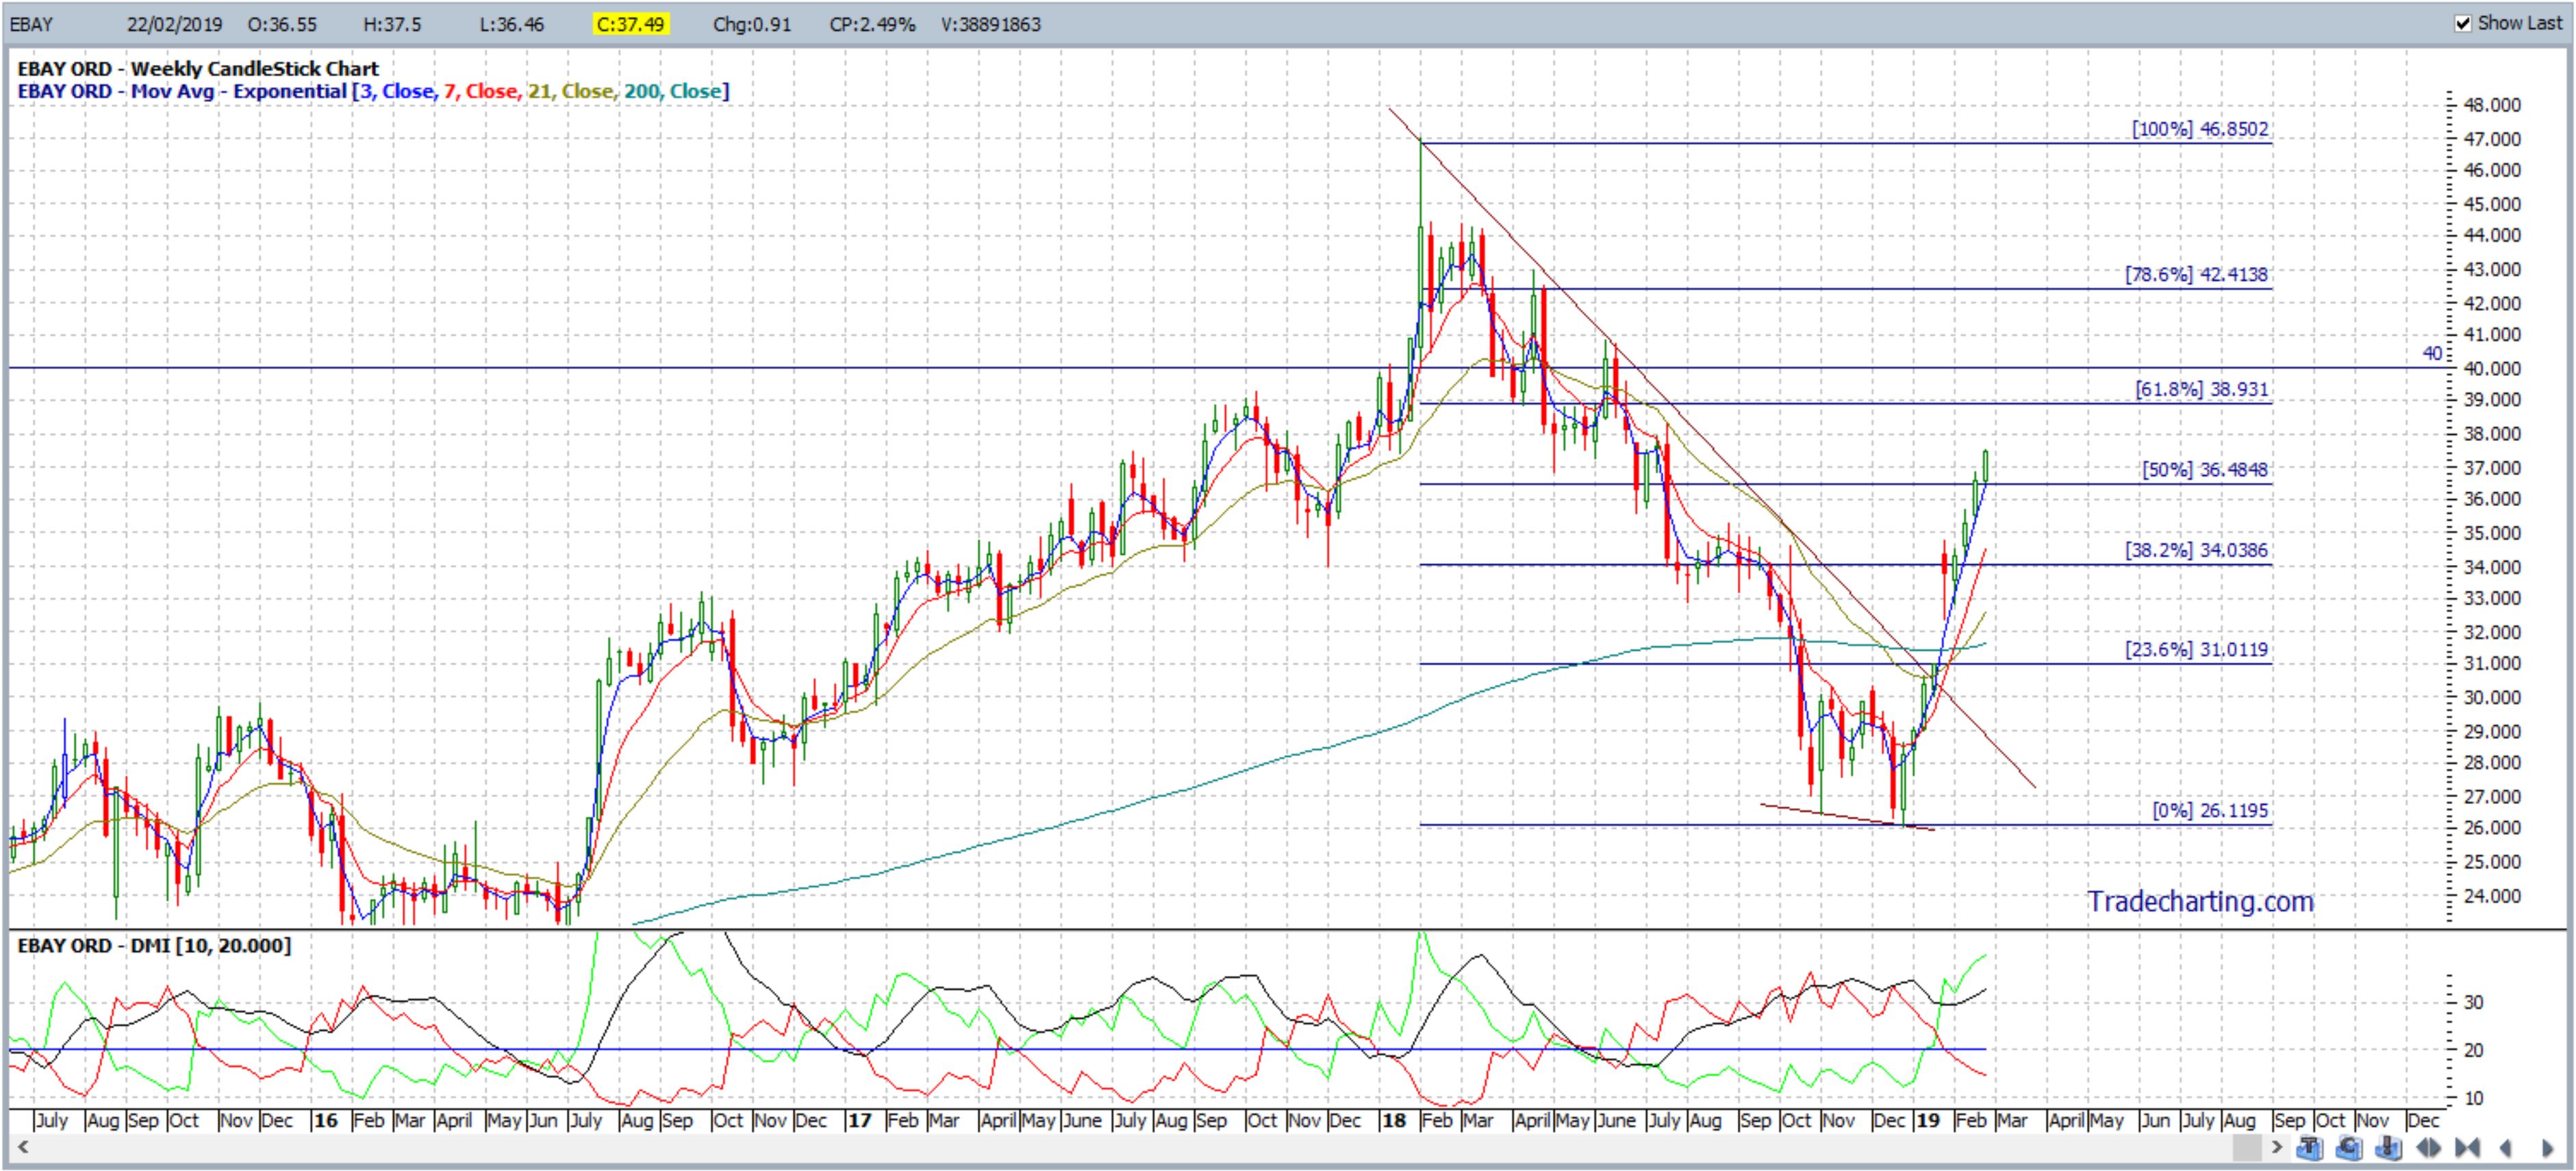
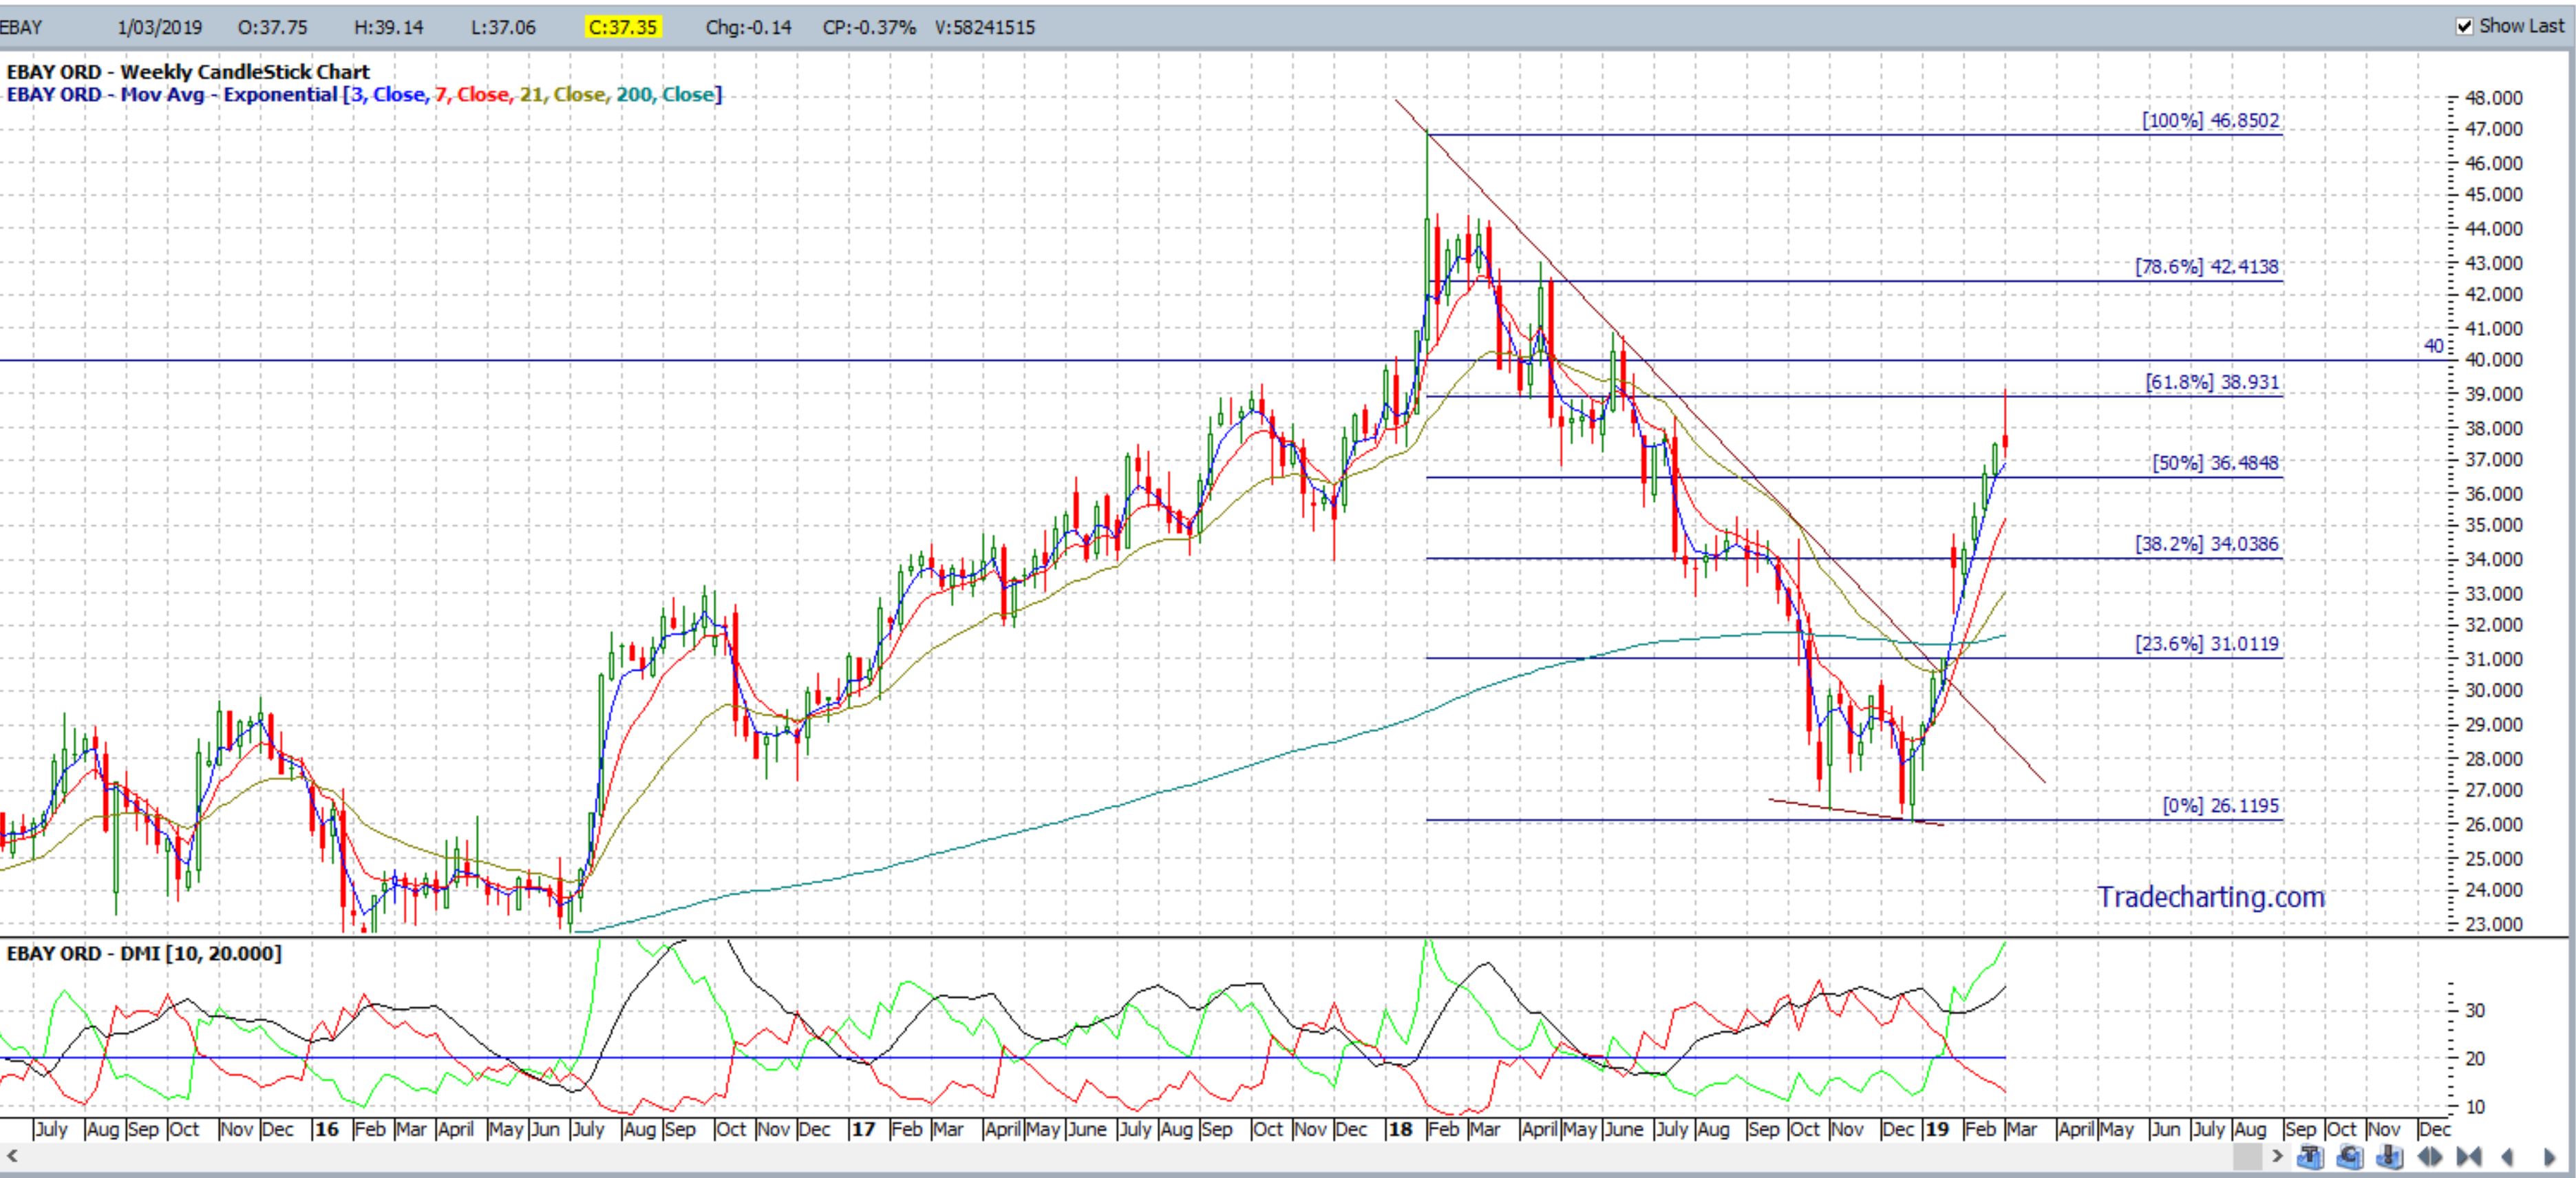
EBAY weekly: February 2019: this breakout has worked rather well and completed by the end of February:
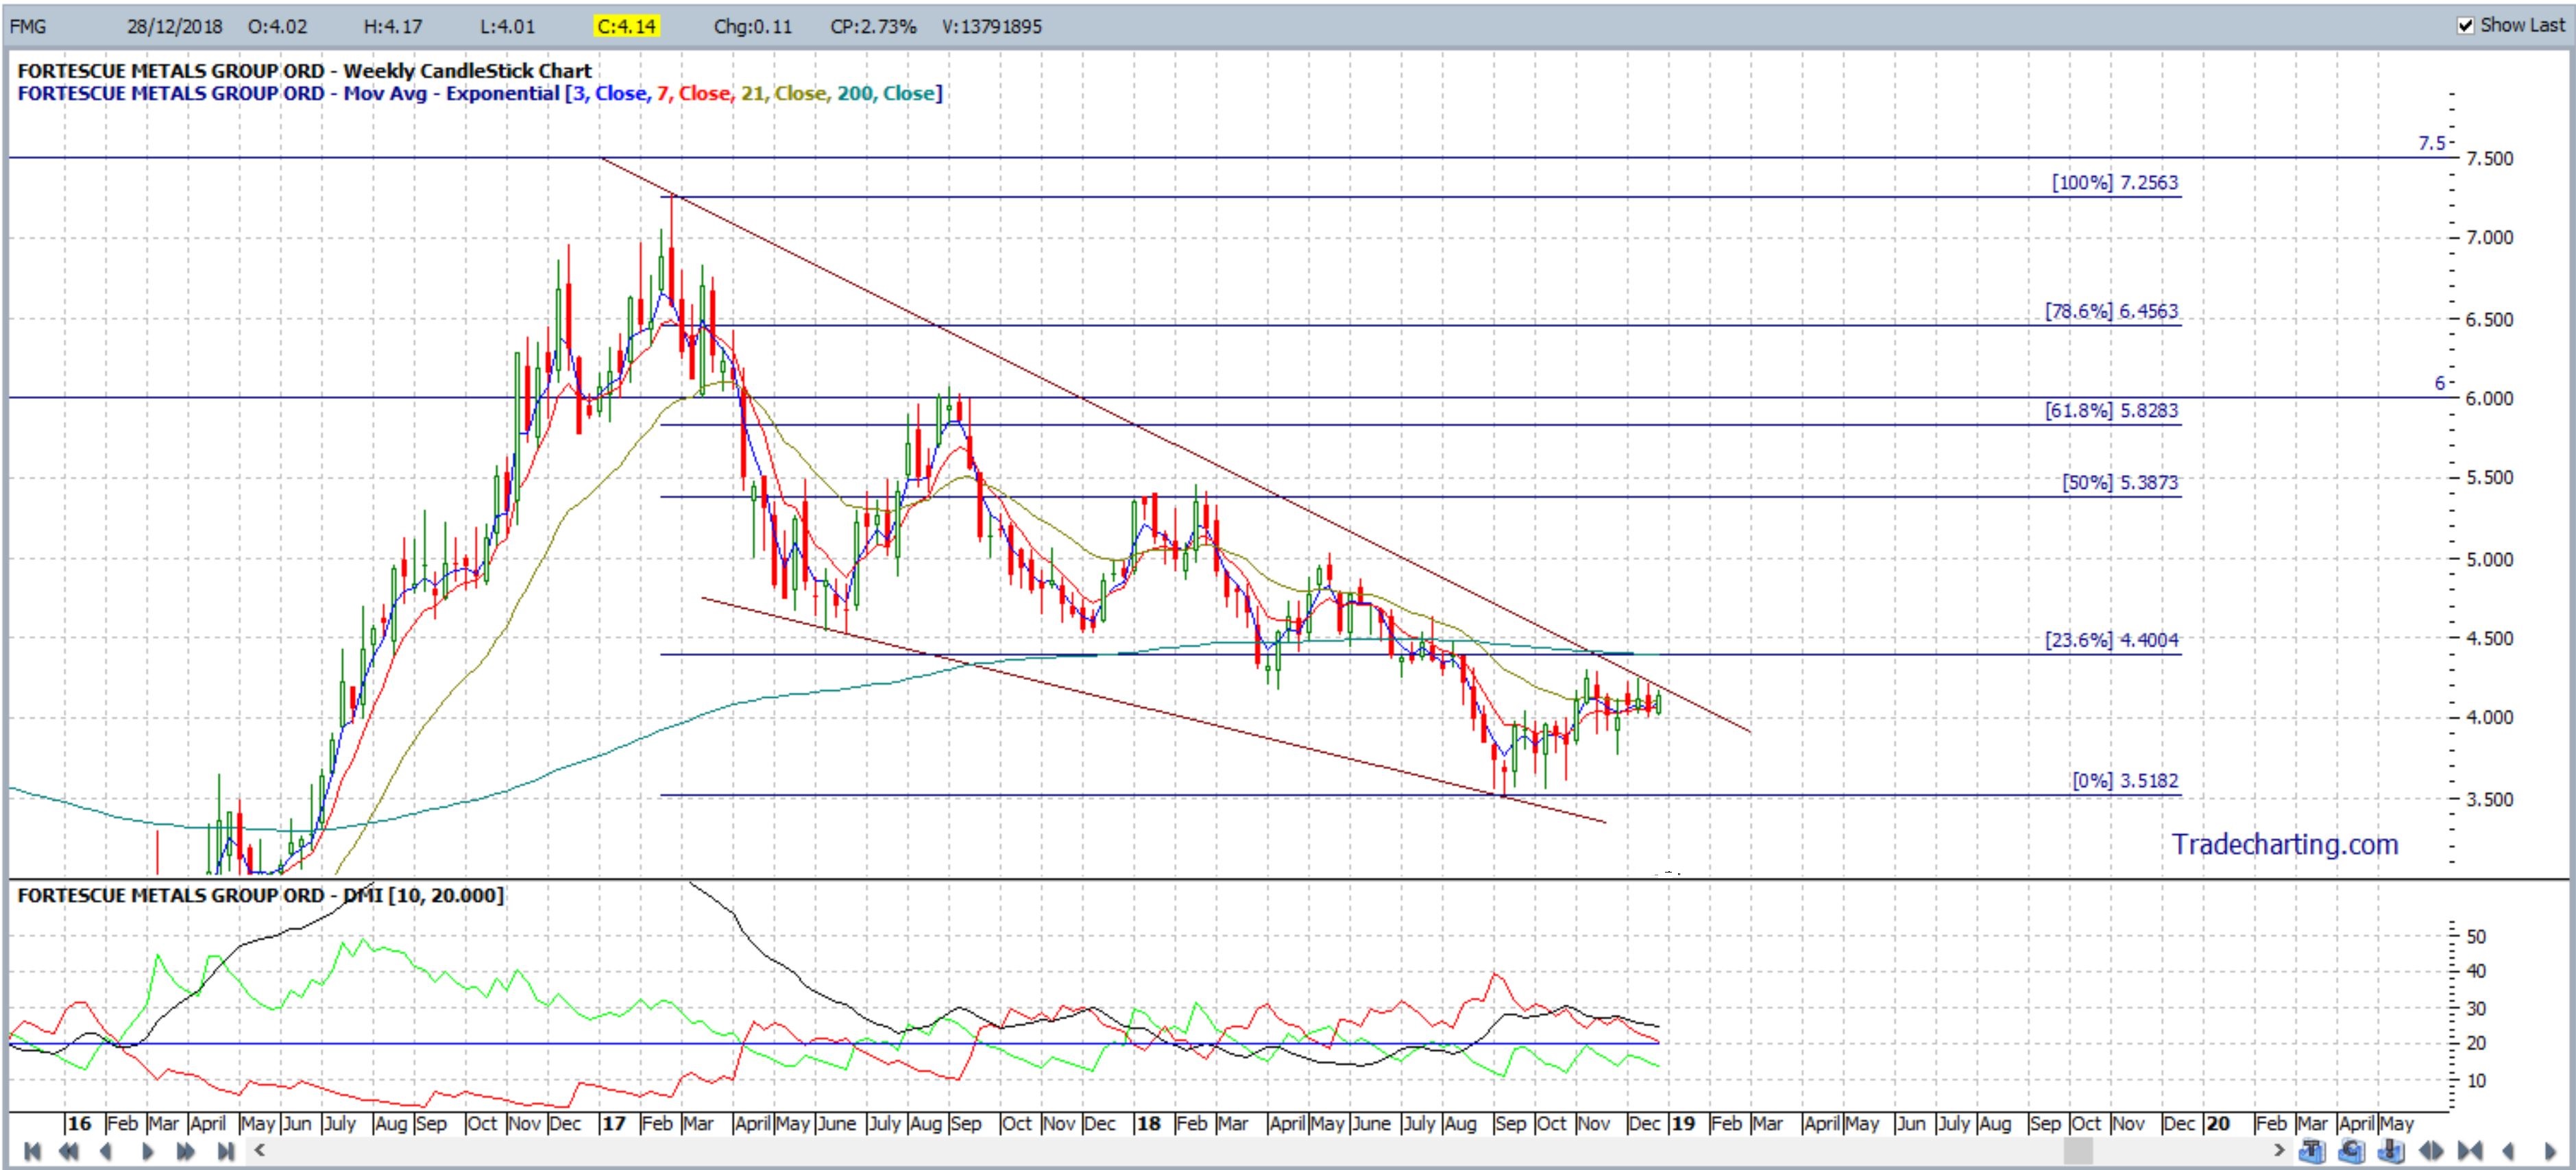
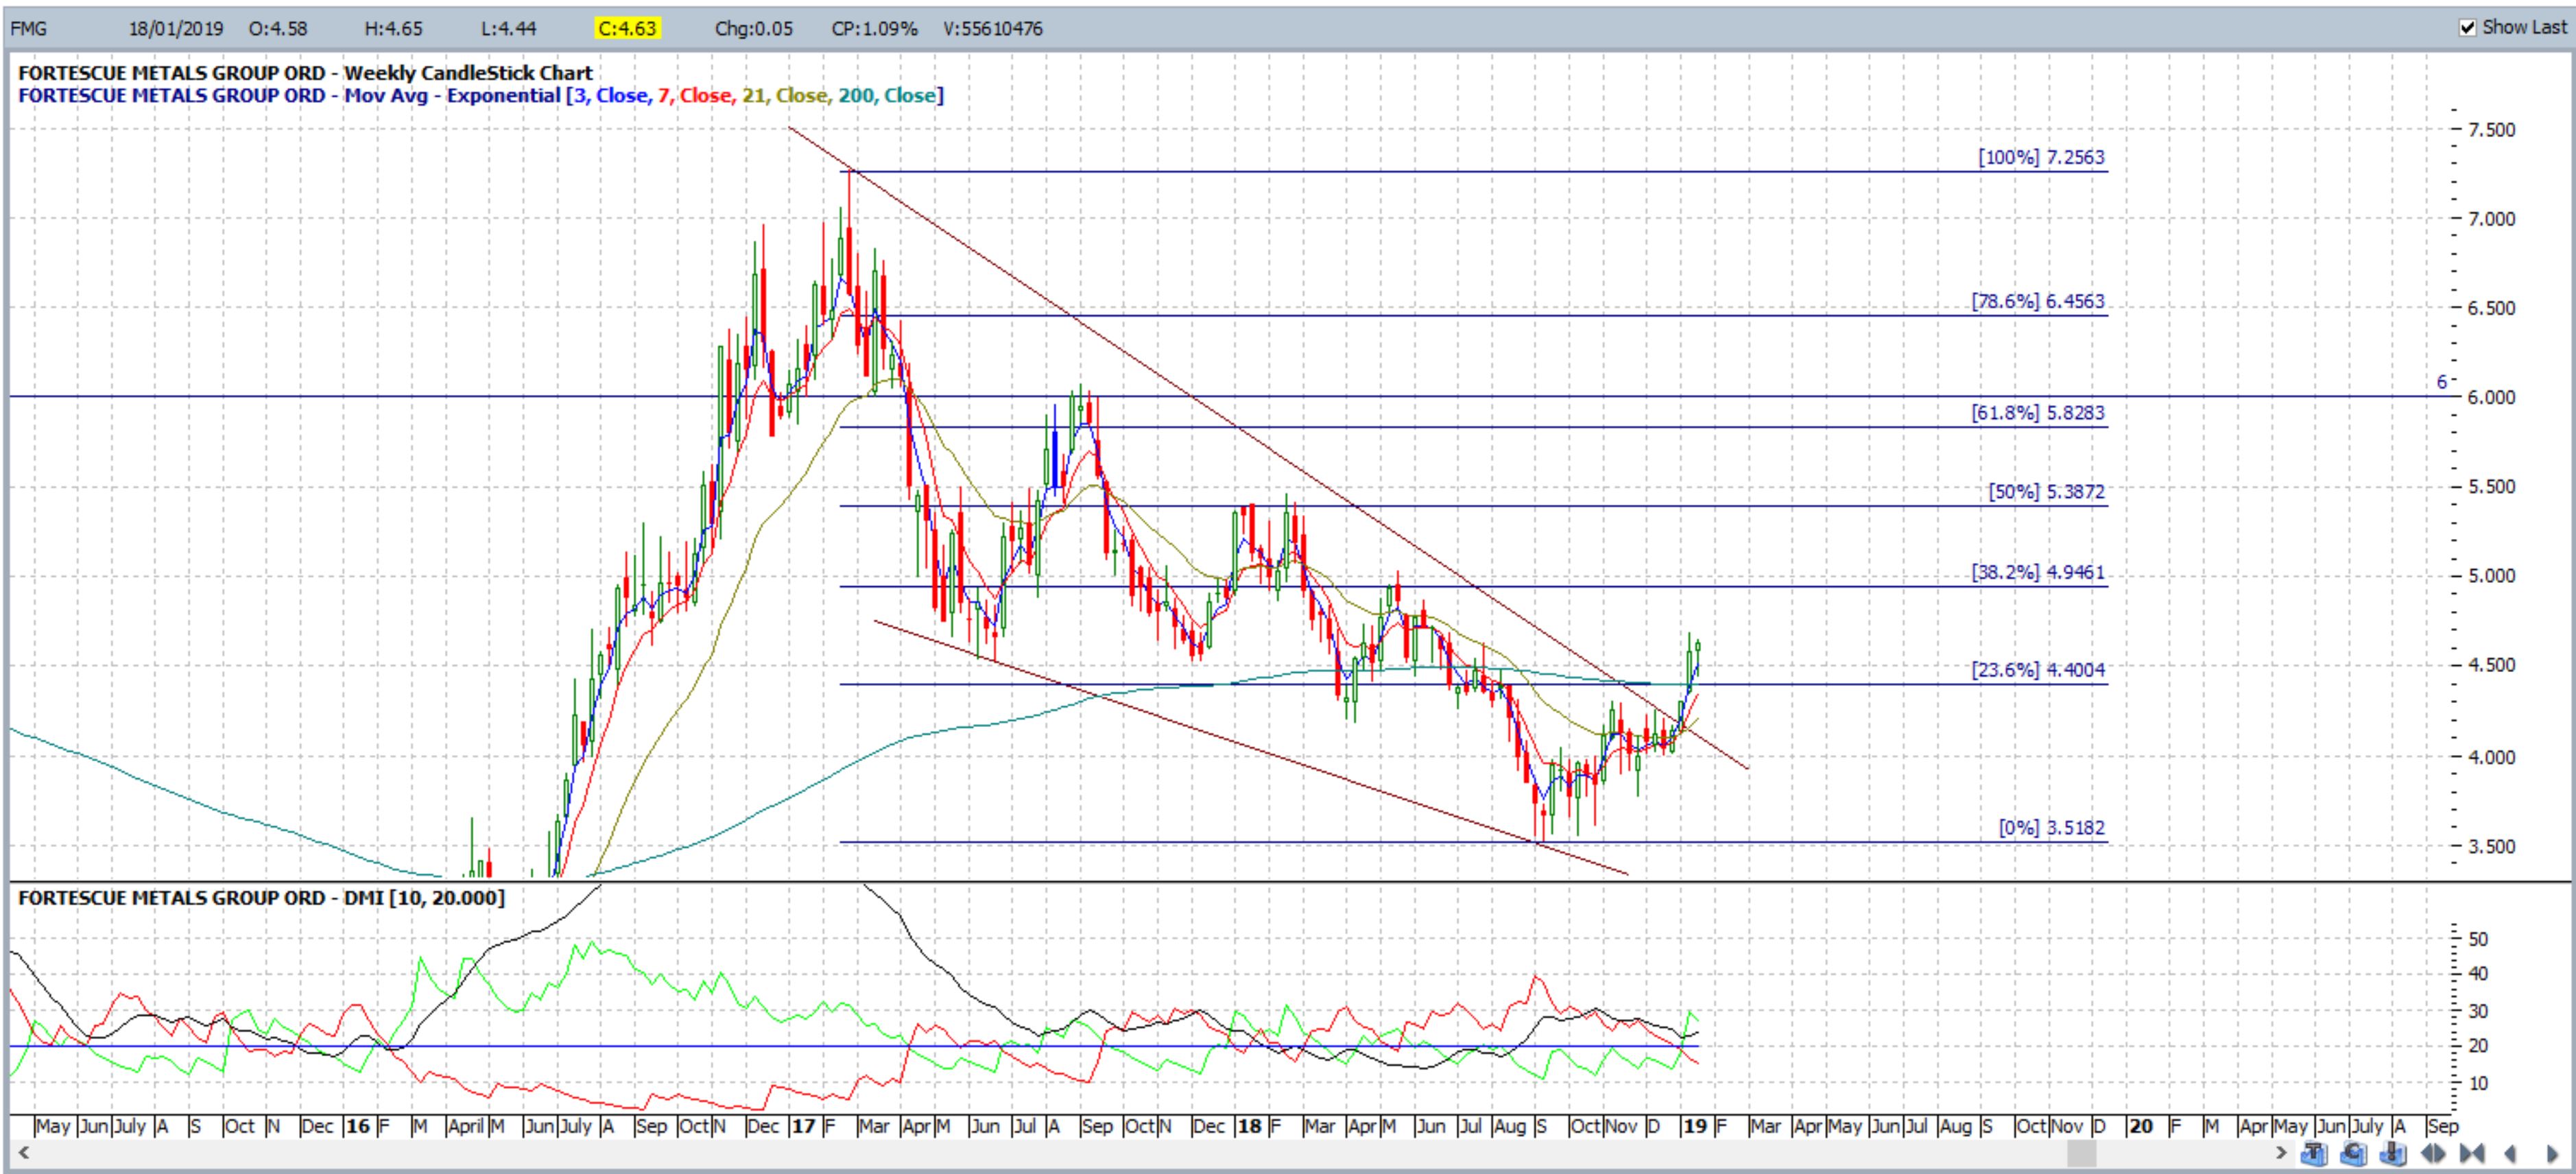
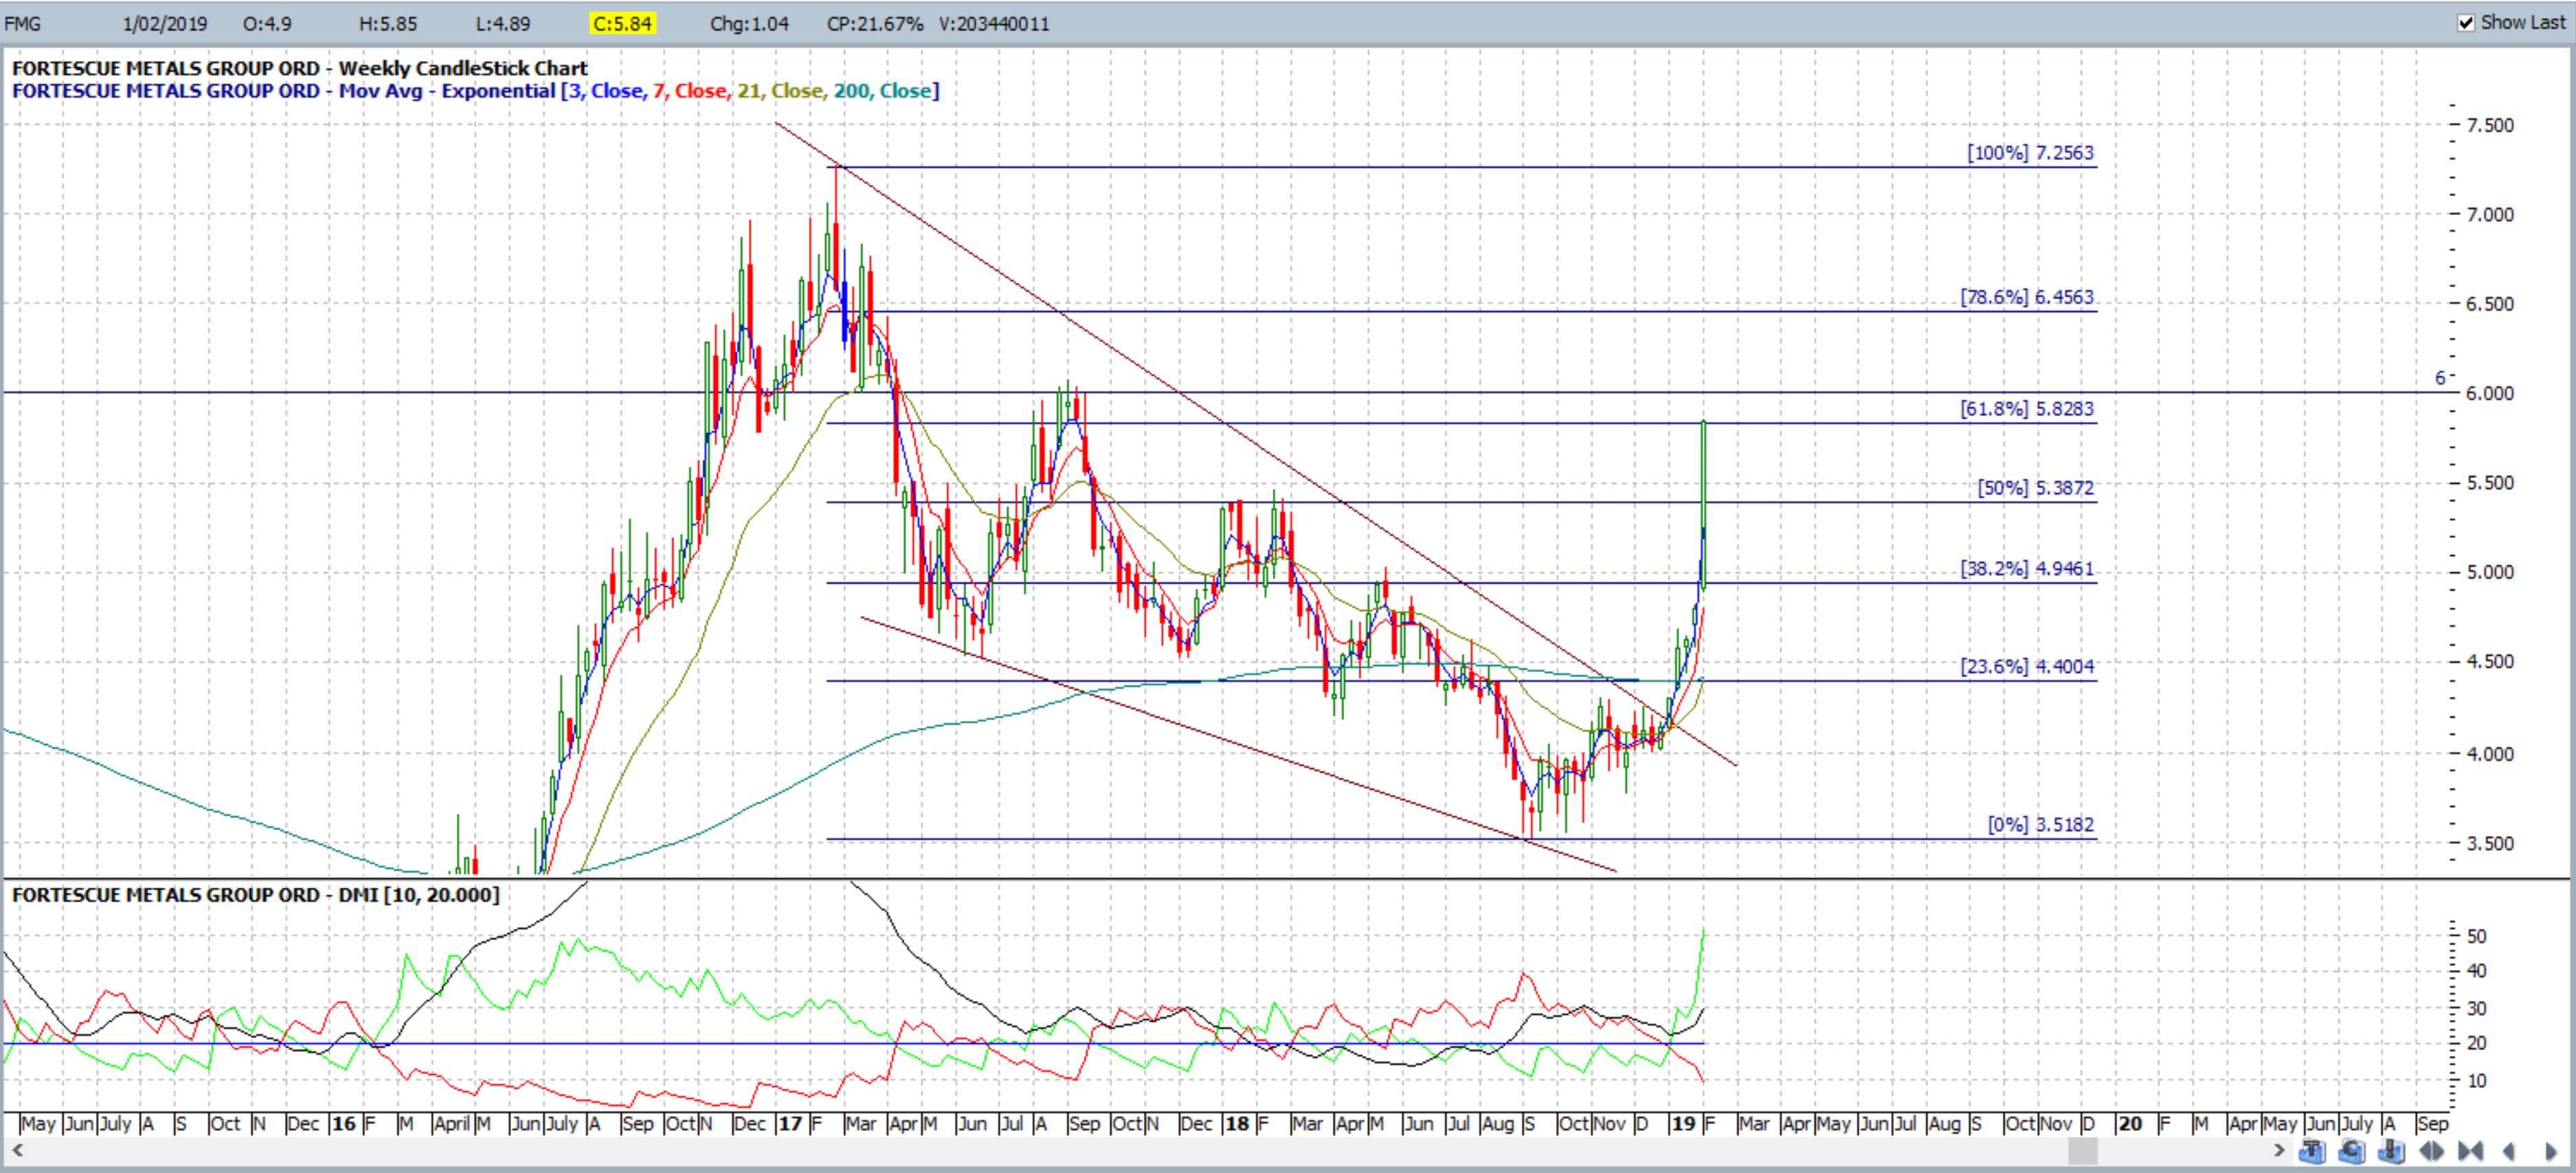
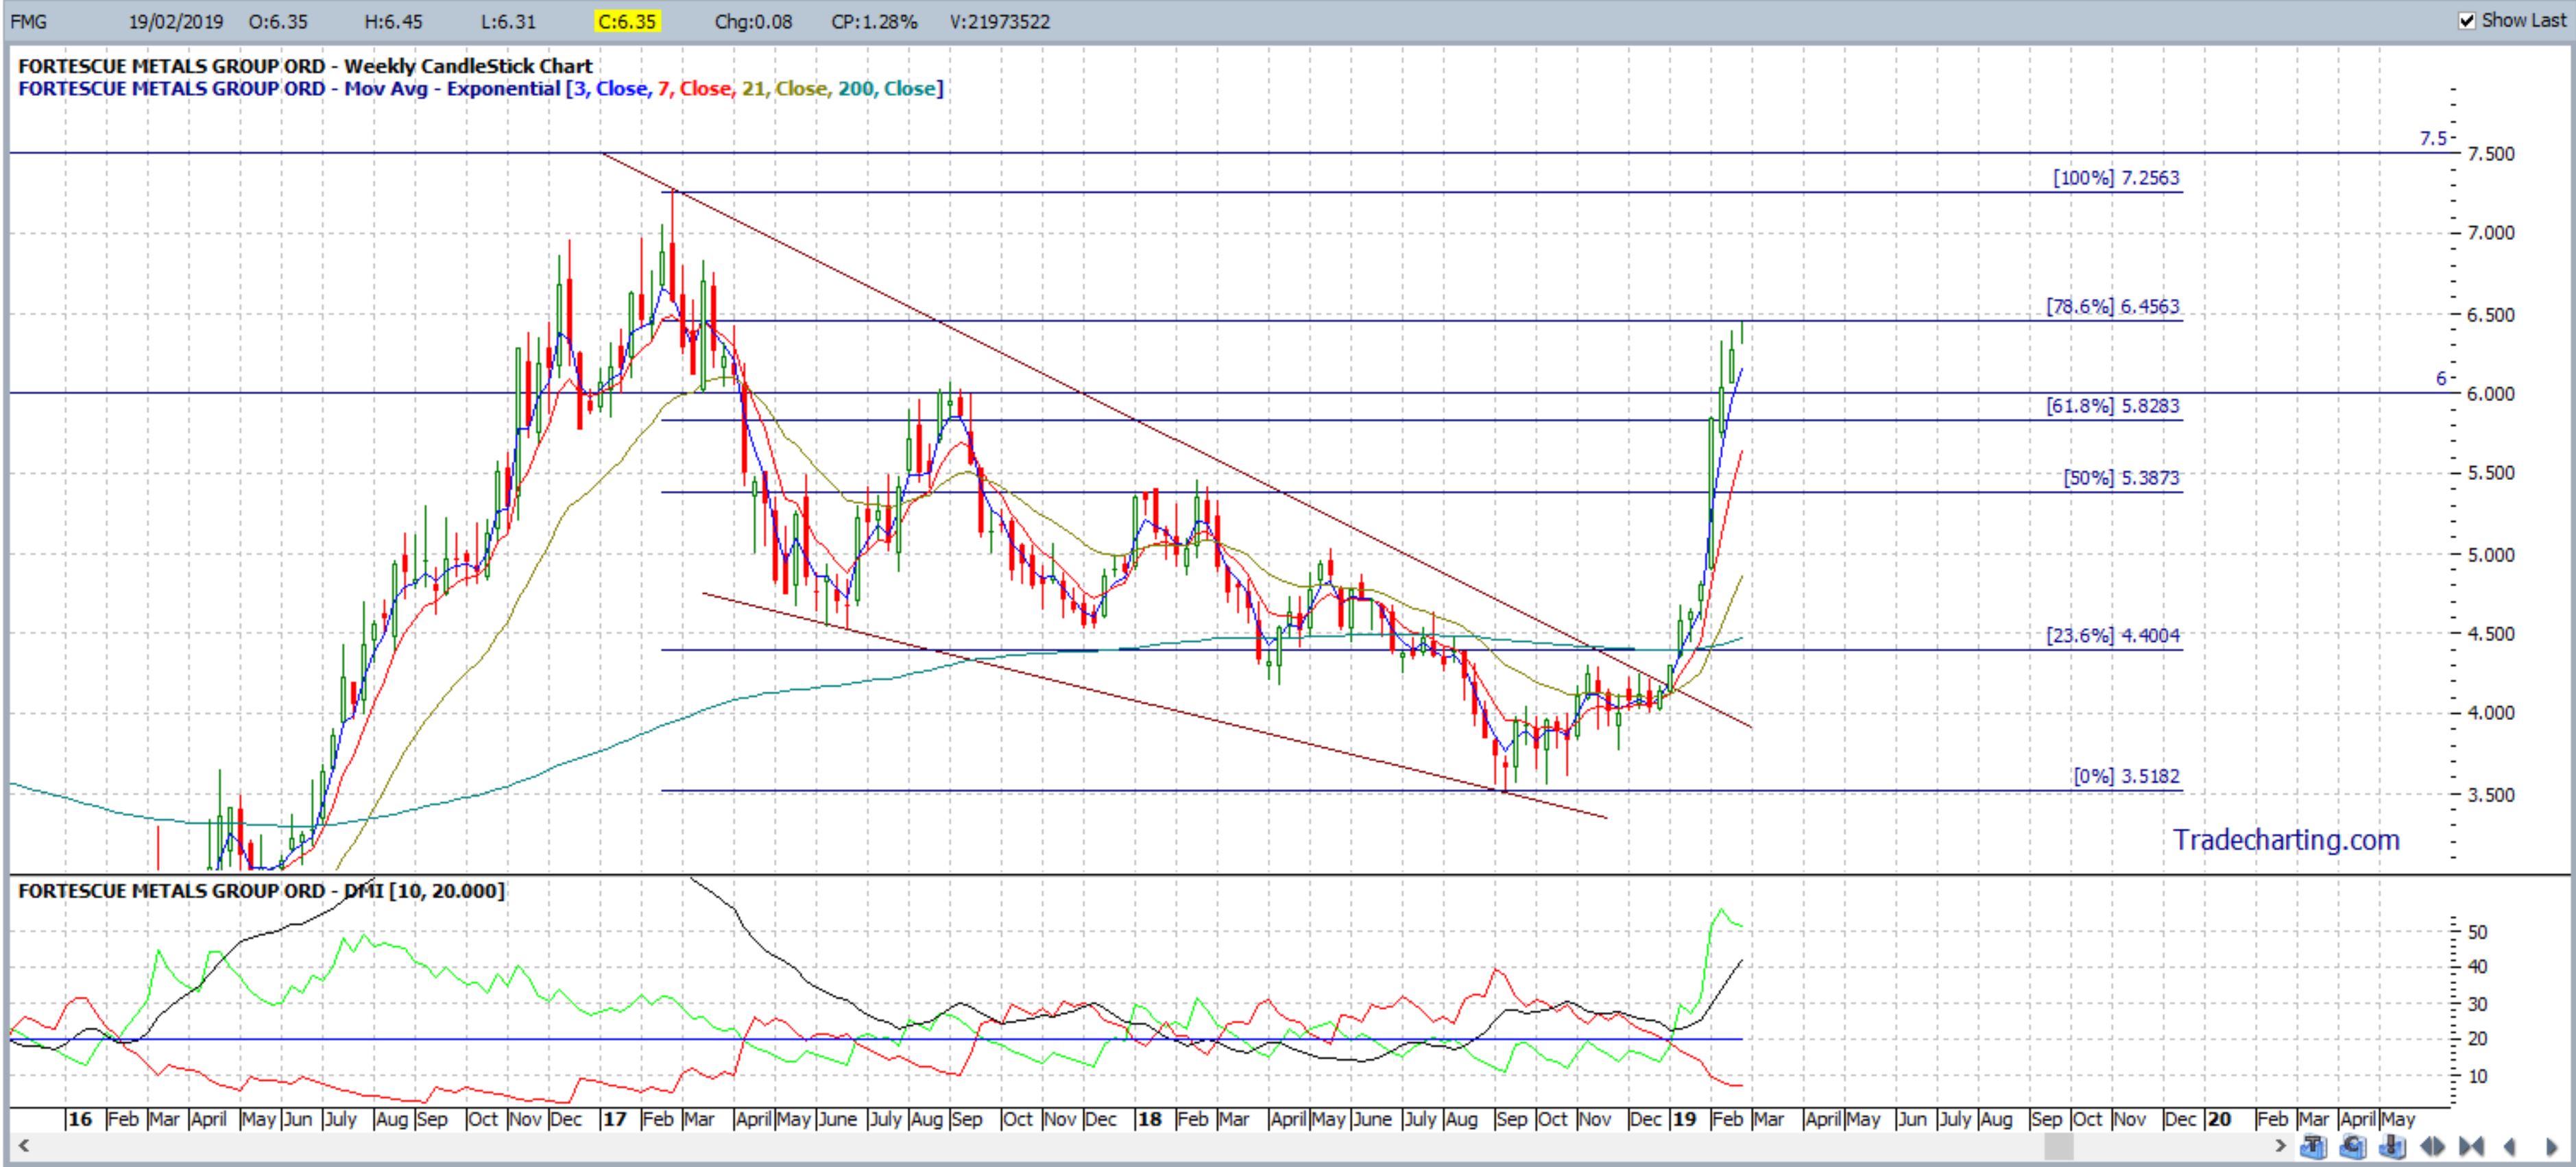
FMG weekly: Fortescue Metal Group February 2019: this descending wedge competed rather quickly with a move to the target 61.8%:
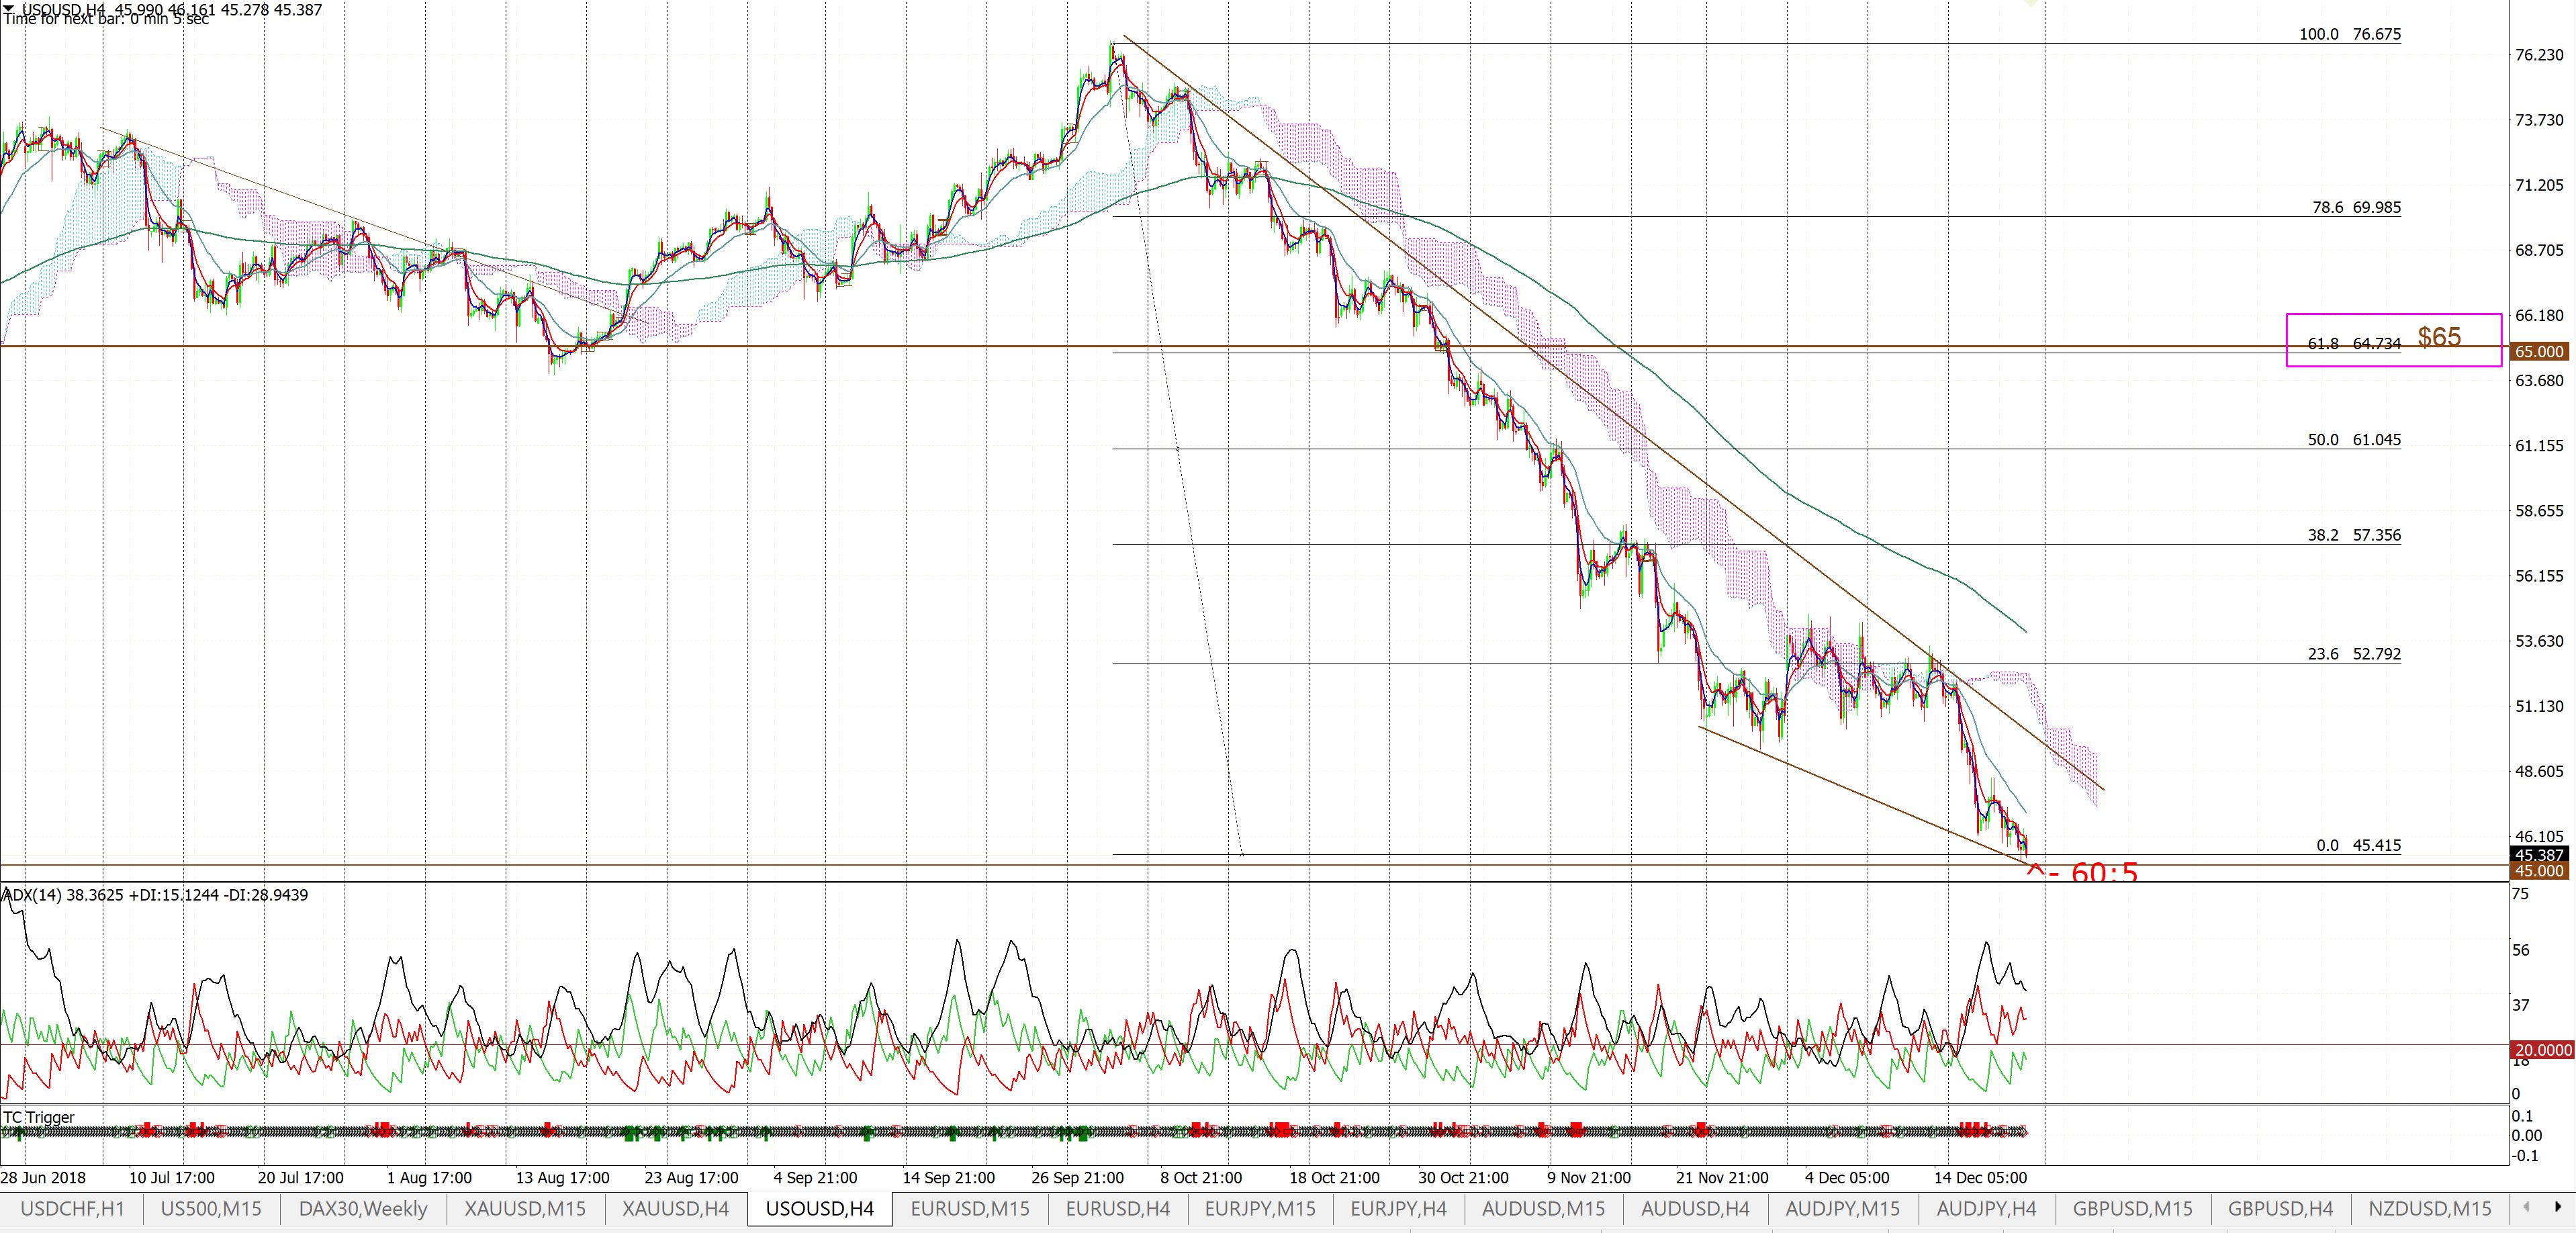
Oil: January 2019: I had been stalking this channel breakout on Oil since December 22nd 2018. I have unlocked this post for traders to view but the 4hr chart of Oil from that post is below:
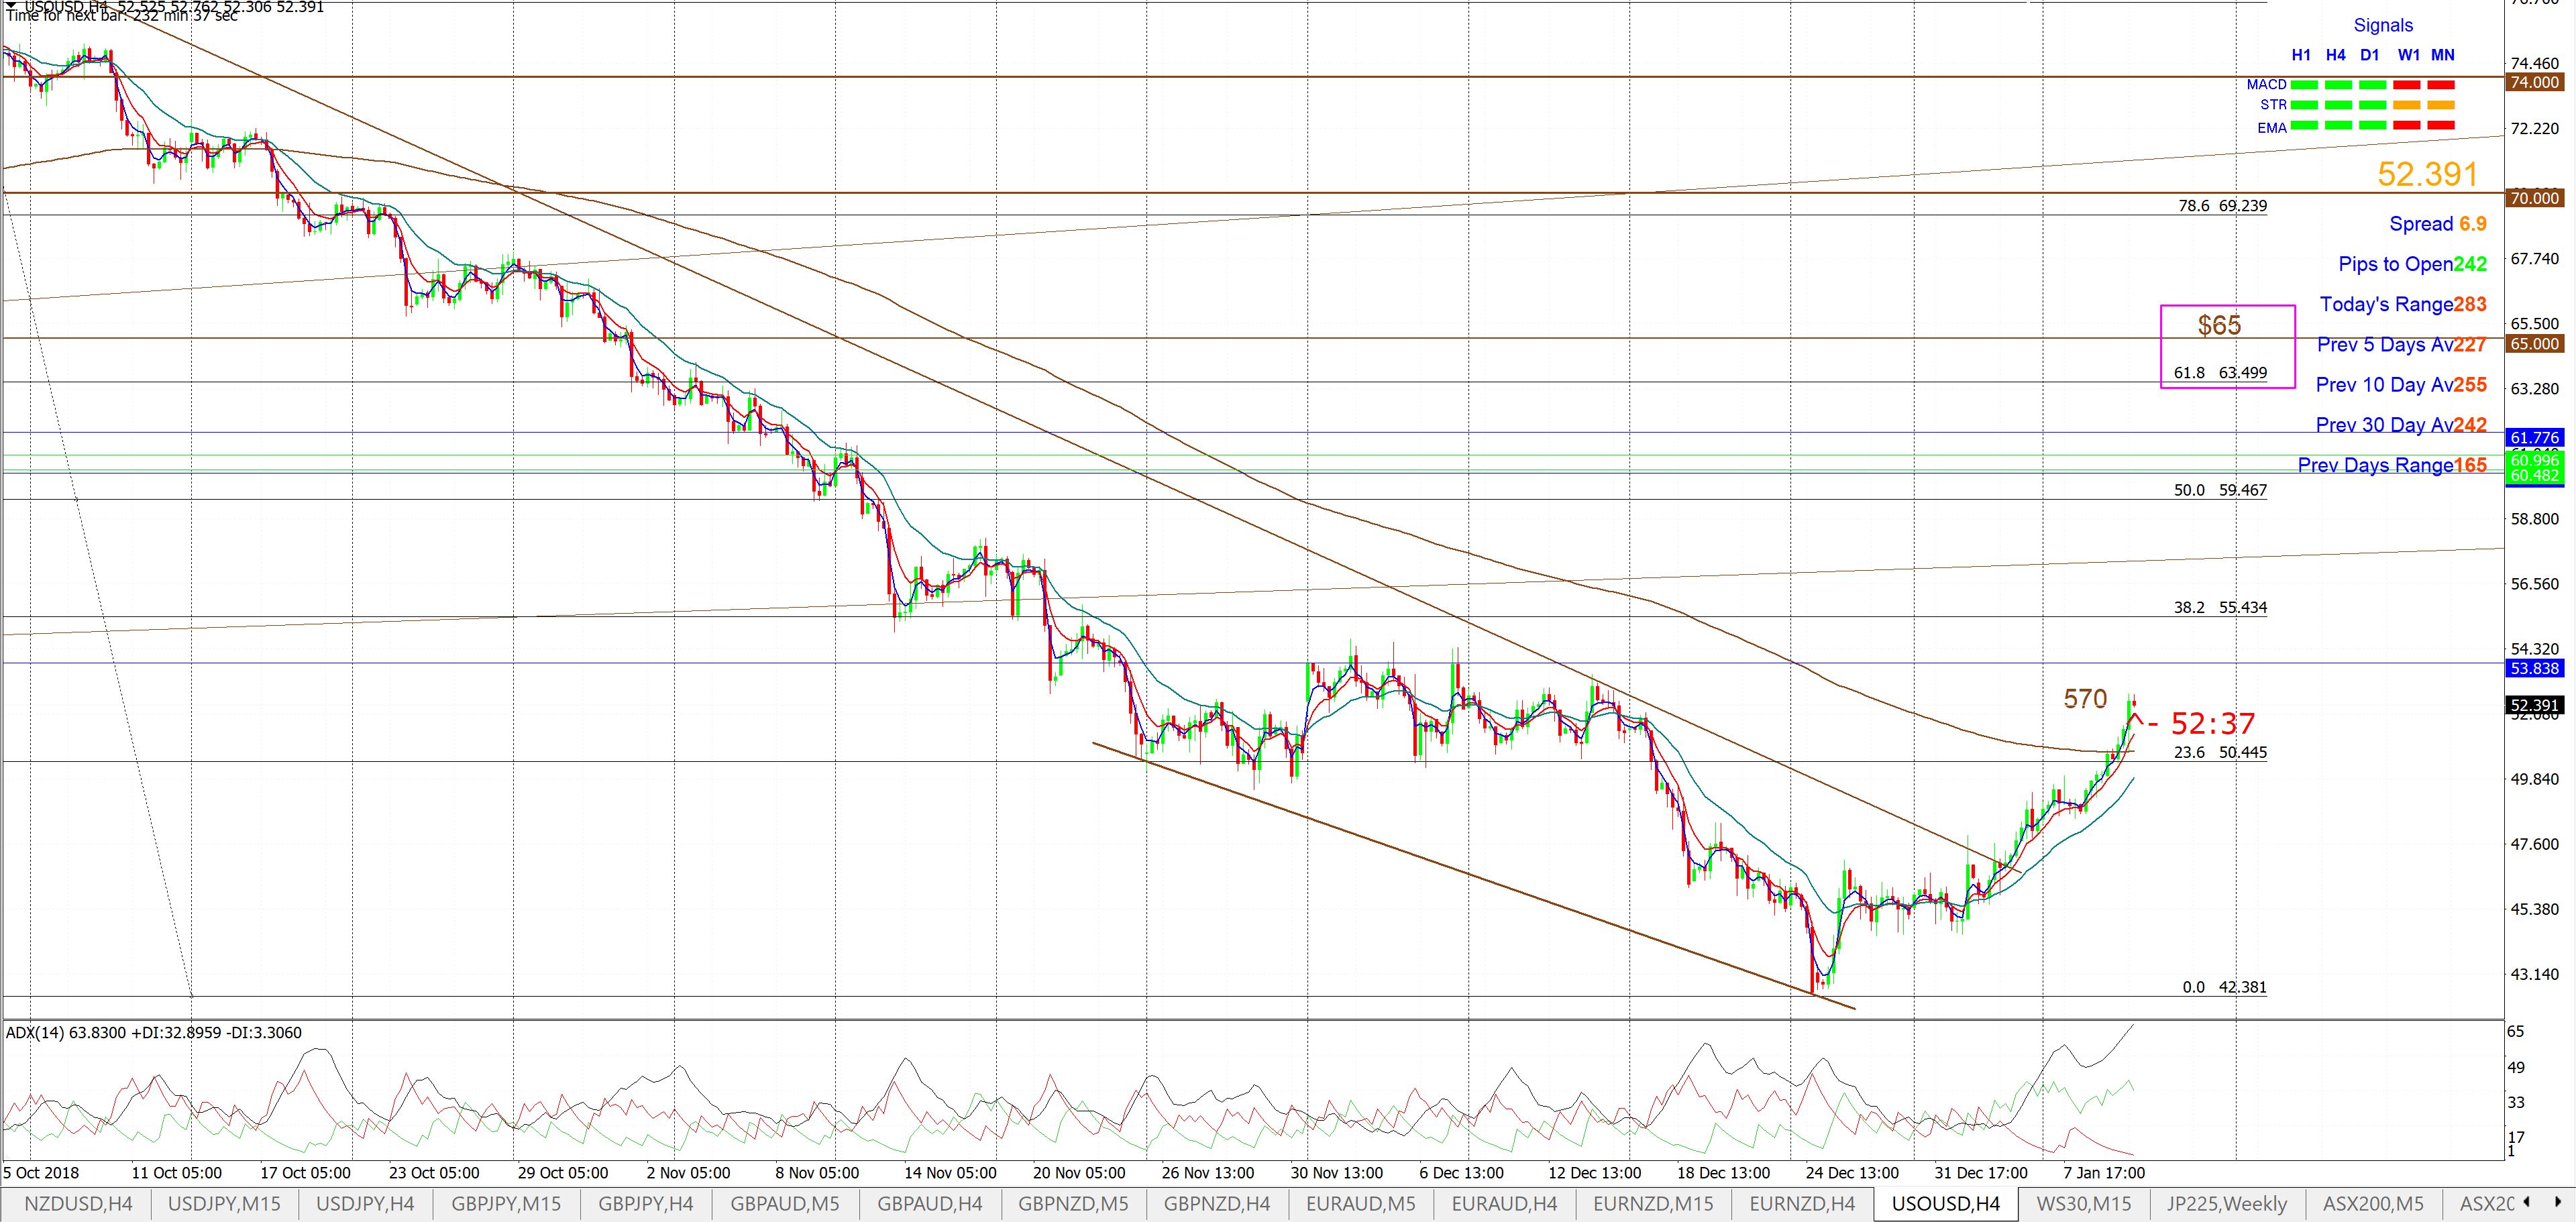
As at January 10th this breakout was up 570 pips:
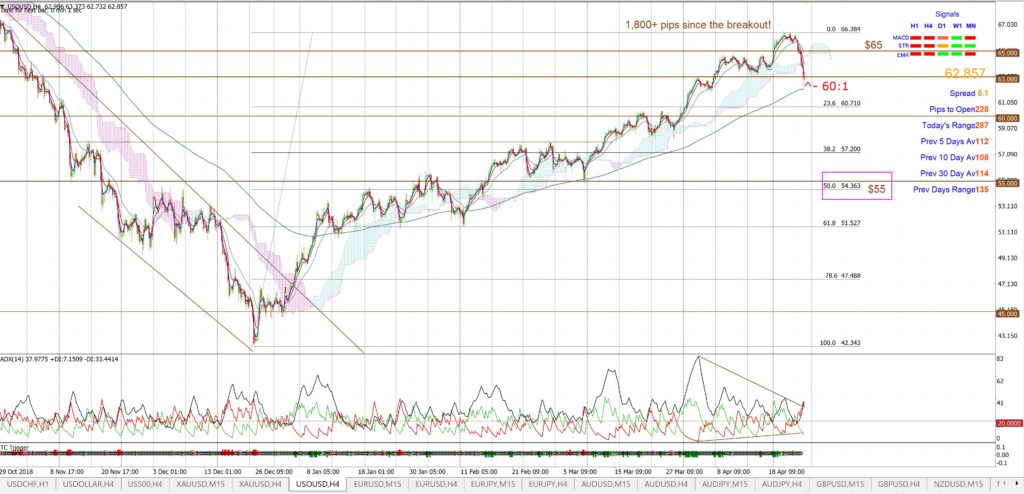
By April 2019 Oil peaked well above my $65 target for a gain of over 1,800 pips:
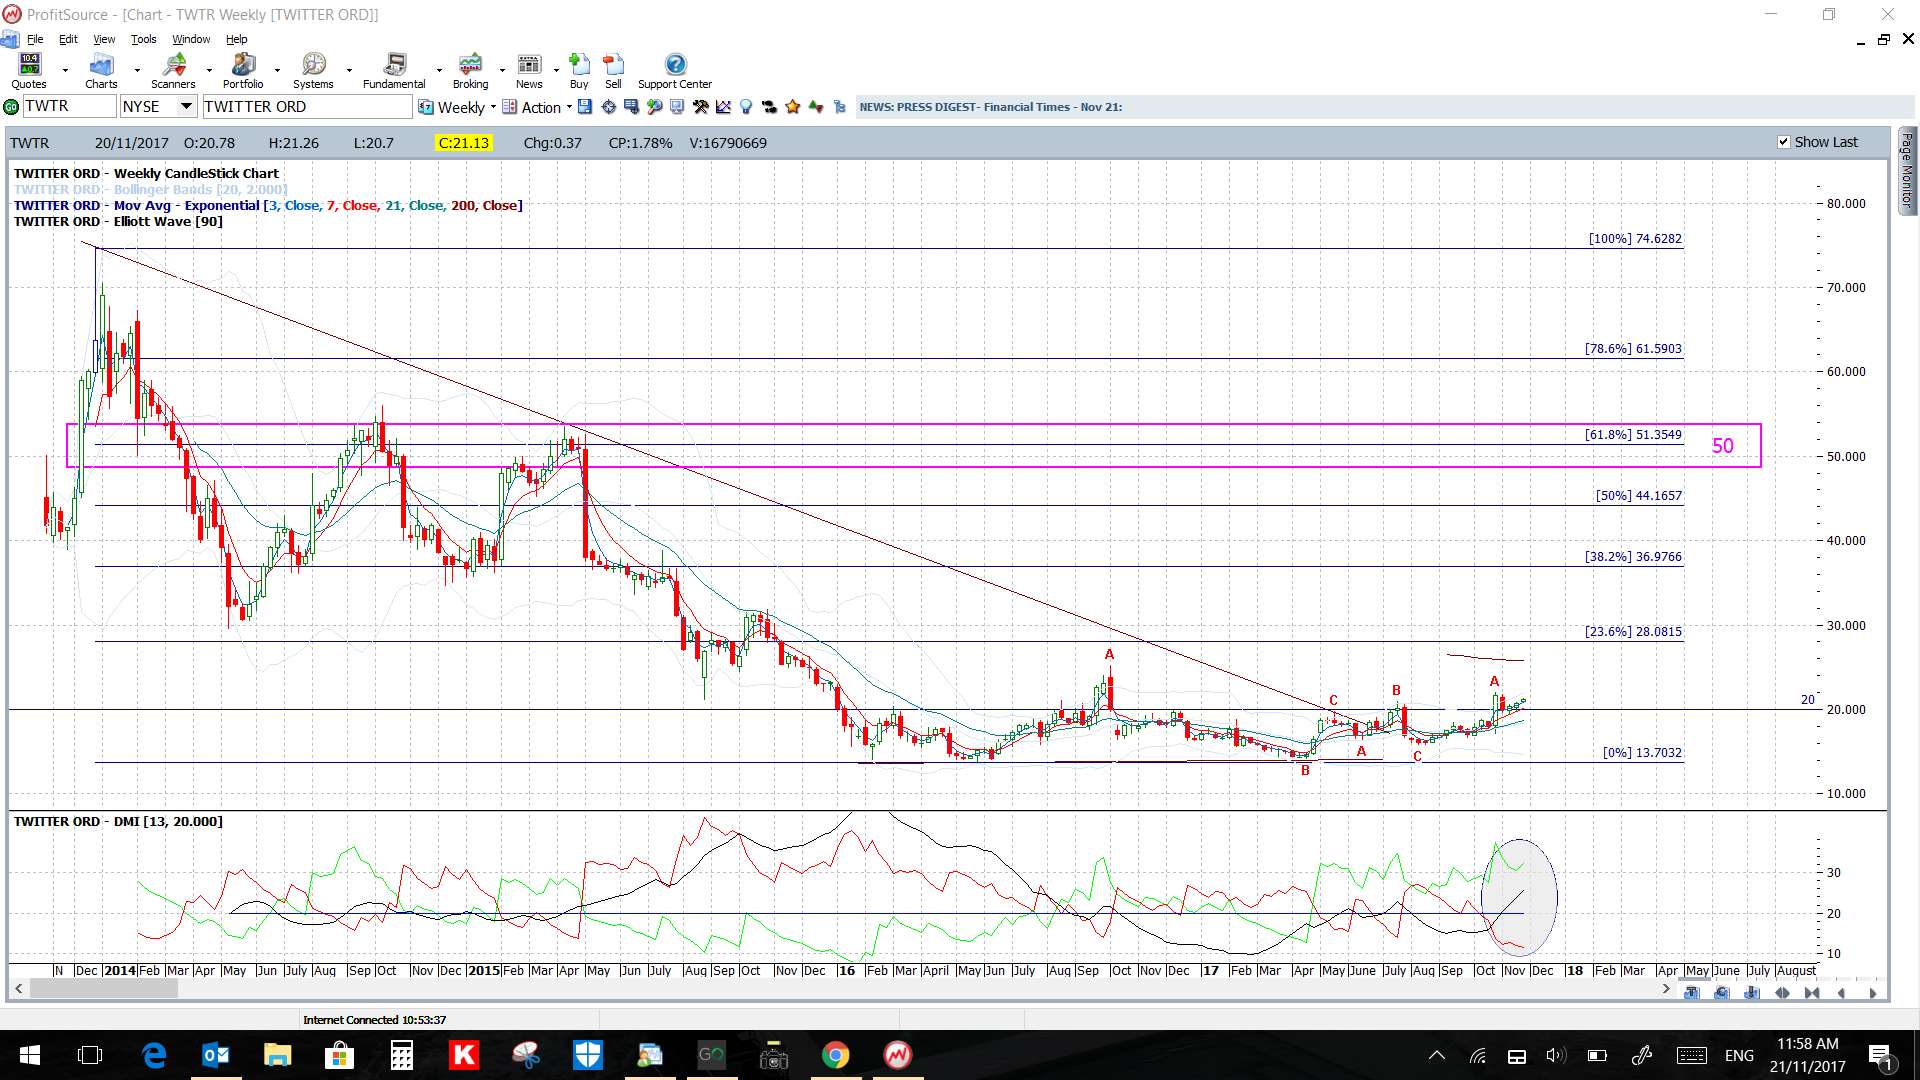
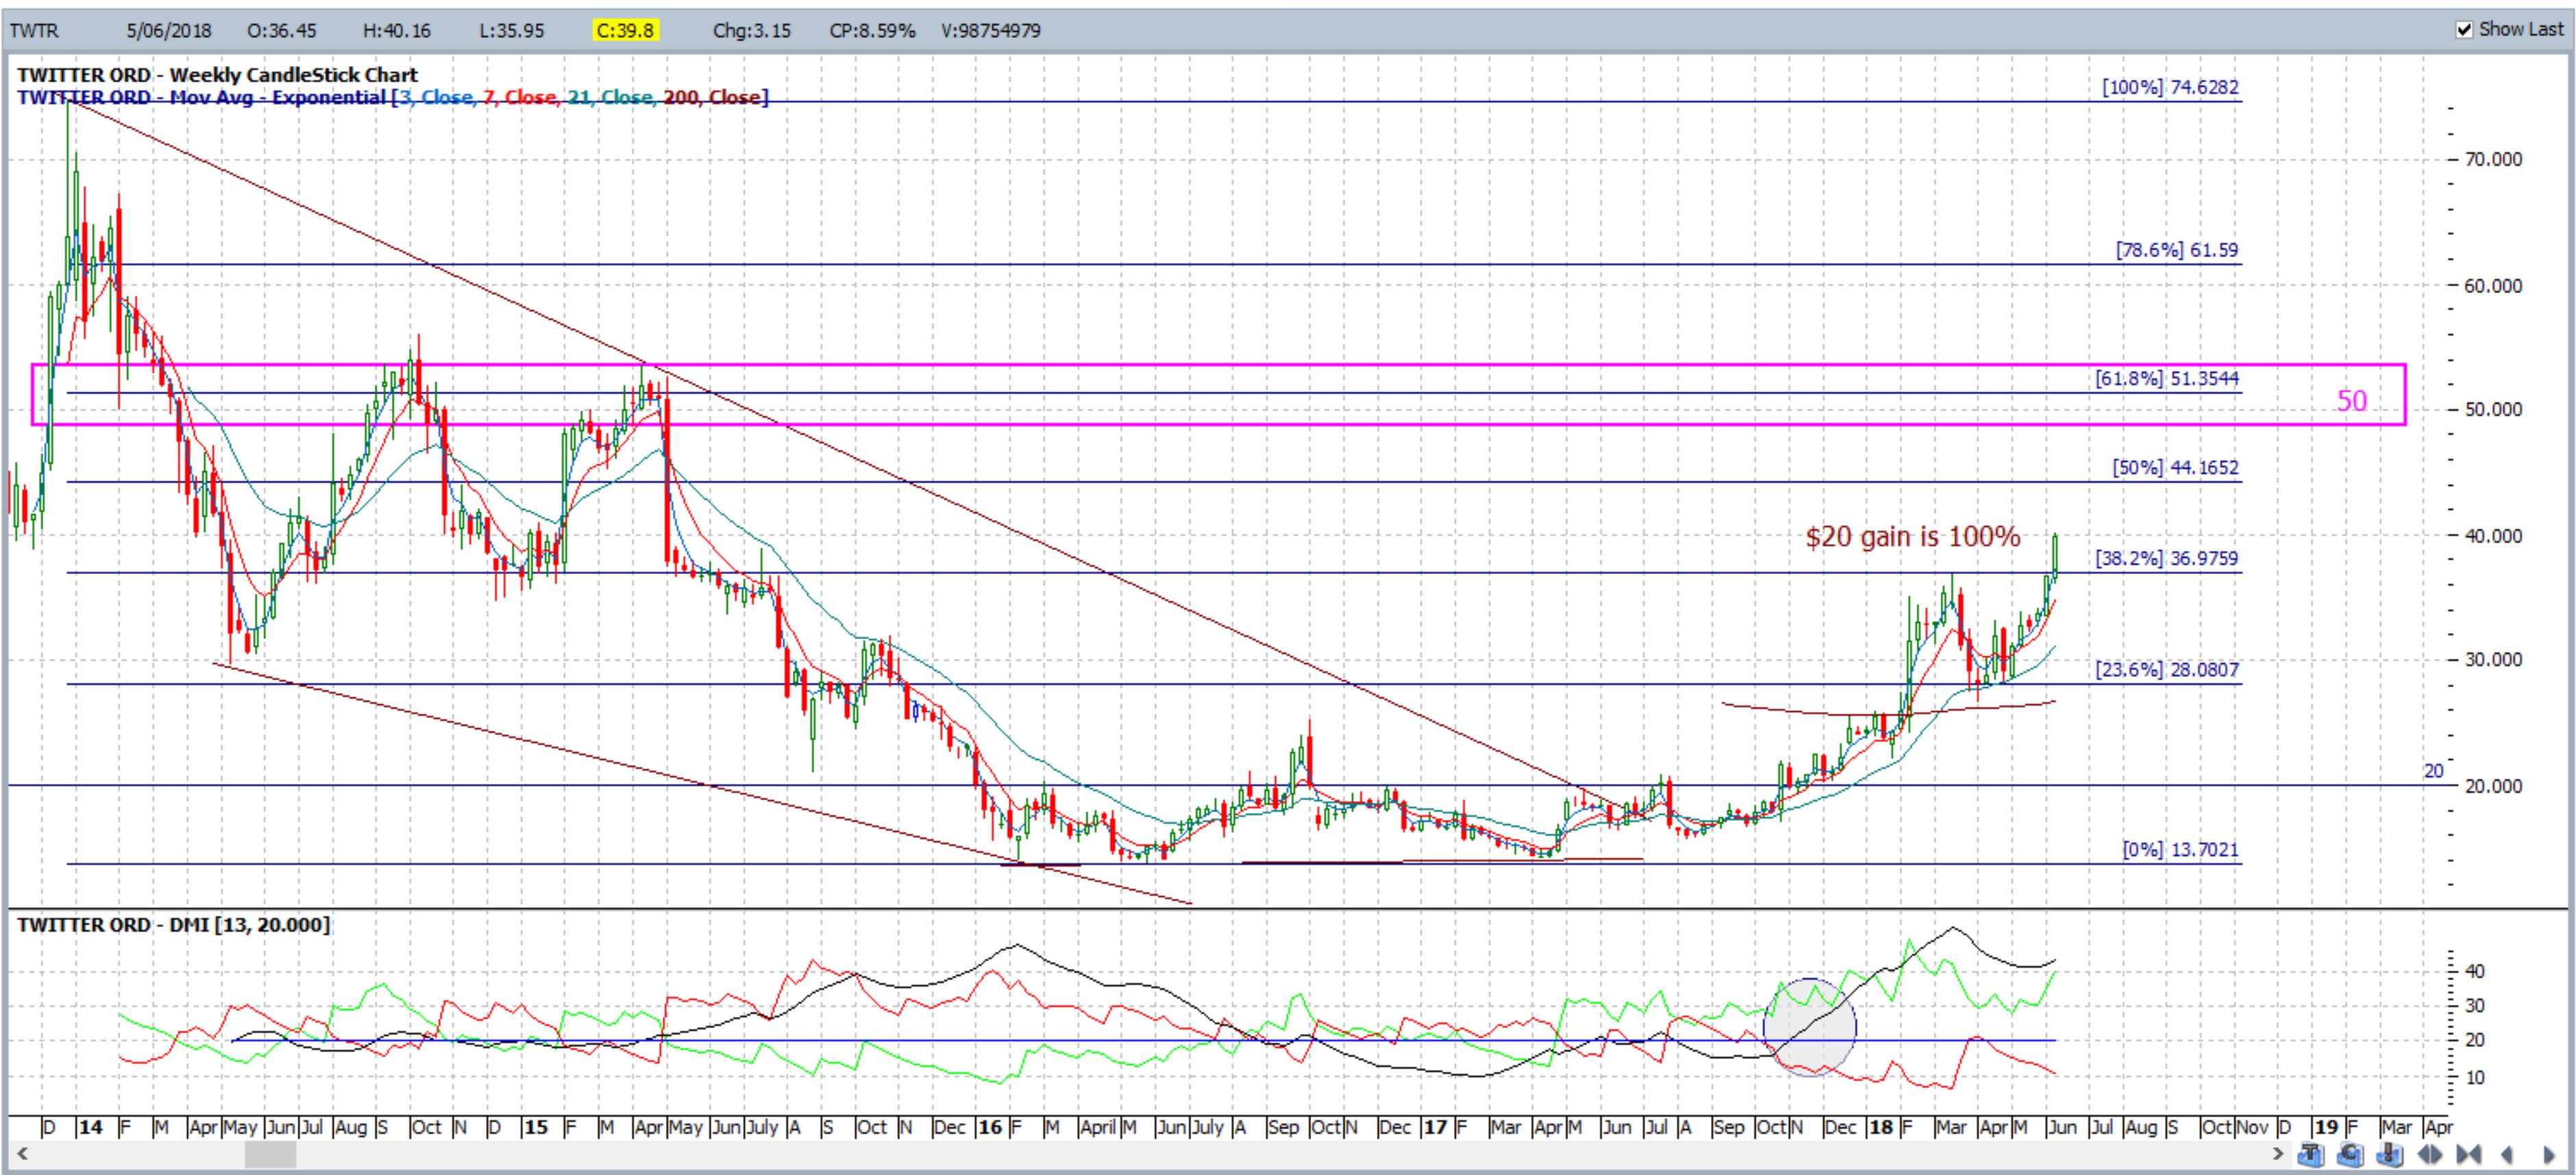
TWTR: 2018: Twitter: this breakout gave a 100% Return:
November 2017
June 2018
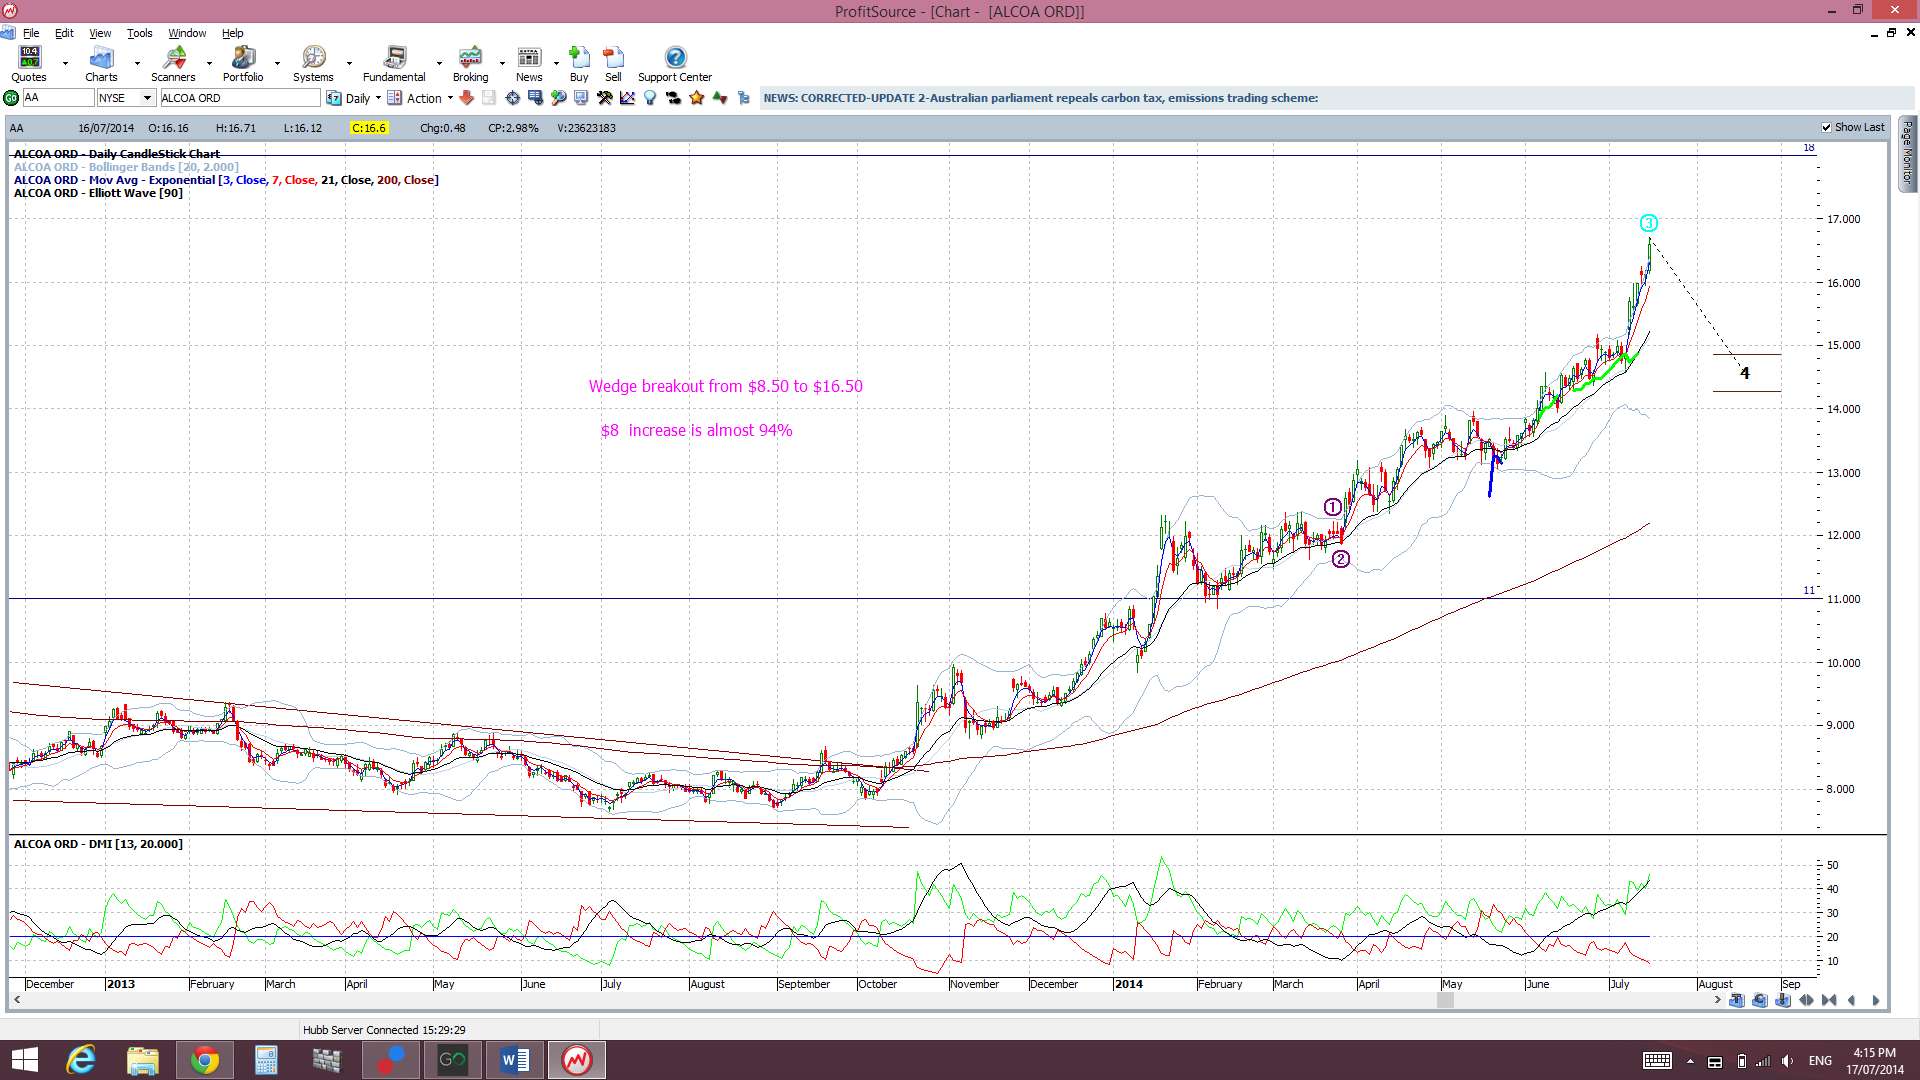
AA: Alcoa: this breakout gave a 94% gain:
Oct 14th 2013

July 2014
ILU: Iluka Resources: this has given a 42% gain:
2016
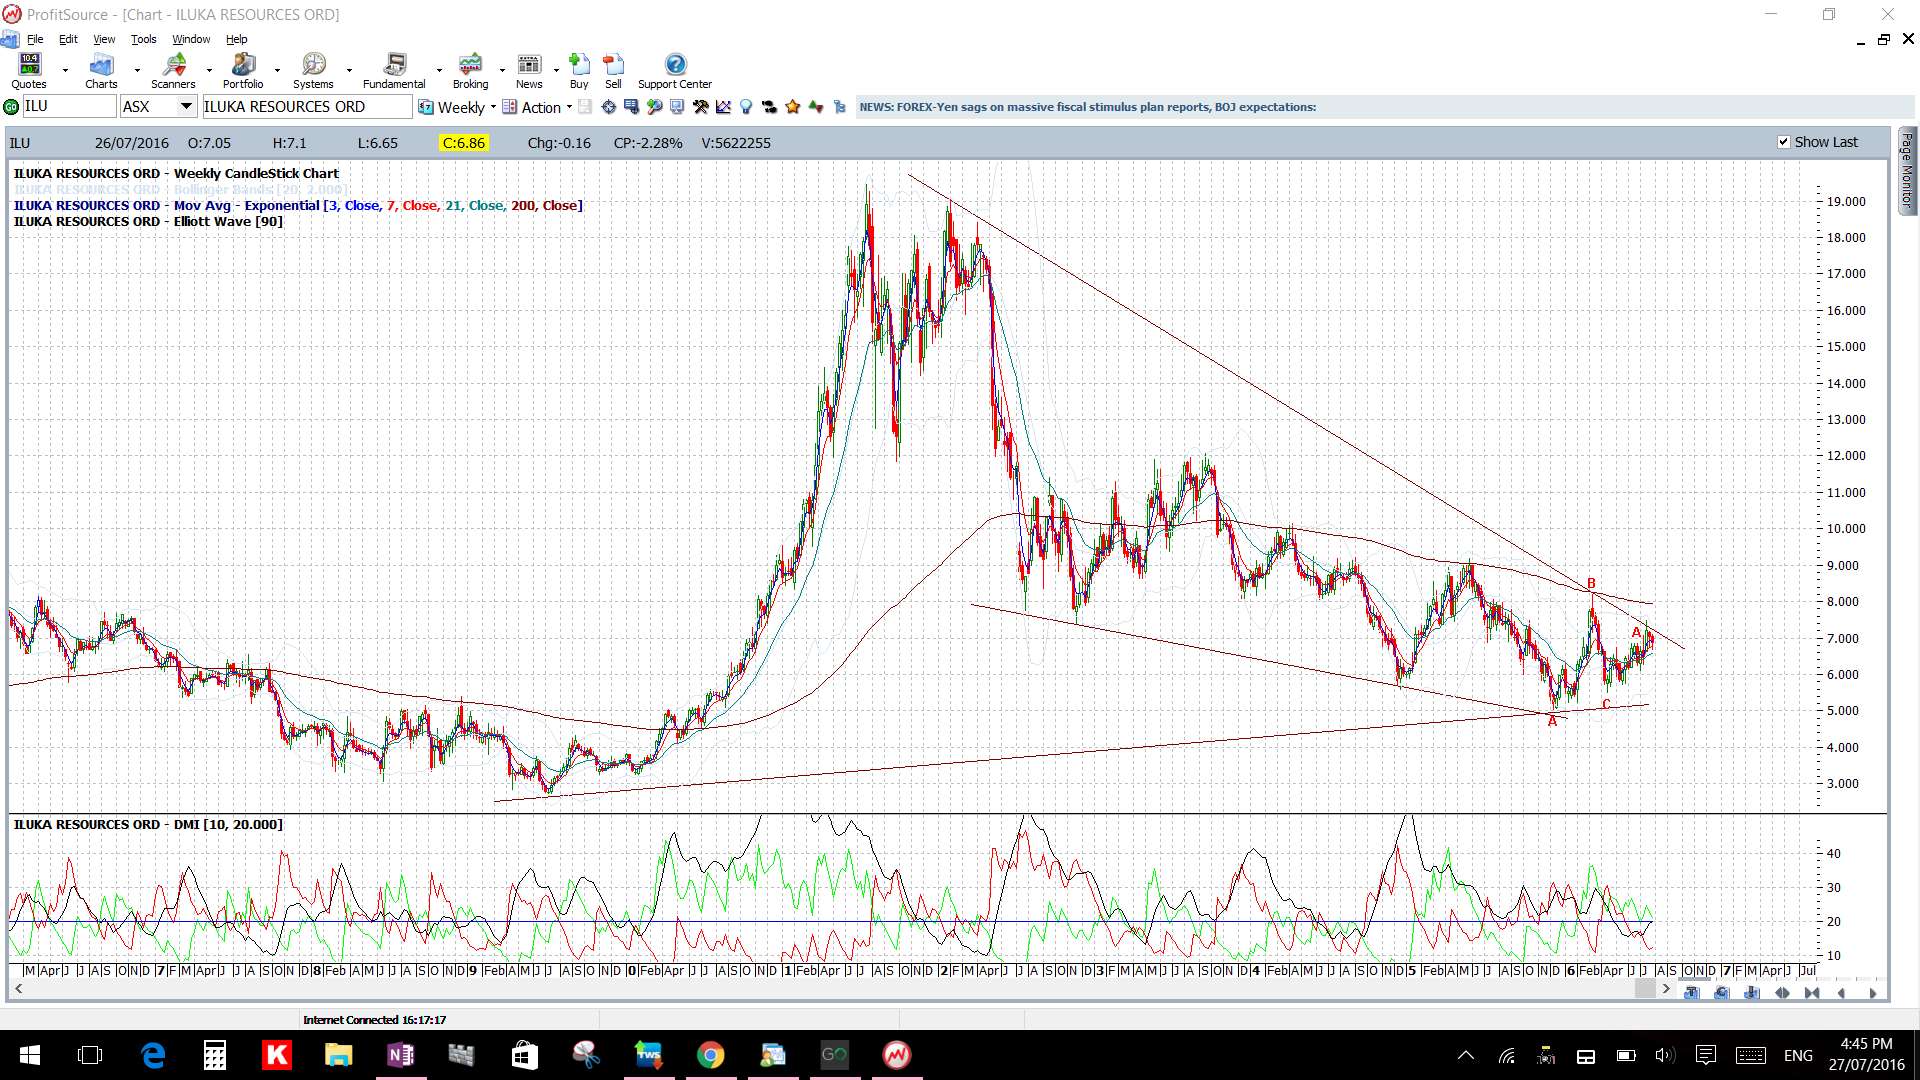
2017
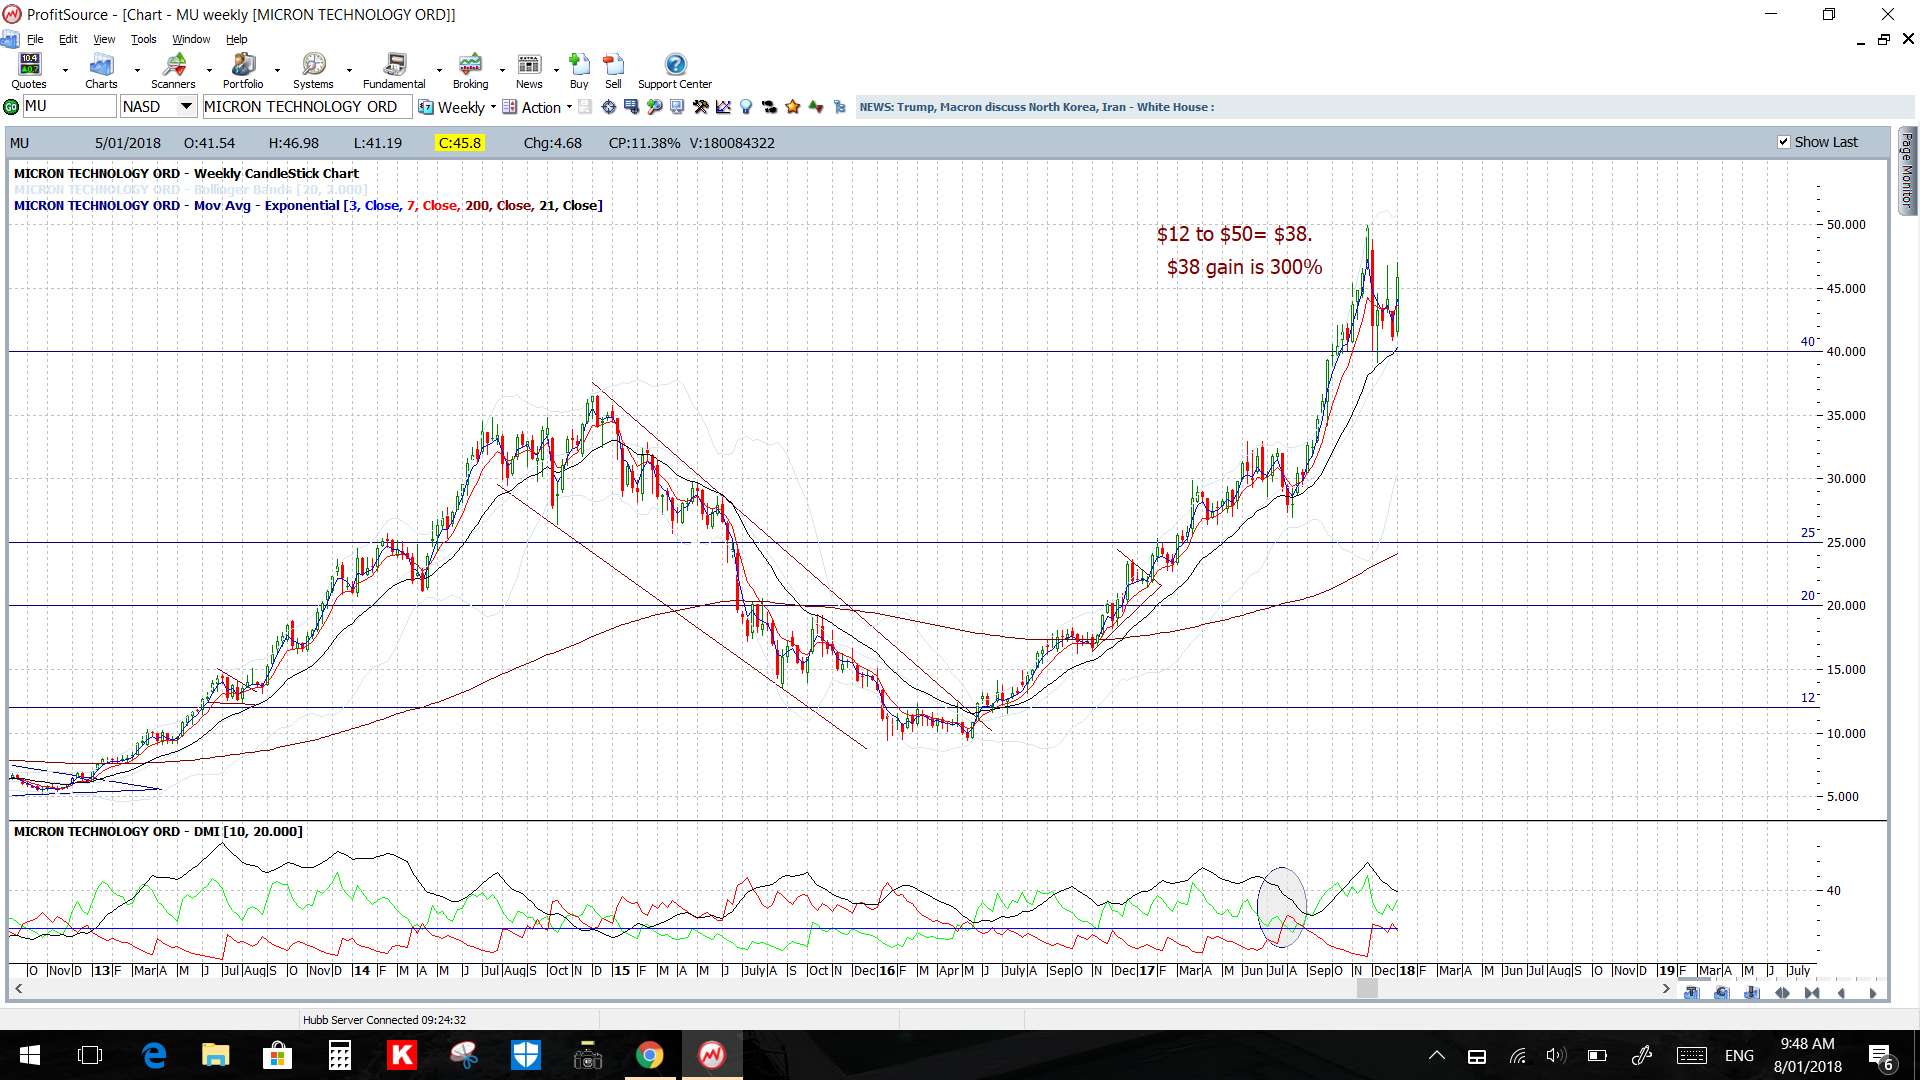
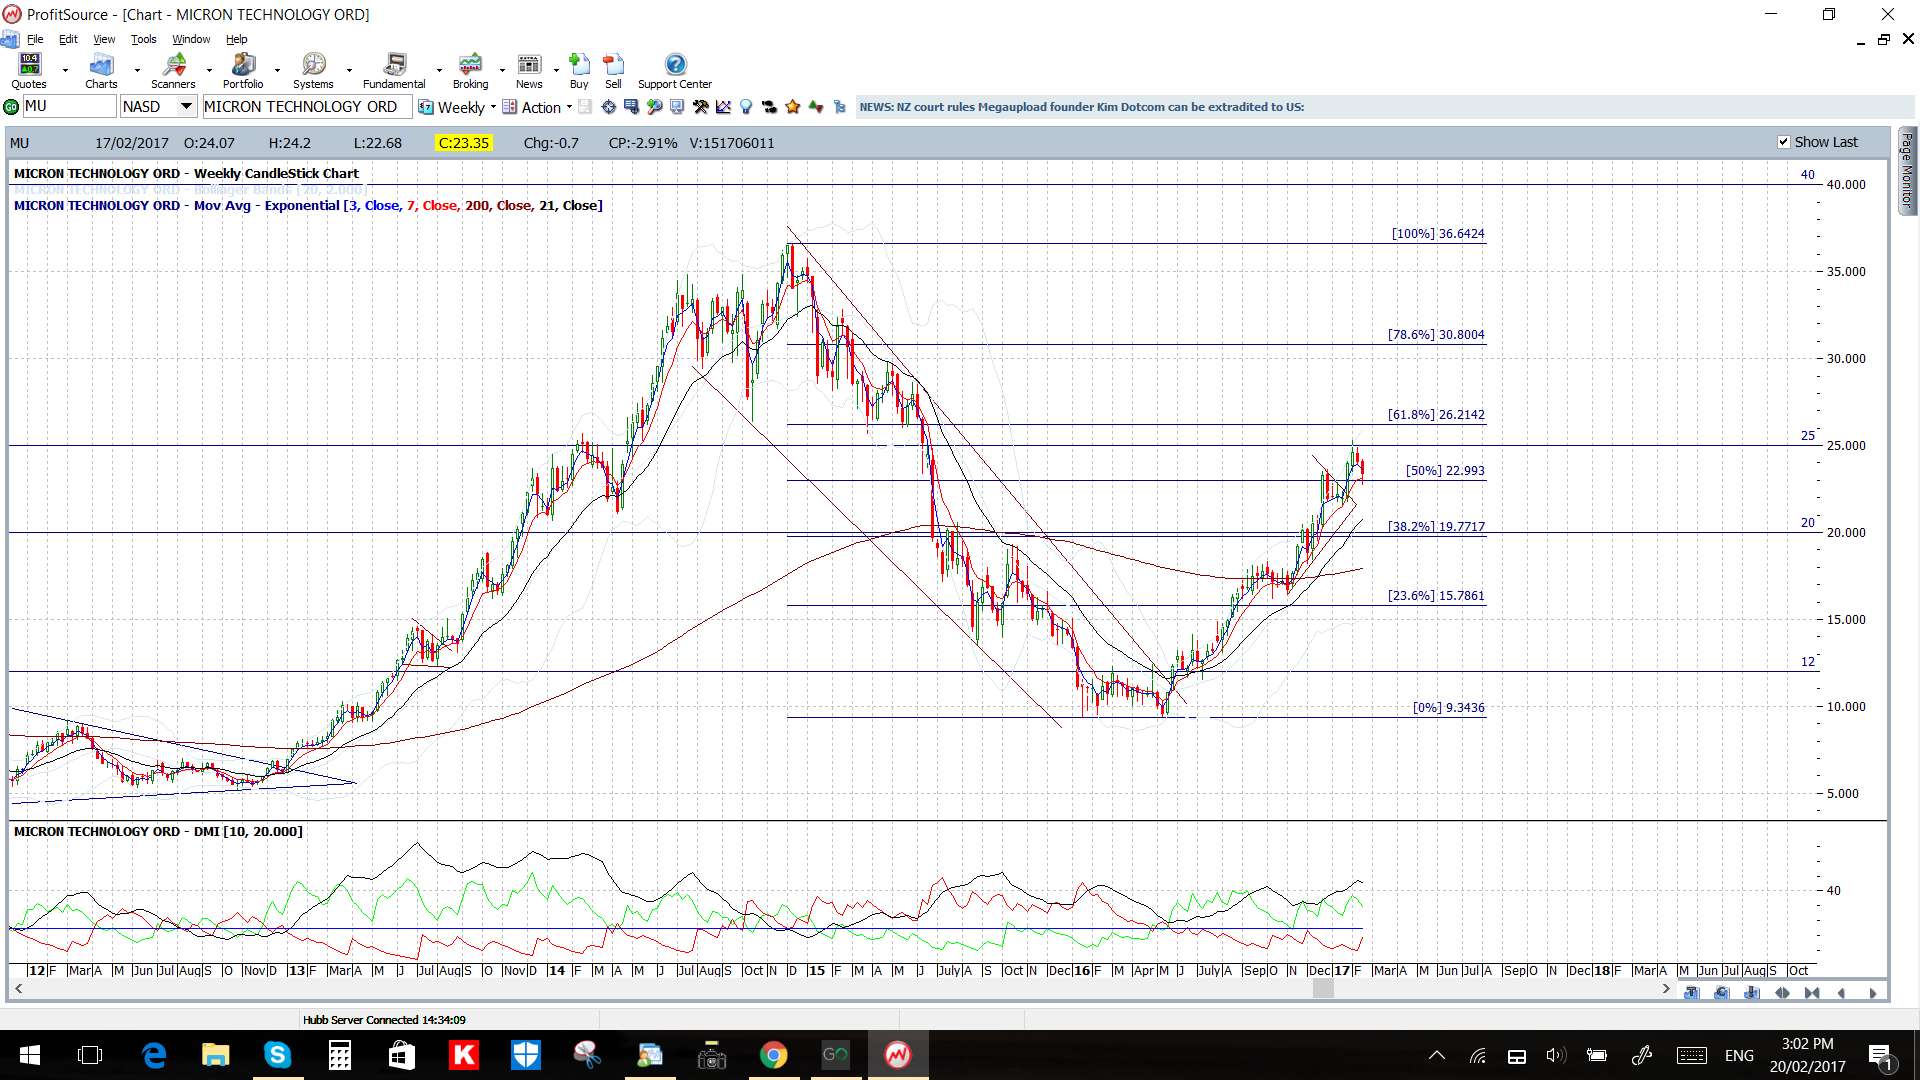
MU: Micron Technology: this gave a 300% gain:
2016

2017
2018

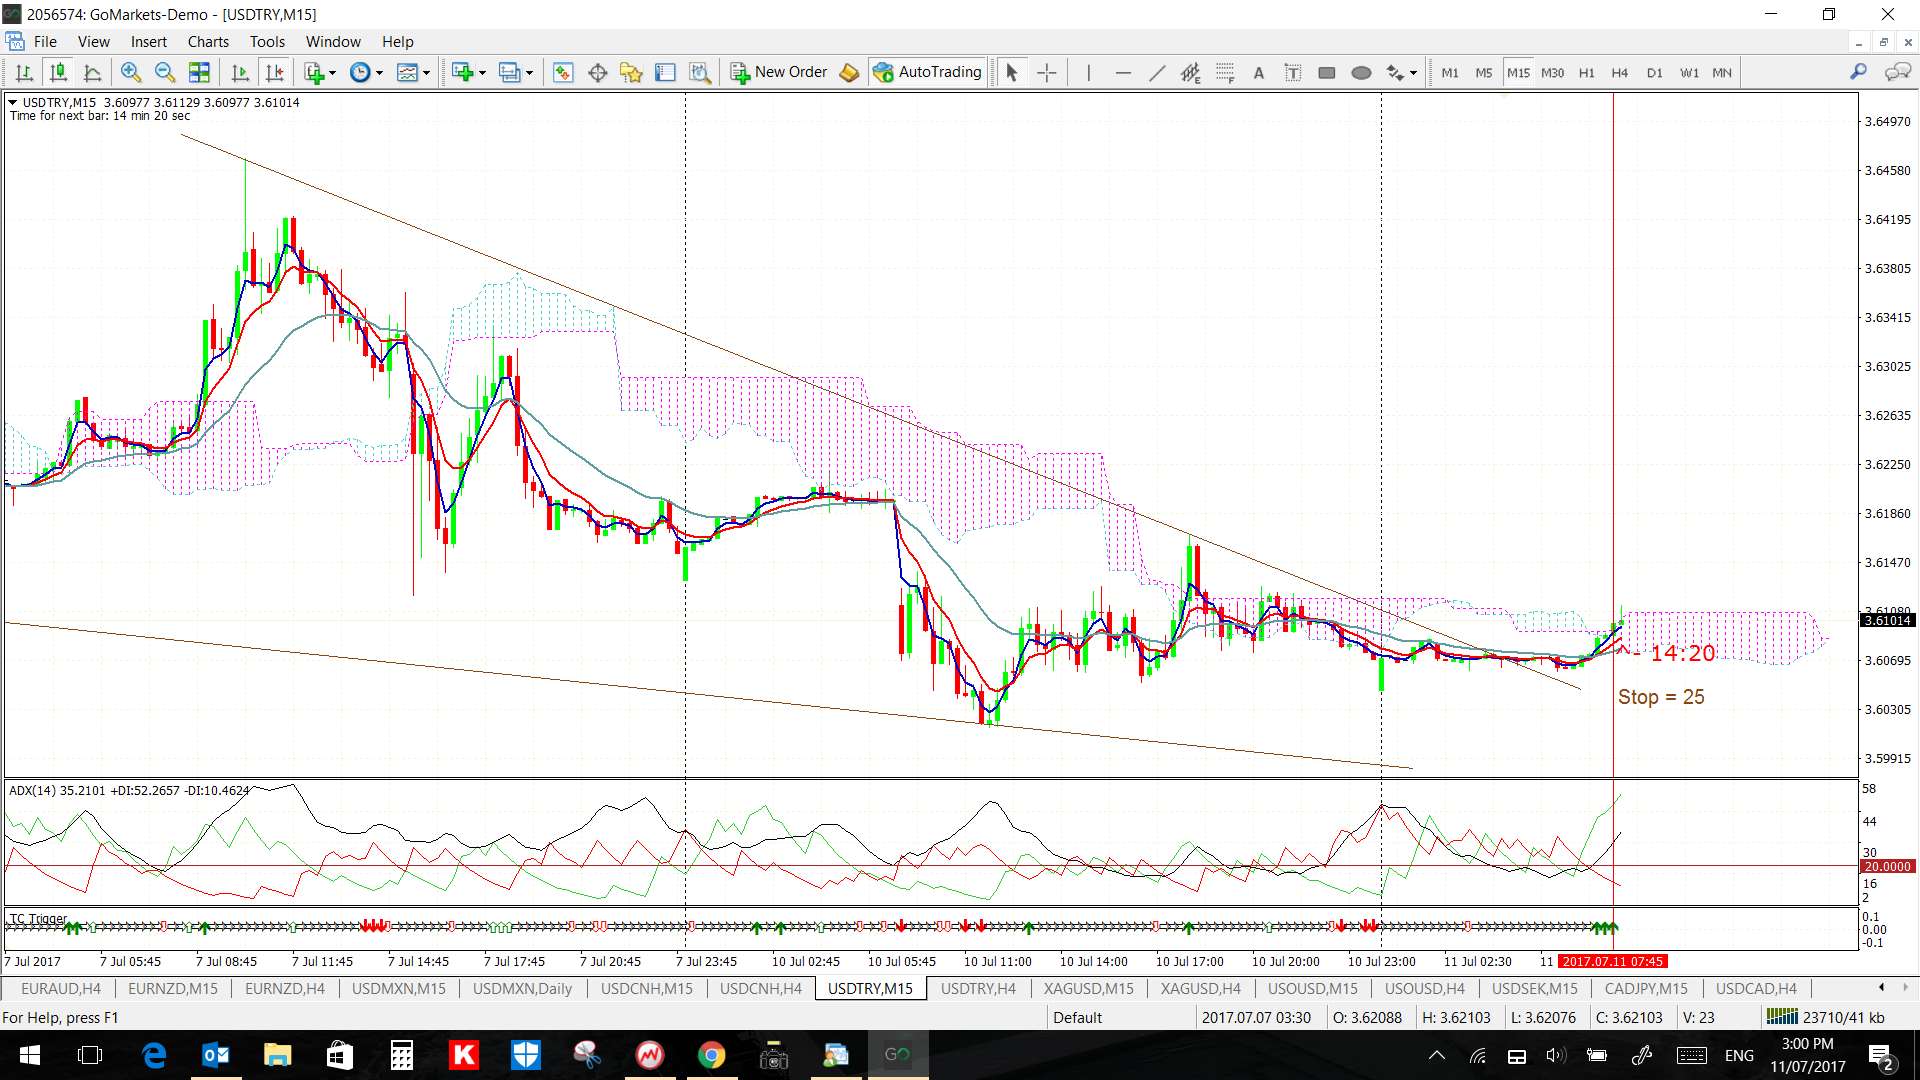
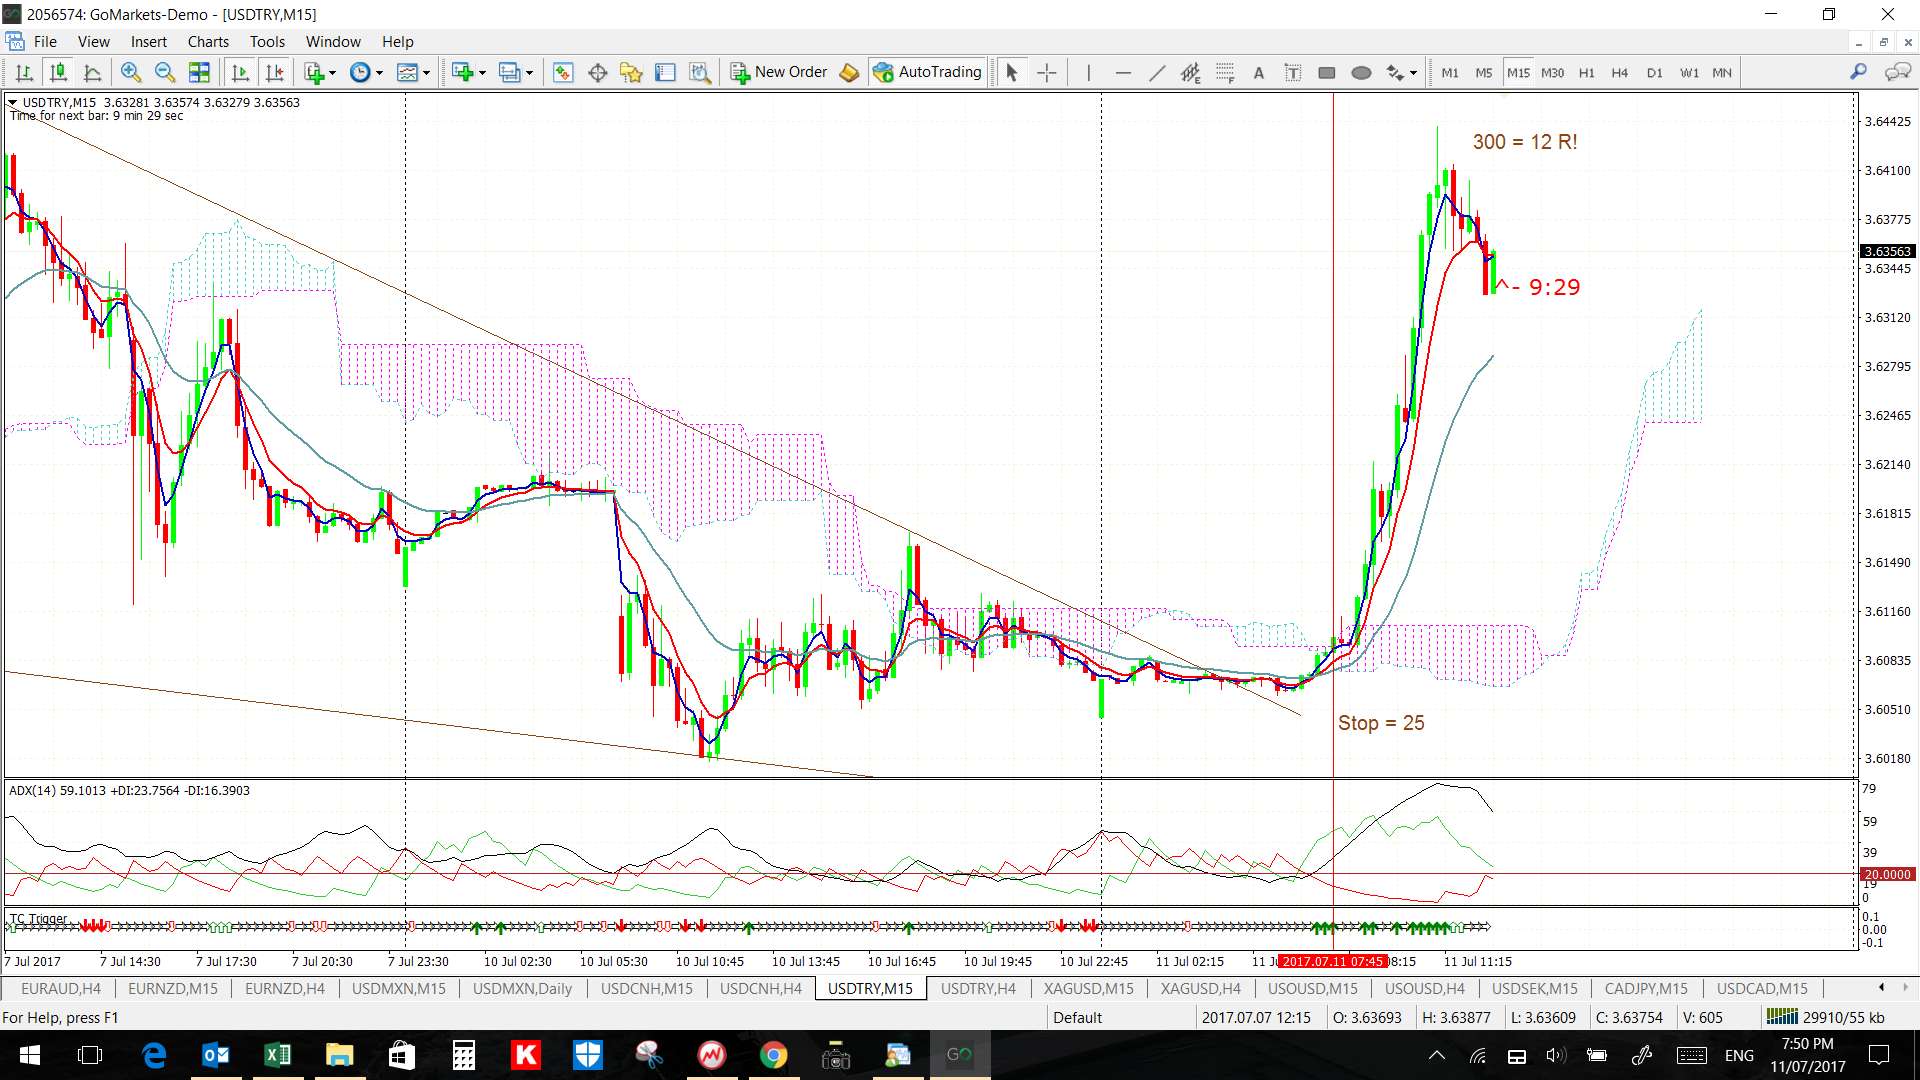
USD/TRY 4hr: this gave a 12-fold return on Risk:
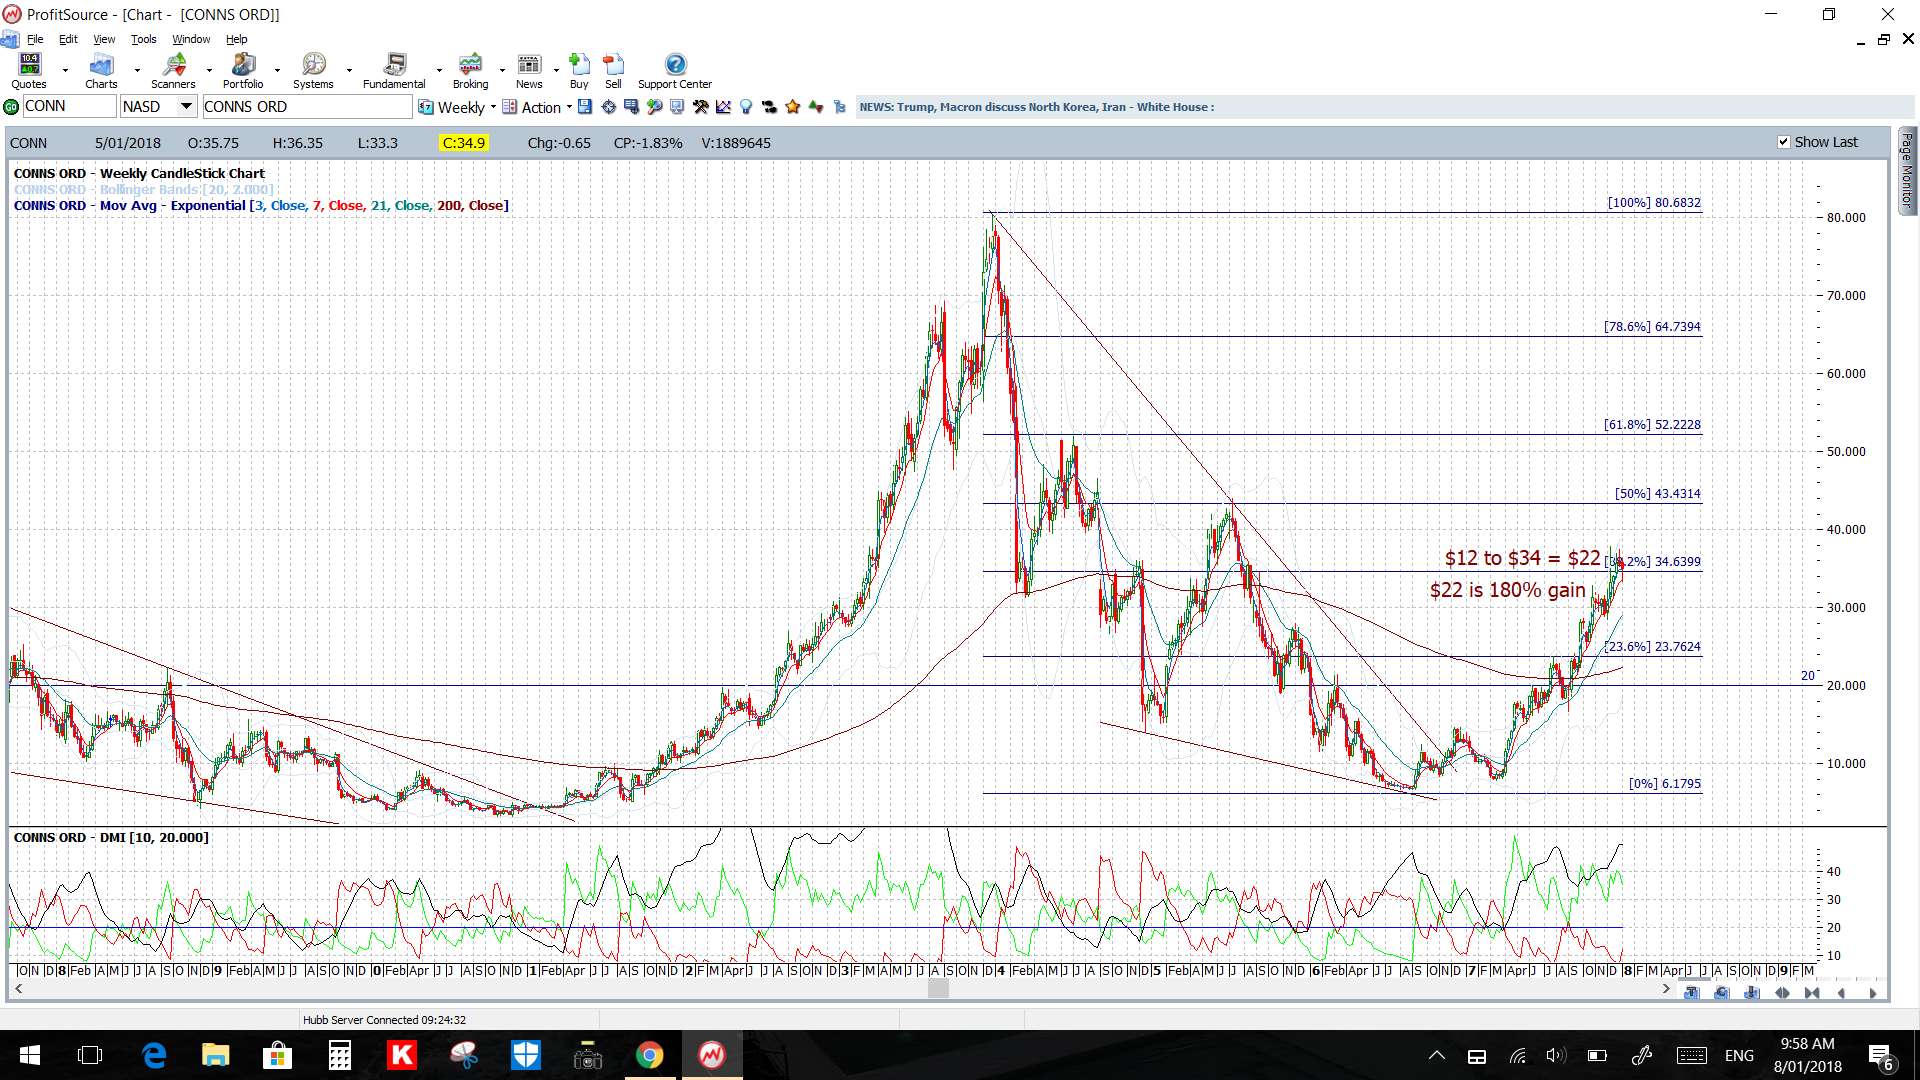
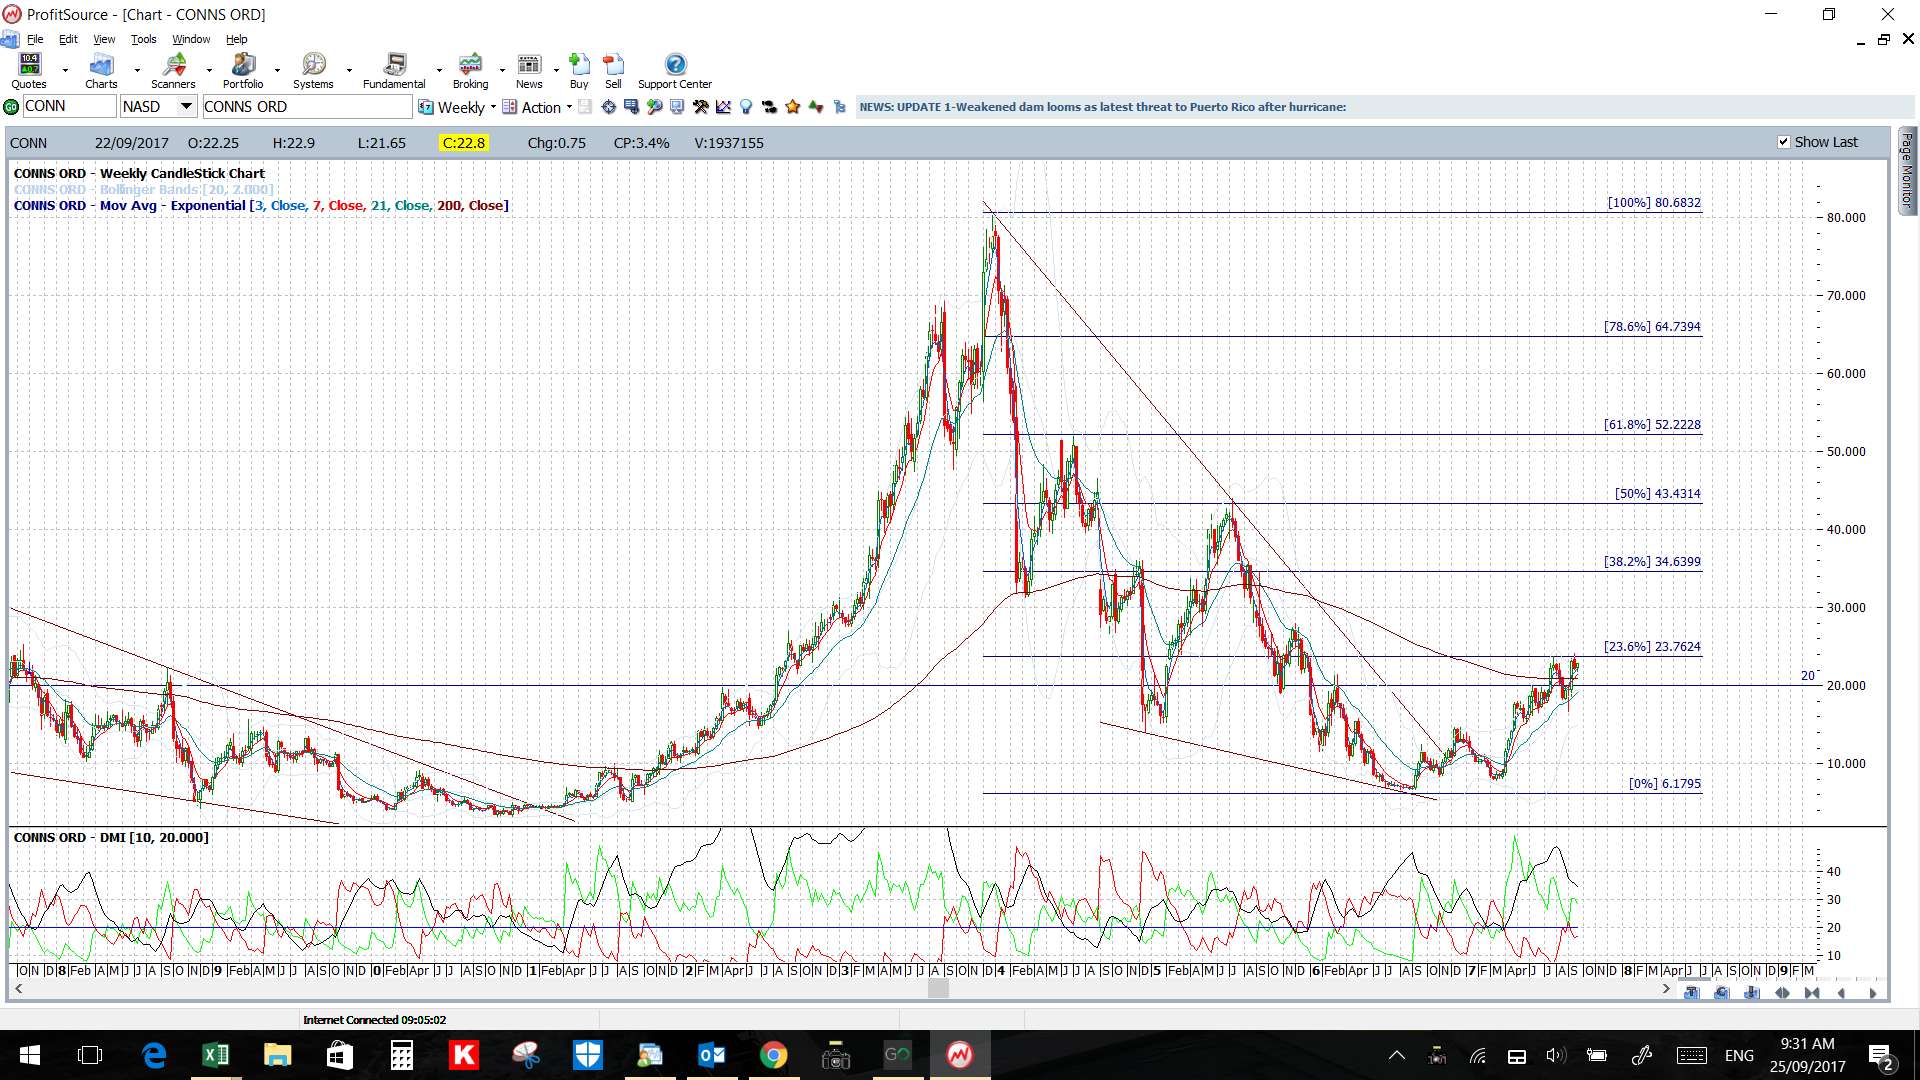
CONN: Conns: this gave a 180% gain:
2017
2018