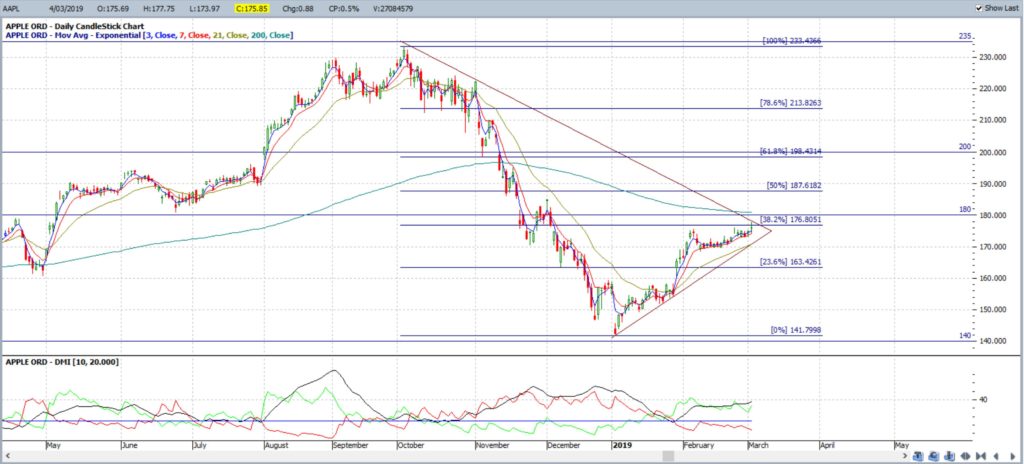
Apple’s stock price declined for the last three months of 2018 but the bounce off $140 and recovery for the first two months of 2019 has price action shaping up in a symmetrical triangle. The advantage of such a pattern is that it gives traders trend lines to watch for any momentum-based breakout. In this post I look at the levels I think are worth monitoring for Apple stock price as it trades right at the apex of this weekly chart triangle.
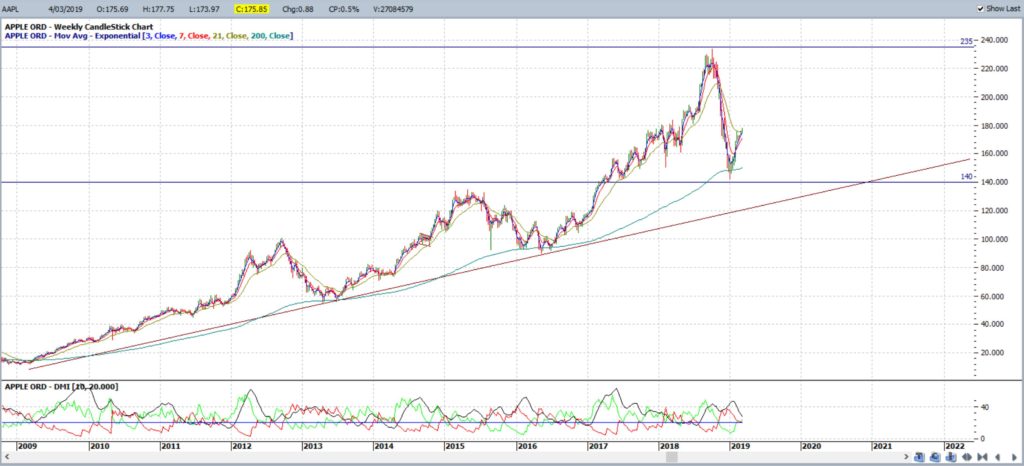
AAPL weekly: there is a long-term support trend line that has been in force since the 2008 Global Financial Crisis (GFC) and this remains intact. The $235 level is upper level resistance and price retreated from this region last October before finding support at the $140 level:
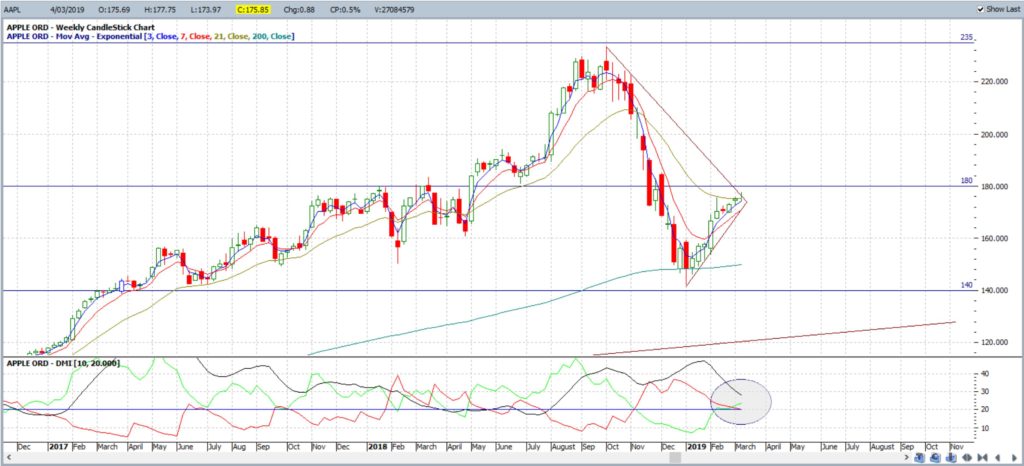
AAPL weekly expanded: expanding price action on this weekly time frame shows a triangle forming up on the weekly chart. Price action is right up in the apex of this triangle and this aligns near the $180 S/R level giving traders a region to watch for any momentum breakout. Momentum is currently declining but watch for any uptick on the ADX:
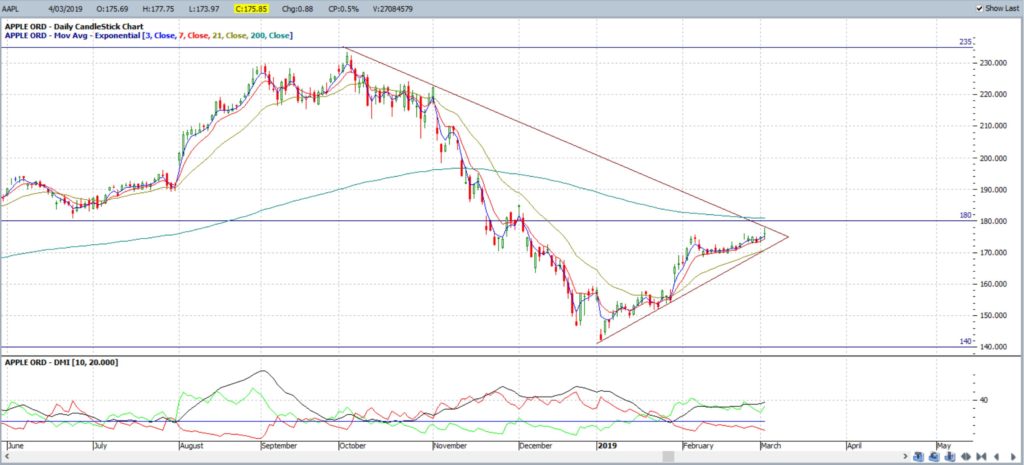
AAPL daily: the daily chart shows that momentum has been bullish throughout February:
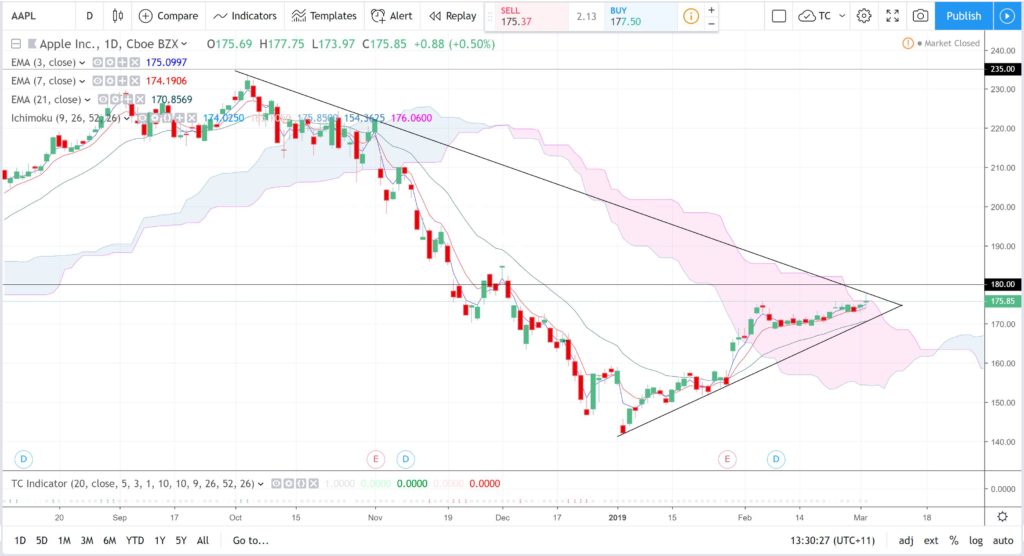
AAPL daily Cloud: the Ichimoku chart below reveals how price action has not been above the Cloud since last October 2018 but is currently trying to break back up into this region. Watch for any new break and hold above the Cloud, as well as upper trend line and $180 regions, as this would represent a bullish shift:
AAPL daily + Fibonacci retracement: Any break and hold above the $180, triangle trend line and daily Cloud would have me looking to the $200 level as this is near the daily chart’s 61.8% fib and previous S/R:
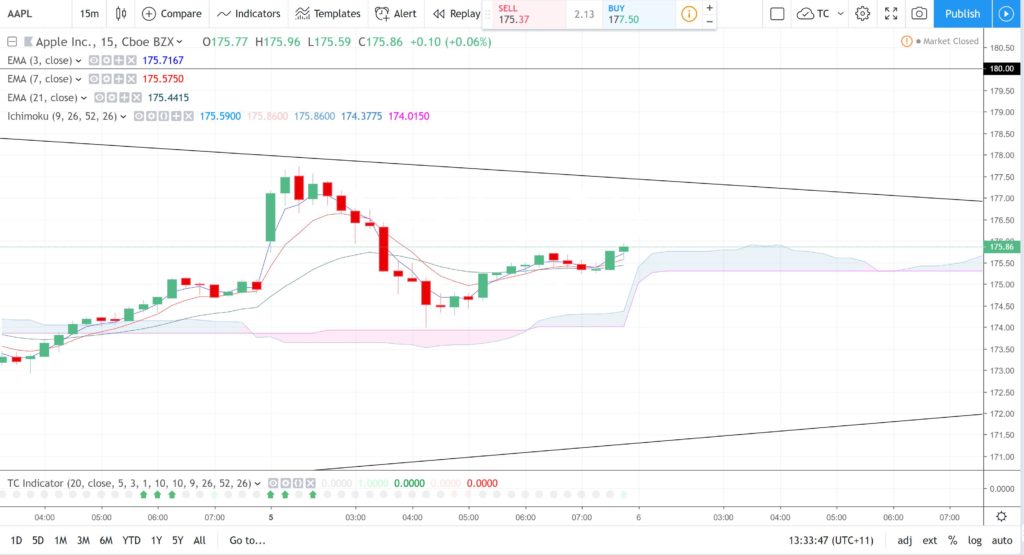
AAPL 15 min: short term traders have trend lines to add in to their trade entry signal mix:
Summary: Apple is currently trading within a weekly / daily symmetrical triangle pattern with the apex aligning near $180 S/R. Traders should watch for any momentum trend line breakout as this would also place price action above the resistance of the $180 level and daily Cloud. The target for any bullish trend line breakout would be $200 as this is near the weekly / daily 61.8% fib and previous S/R.


