


Descending Wedge
There are many technical charting patterns that traders can monitor to help them identify price action breakouts. These include Ascending Triangles, Descending Triangles, Bull Flags and Bear Flags as just some but, for me, the pattern I find that has the greatest success rate is that of the Descending Wedge.
The Descending Wedge is a pattern that forms up when price action has pulled back from a High and consolidates in a declining move. The rate of printing lower Lows eventually eases faster than the rate of printing lower Highs though and this generates a squeeze type of move yielding the wedge-shaped pattern; as shown in Figure 1 below.
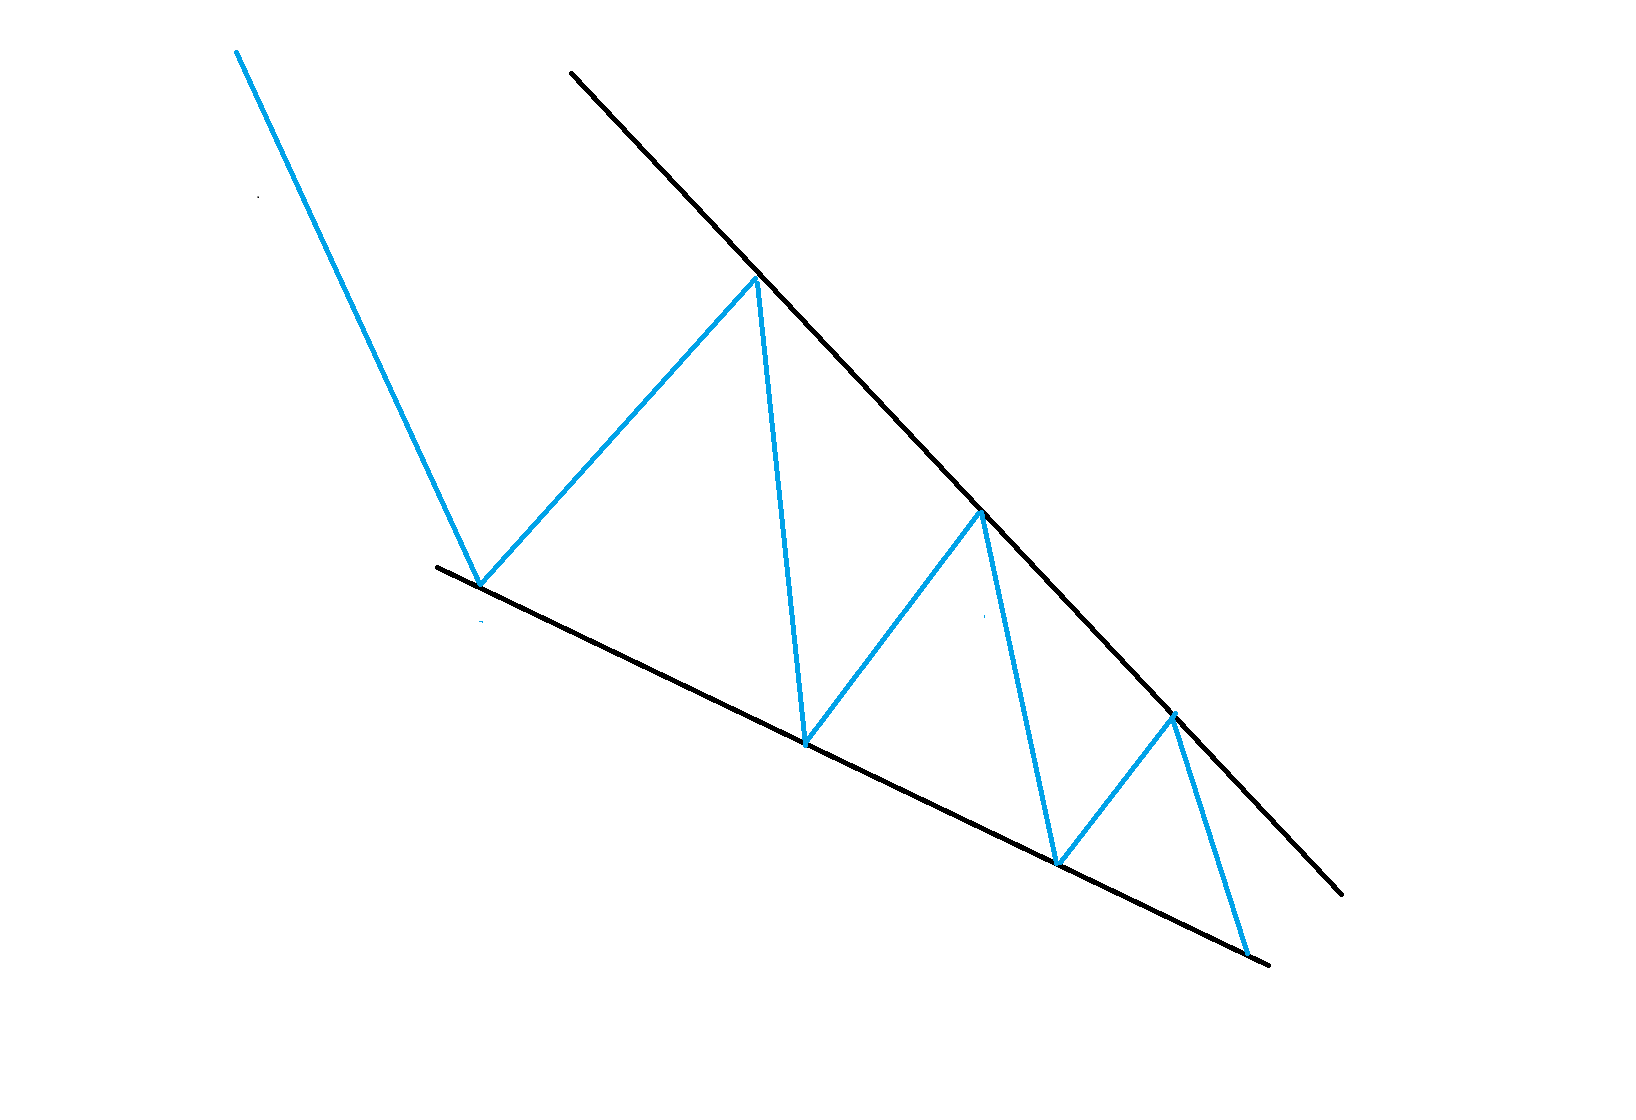
Figure 1: Descending Wedge
The breakout from such a pattern can be either up or down but price action, more often than not, breaks to the upside earning this the classification of a bullish reversal pattern. My experience with these patterns is that they demonstrate a high probability of breaking out to the upside, as illustrated in Figure 2 below, and have been the most reliable of all chart patterns that I monitor.
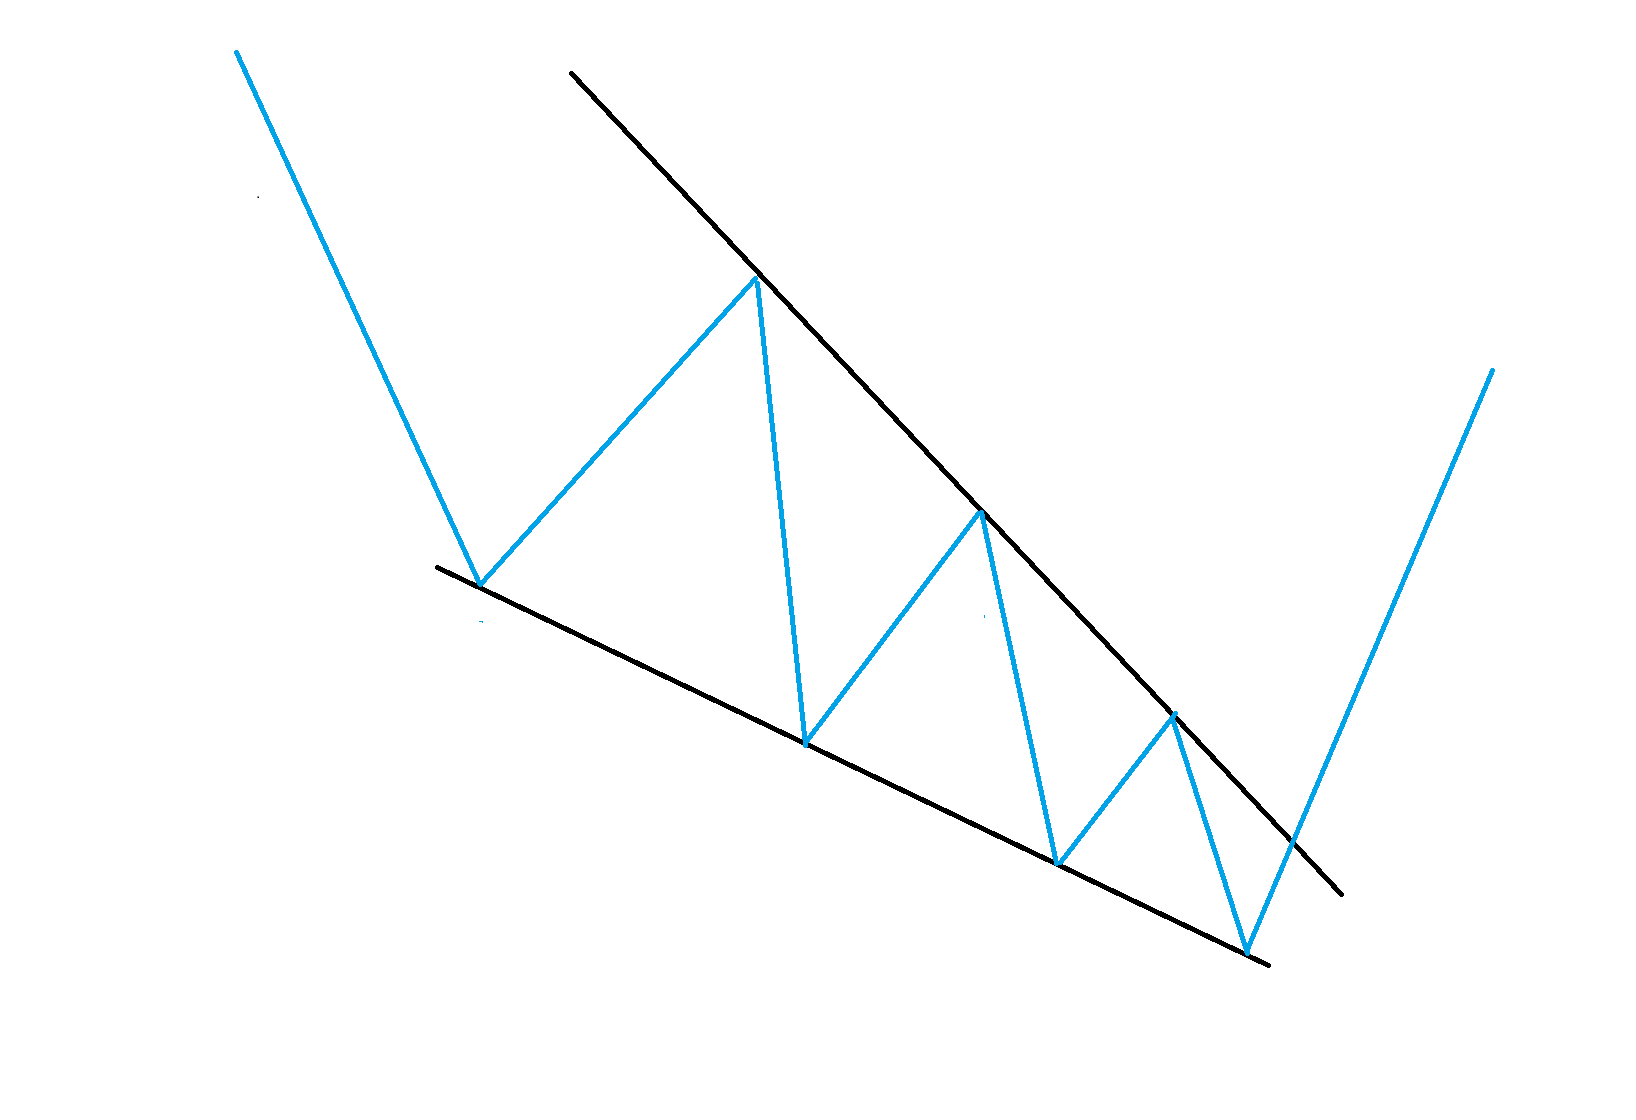
Figure 2: Descending Wedge with breakout follow-through
Watching for a bullish-reversal Descending Wedge breakout is really just another form of looking for Mean Reversion but on the longer time-frame, weekly chart scale. Trends do not continue in straight lines forever and so watching for any pullback / mean reversion is not unreasonable.
In this article I outline how to identifying and track a Descending Wedge breakout using three recent stock examples; FMG, EBAY and MRVL. There will also be an explanation of how I apply Fibonacci retracement to help identify potential targets for any bullish breakout.
The Descending Wedge
The following three examples using FMG.ASX, EBAY.NASDAQ and MRVL.NASDAQ illustrate how I monitor for Descending Wedge breakouts and identify potential targets for any breakout move.
Example 1: Fortescue Metals: FMG.asx
This is a stock I’ve been monitoring for a number of years. Price action prior to 2019 had been in a steady decline; as Figure 3 below reveals.
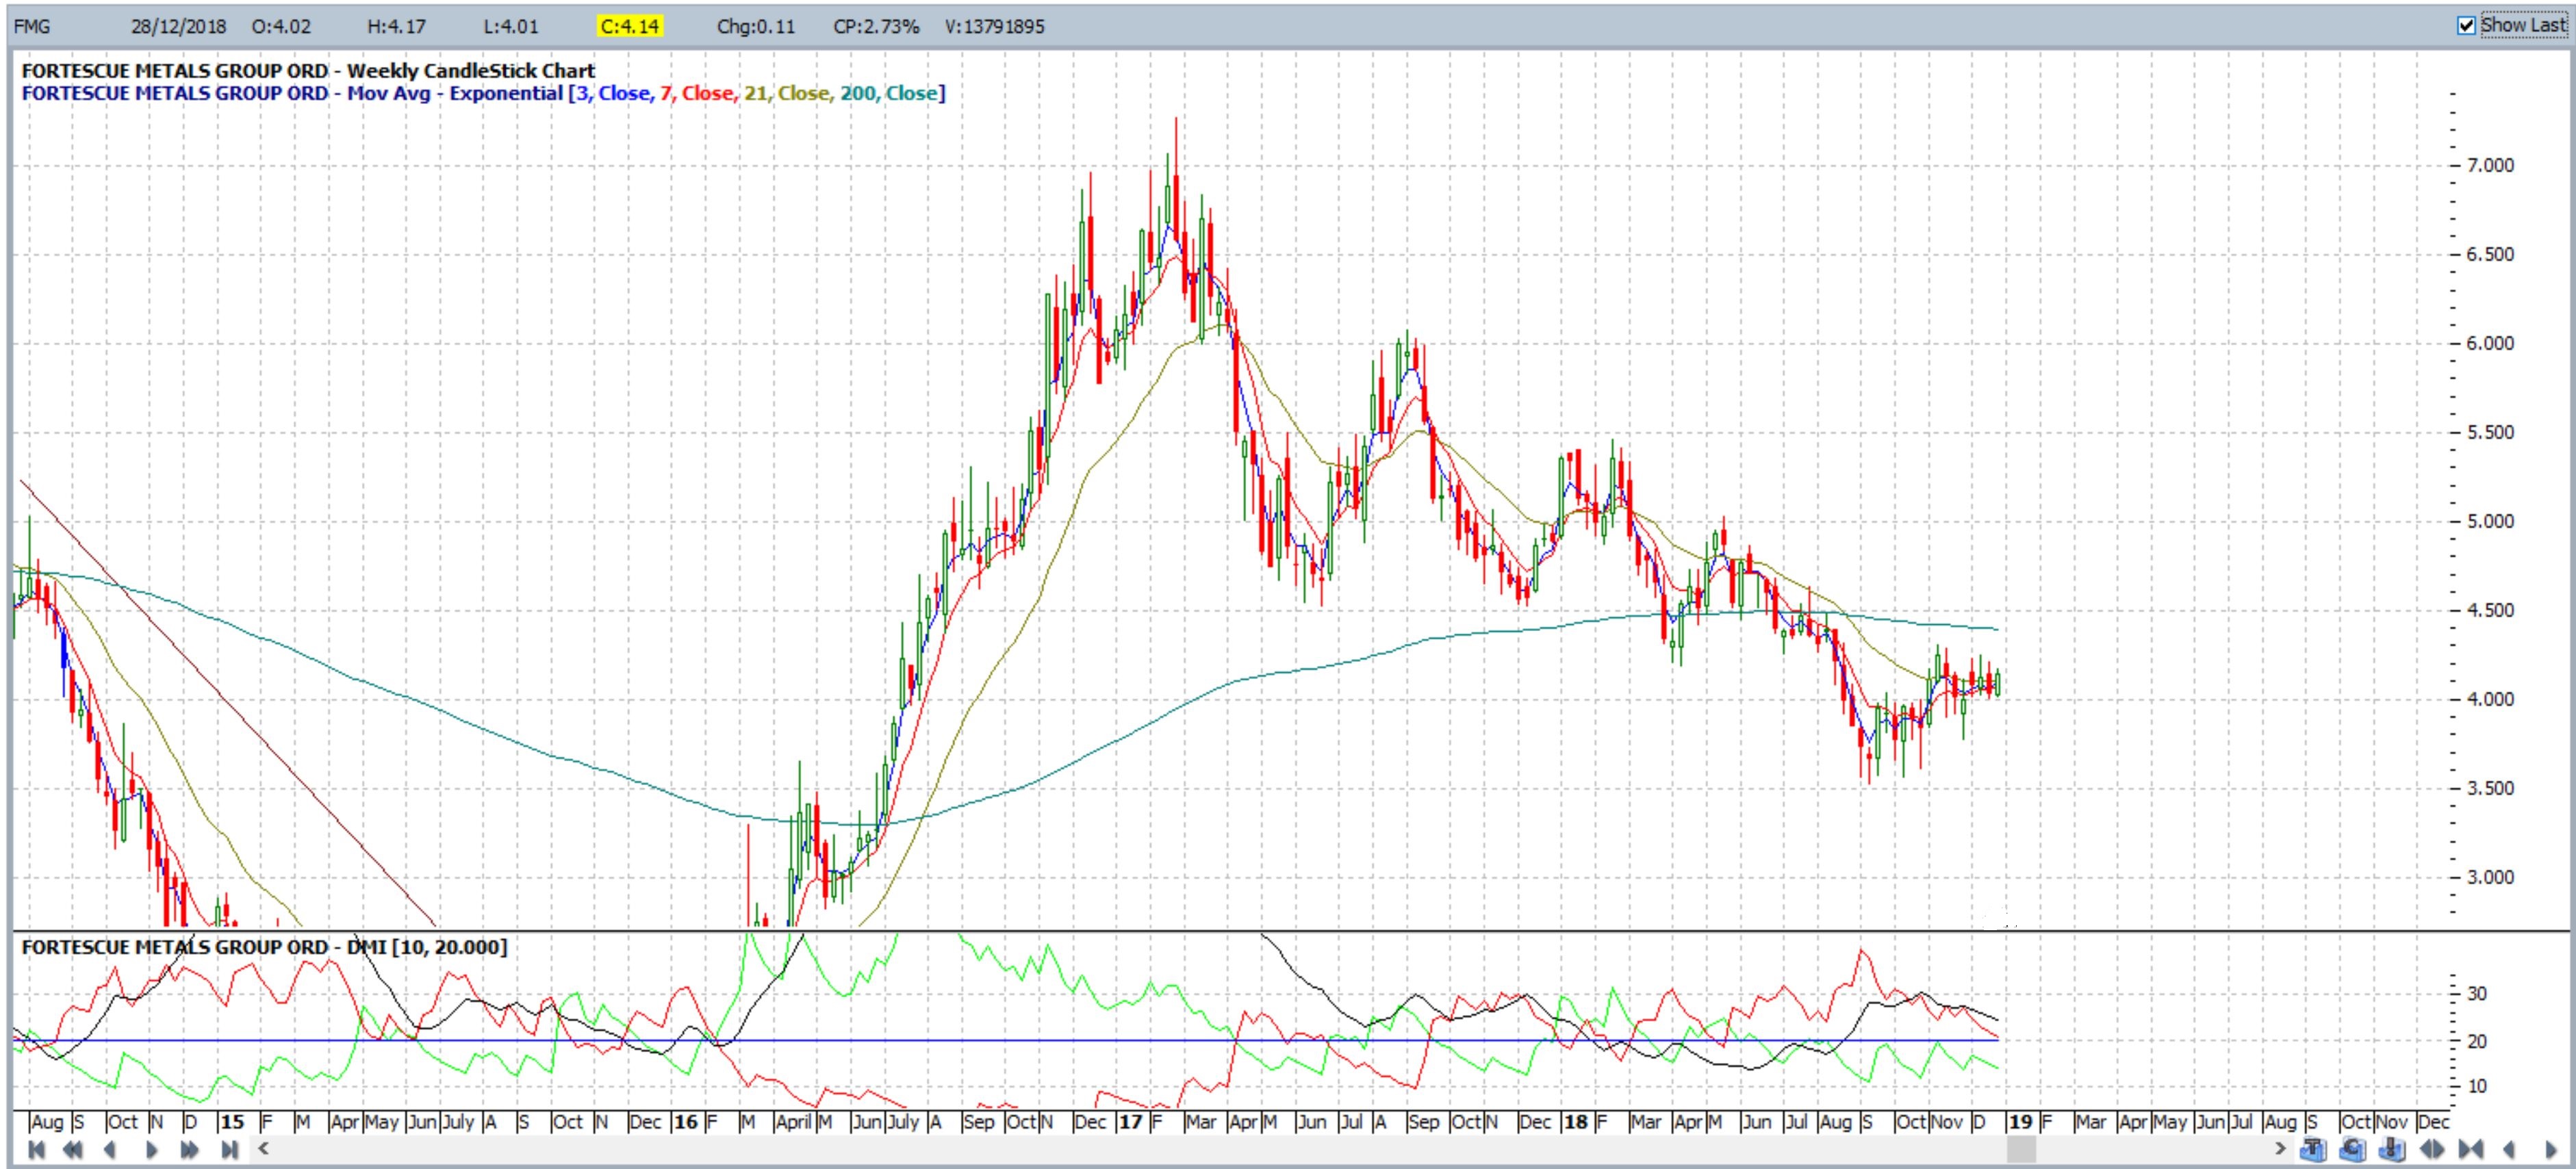
Figure 3: Price action decline for FMG weekly
The placement of trend lines on charts can be rather arbitrary and more in the eye of the beholder. However, after some time spent scanning charts you quickly learn how to identify various technical patterns. I recently noted how the weekly chart of FMG appeared to be shaping up in a Descending Wedge pattern, as shown in Figure 4 below, and placed trend lines in accordingly. This is where patience is then required as you need to wait and monitor each weekly candle close for any breakout and for any potential for mean reversion.
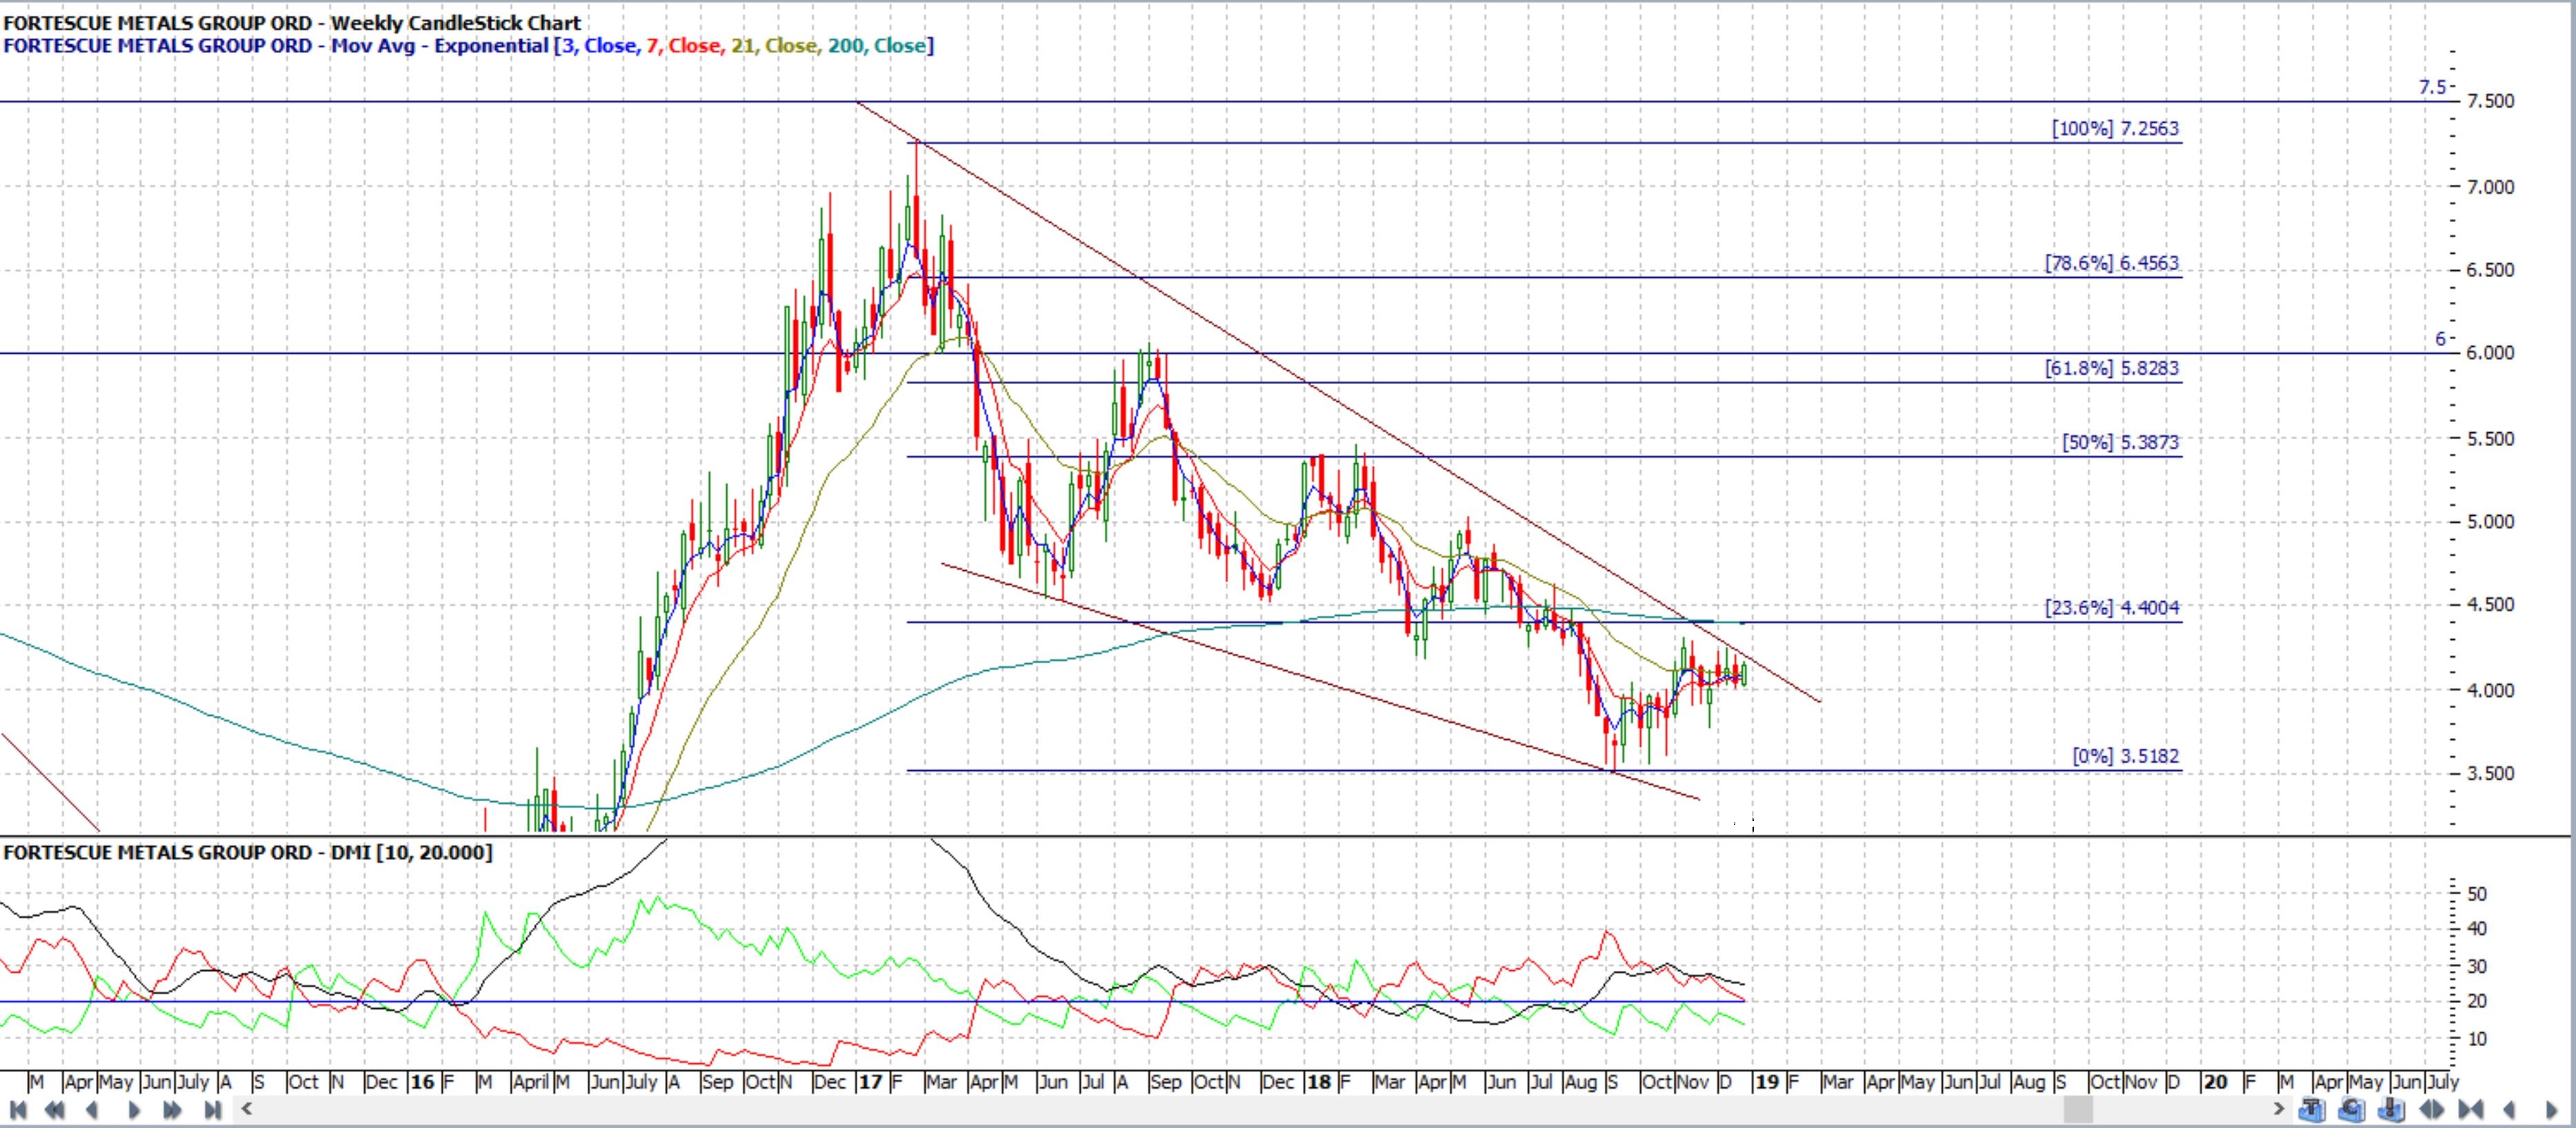
Figure 4: A Descending Wedge evident on FMG weekly
In the process of monitoring the weekly chart for any potential breakout, I also apply Fibonacci retracement to the swing Low move. That means applying the Fibonacci drawing tool from the highest High to the lowest Low. I then look to see if there is any price action concentration, in the form of prior Support or Resistance levels, near to either the 50% of 61.8% Fibonacci level. Fibonacci levels are widely used by traders and analysts and so they end up being more of a guide of herd mentality rather than any magical tool and the 50% and 61.8% levels are two of the more popular levels with traders.
I very often find that there will be an area of prior Support / Resistance near to the 61.8% Fibonacci level of these swing Low moves and this becomes the area I target for any bullish breakout move. Note, on the chart in Figure 3 above, how the 61.8% Fibonacci level aligns with a previous Support / Resistance zone near $6. This would be the first major target for any bullish breakout move on FMG. The second level would be the previous High, or the 100% Fibonacci level.
The chart in Figure 5 below shows that there was an eventual bullish breakout on FMG in early February 2019.
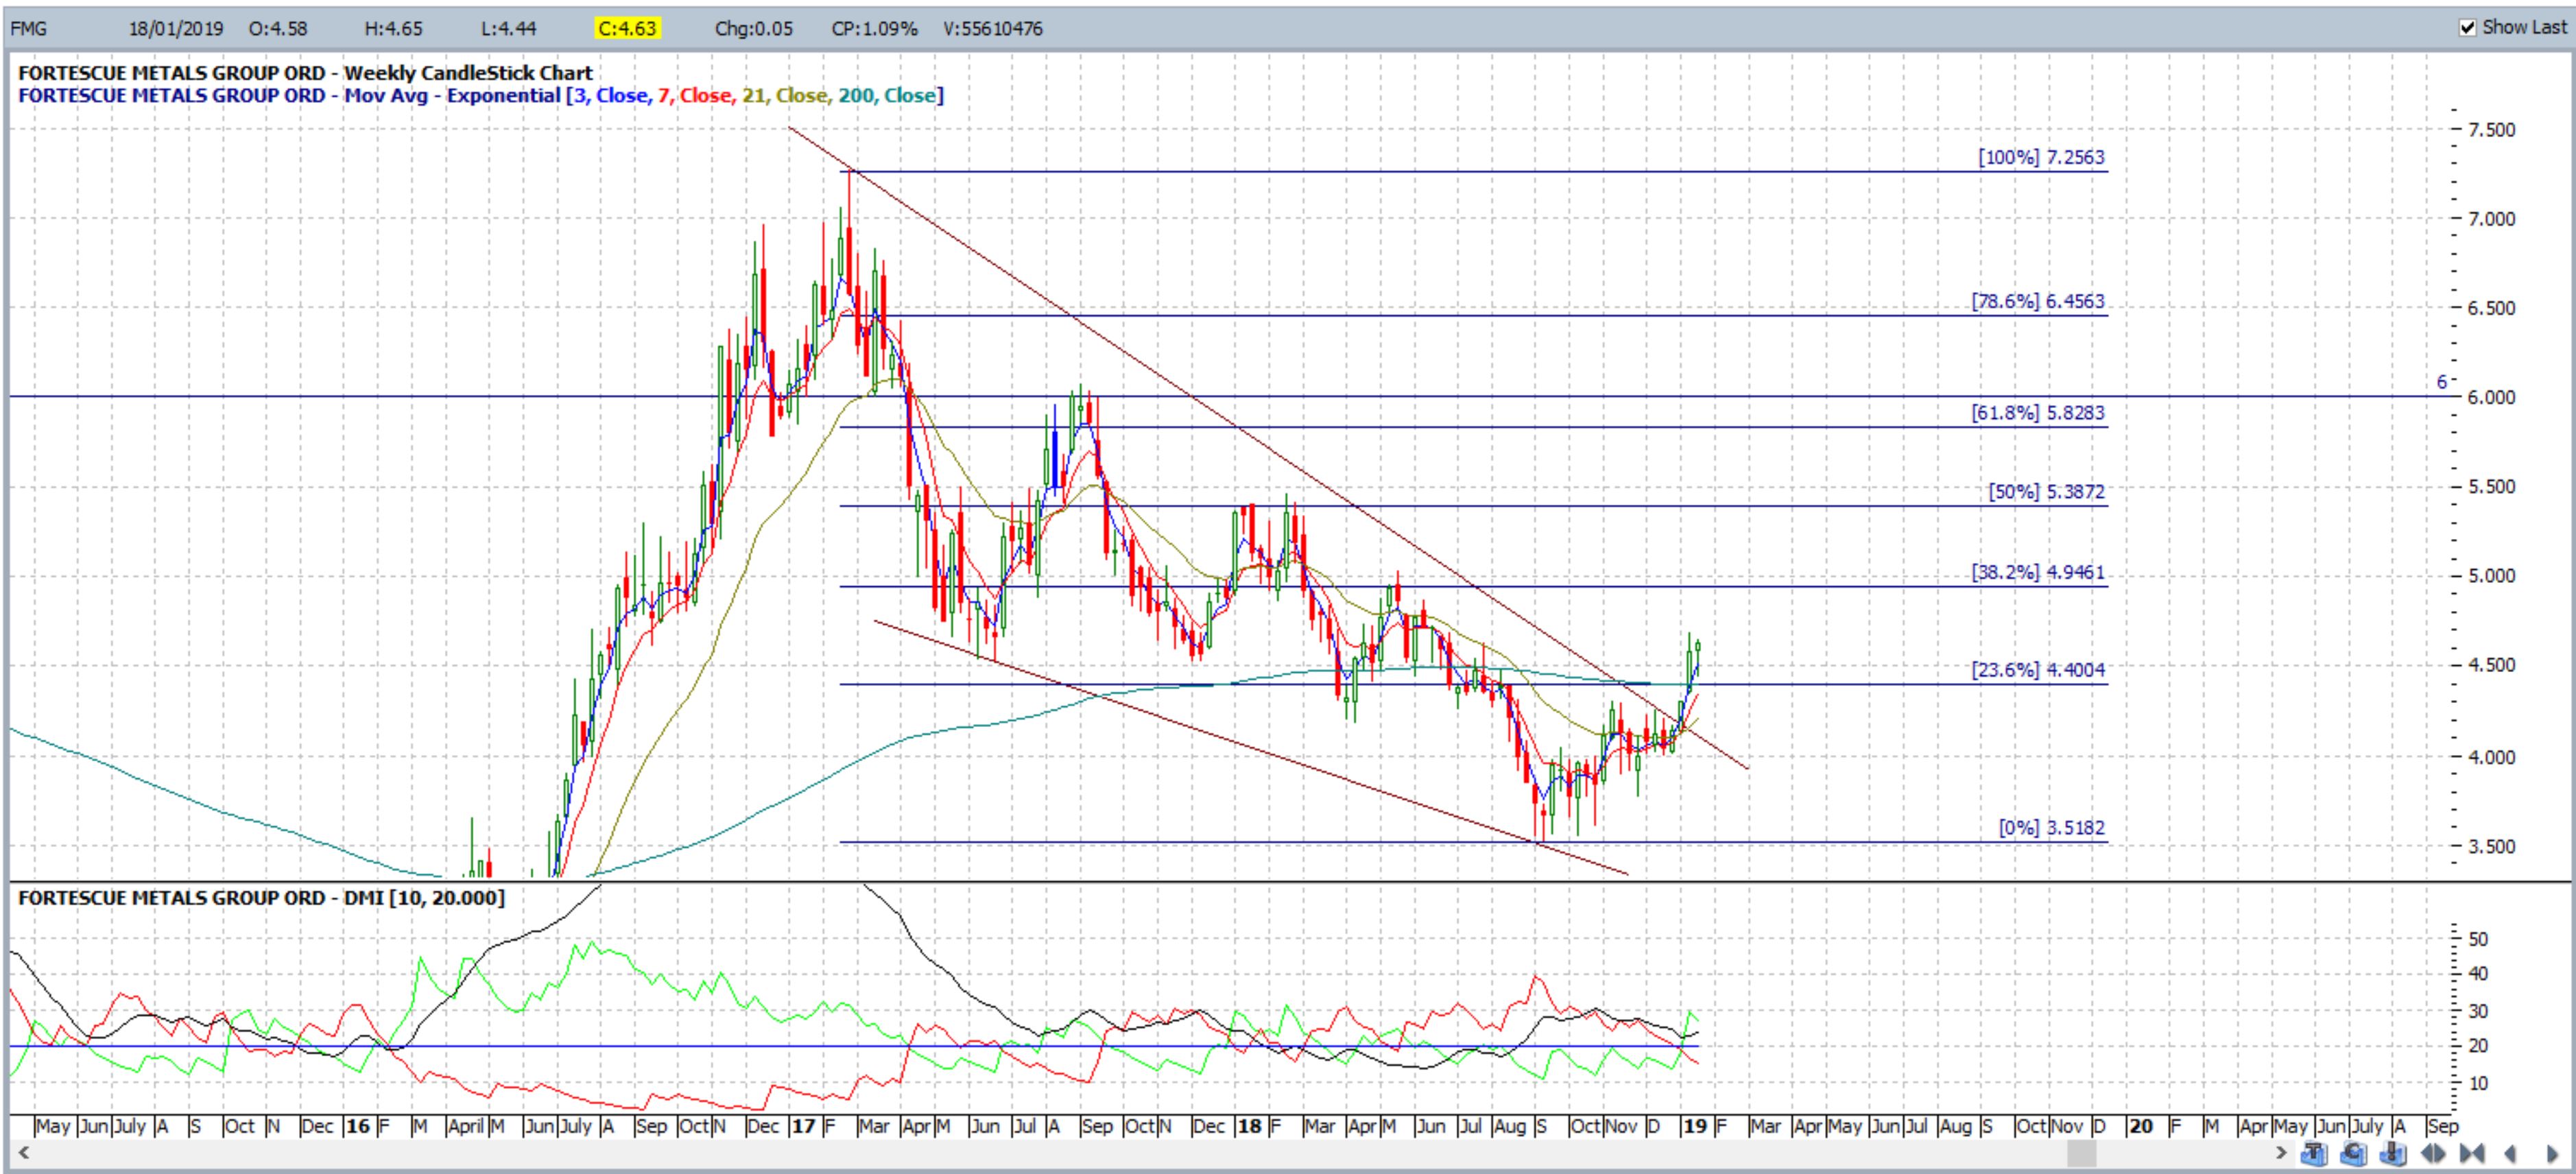
Figure 5: The new breakout on FMG
The chart in Figure 6 below shows that FMG rallied and reached the 61.8% Fibonacci target of $6 by February 2nd 2019 and so I will now be watching for any test of the 100% Fibonacci level, near $7.50.
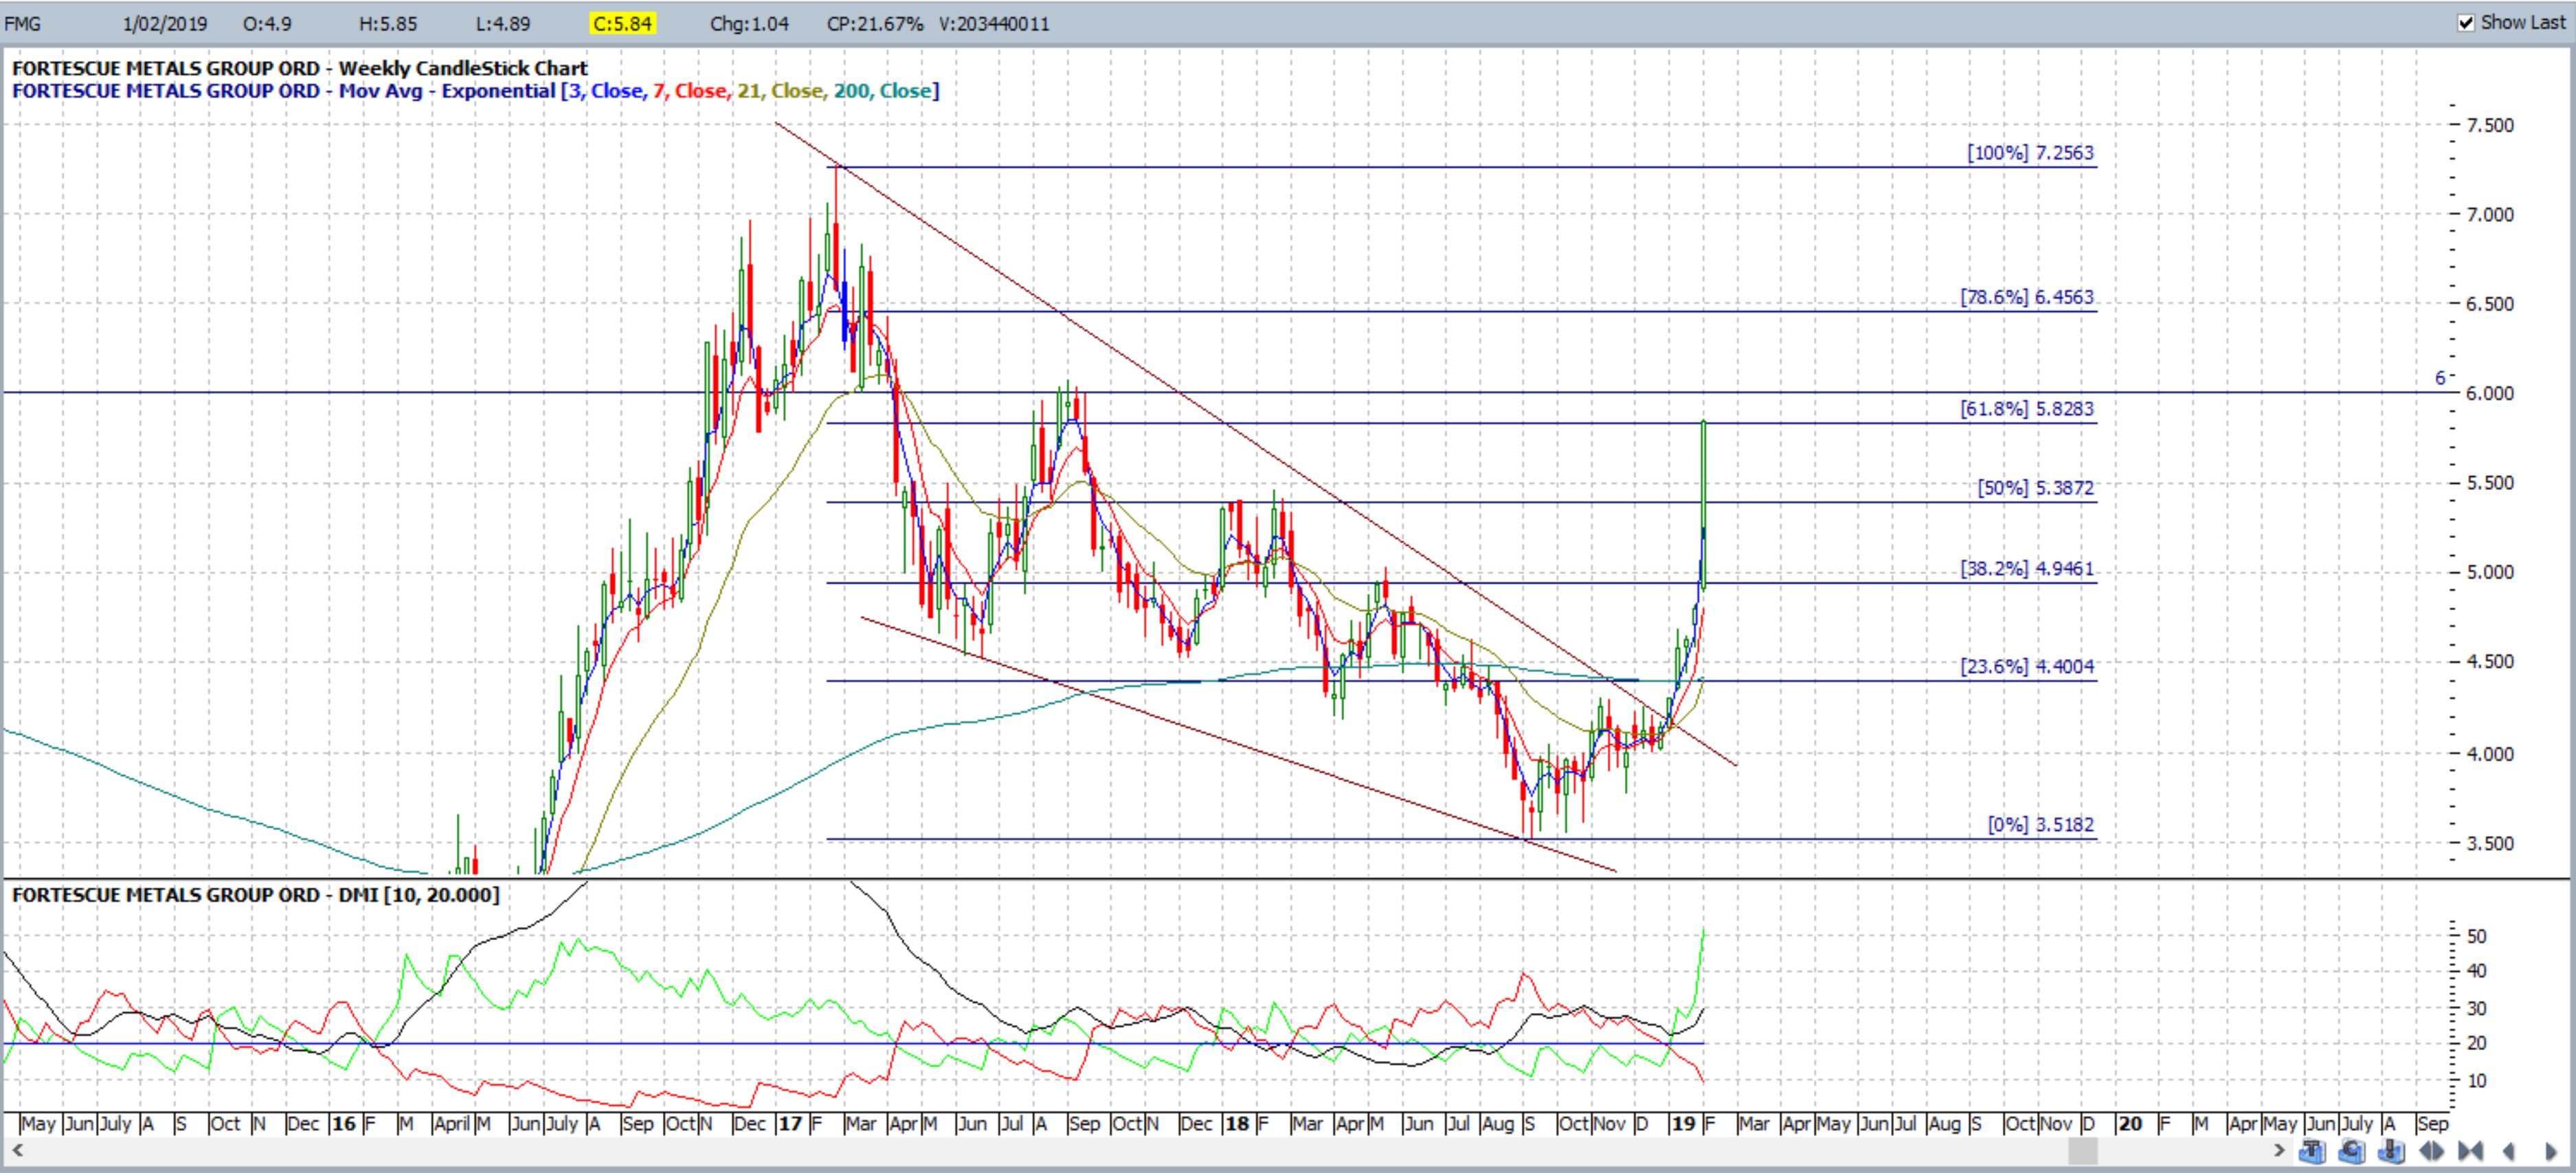
Figure 5: the breakout move on FMG has reached the weekly 61.8% Fibonacci level.
Example 2: EBAY.nasdaq
EBAY is an American NASDAQ stock but it, too, has recently broken out from a Descending Wedge pattern. The chart in Figure 6 below shows the Descending Wedge setting up prior to the January 2019 breakout. The nearest whole-number level closest to the 61.8% Fibonacci level is $40 and that is would be the target for any breakout move on EBAY.
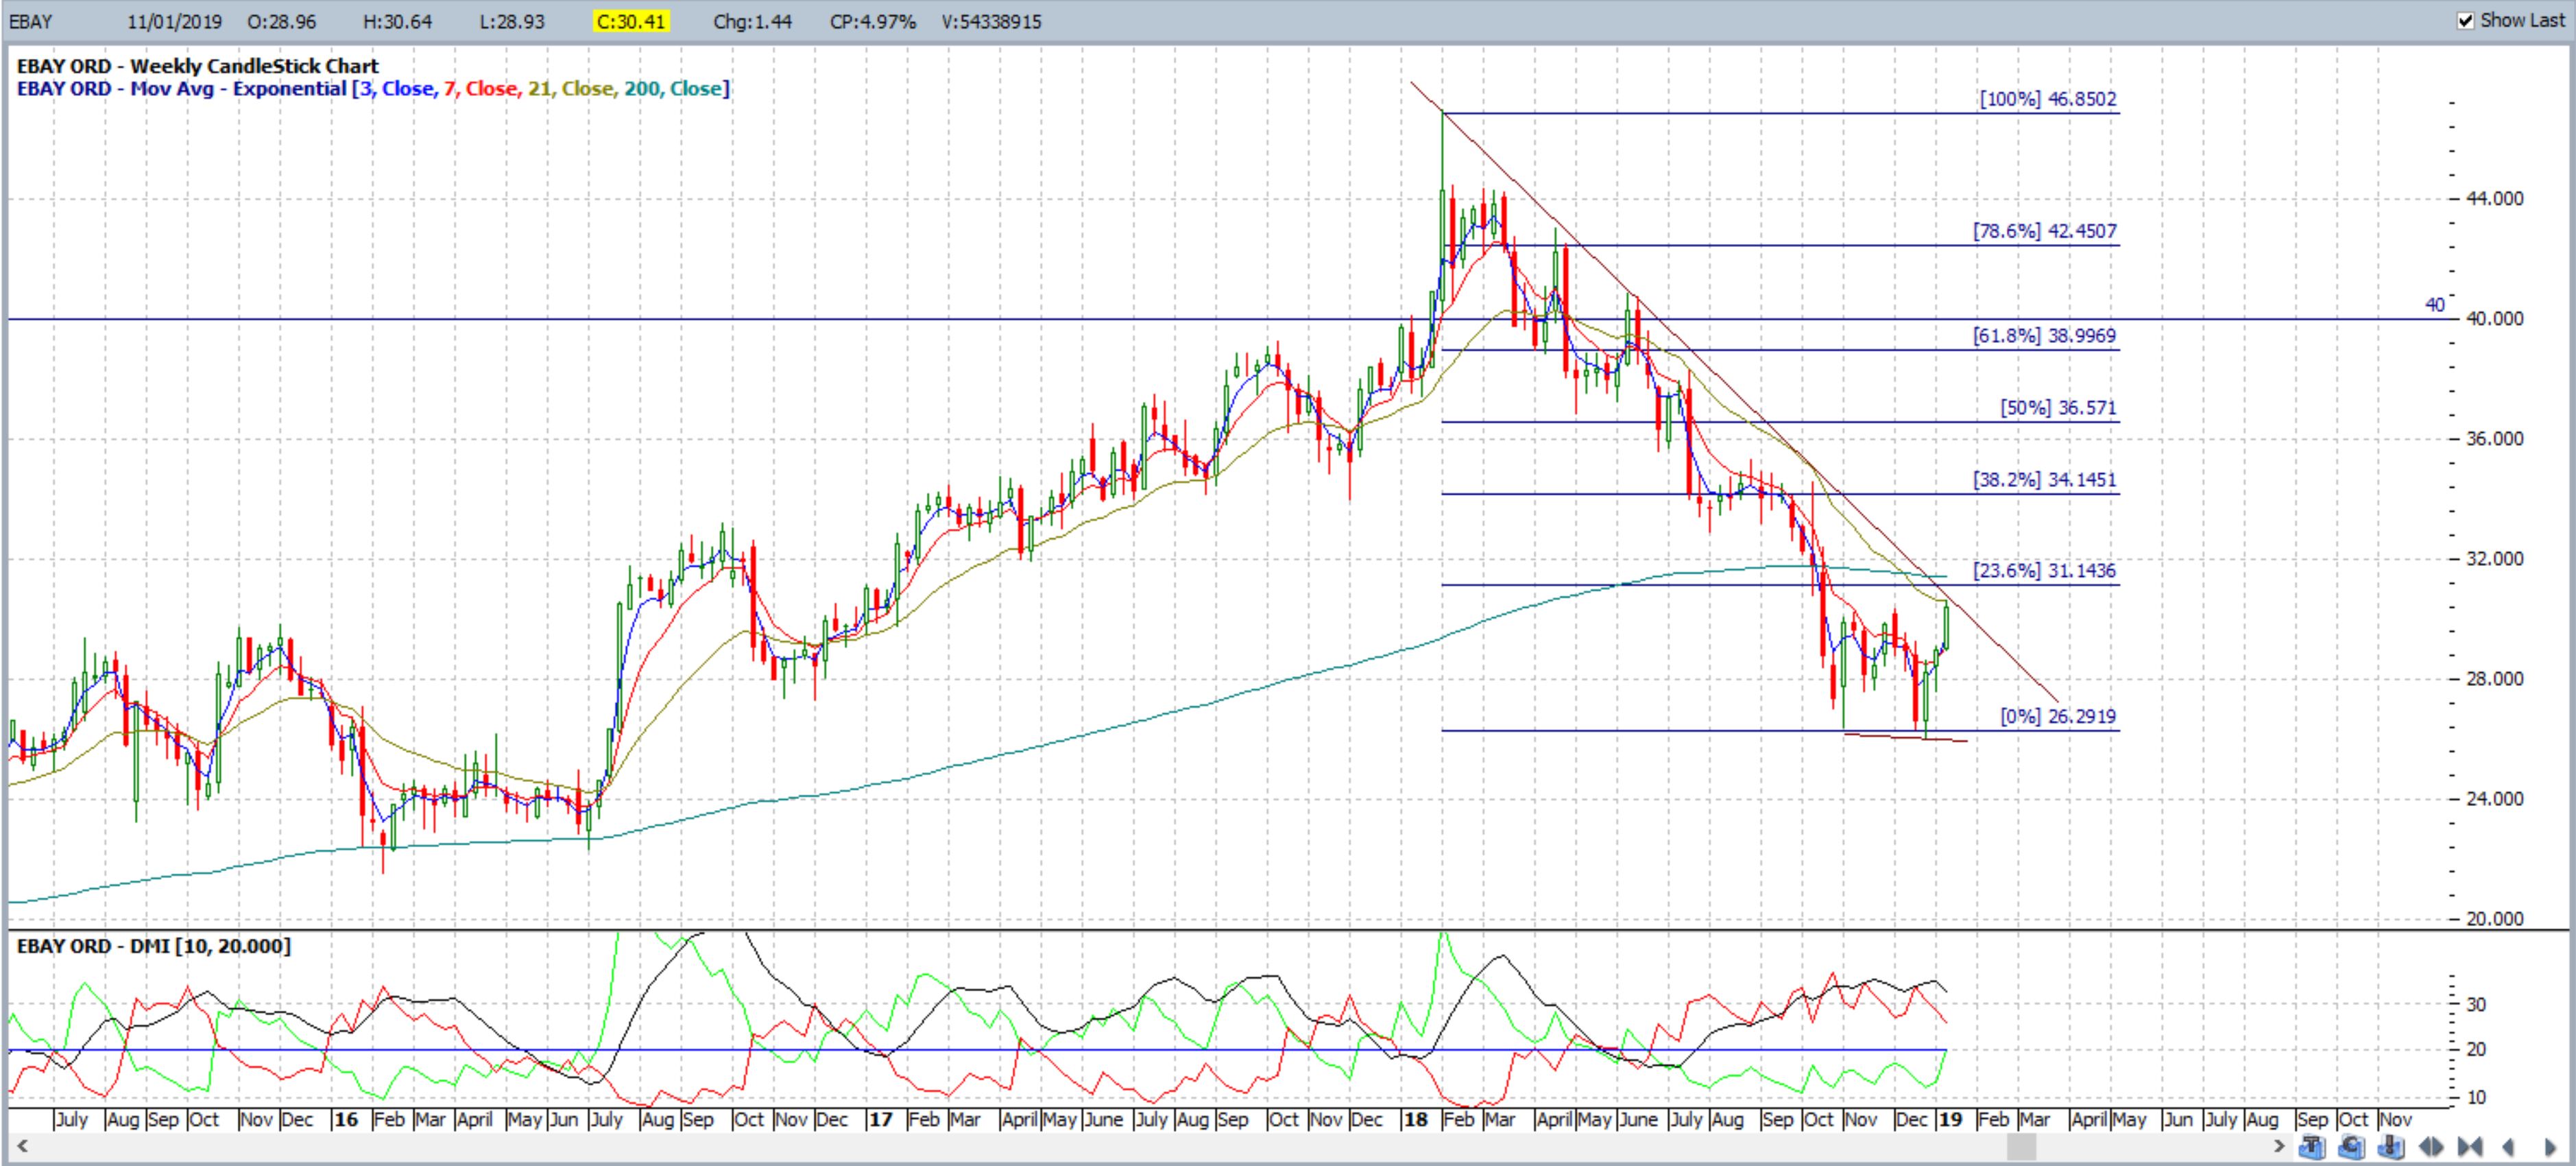
Figure 6: EBAY setting up in a Descending Wedge
Price action rallied after the January 2019 breakout rather quickly to reach the target of the 61.8% Fibonacci level by early March 2019; as shown in Figure 7 below.
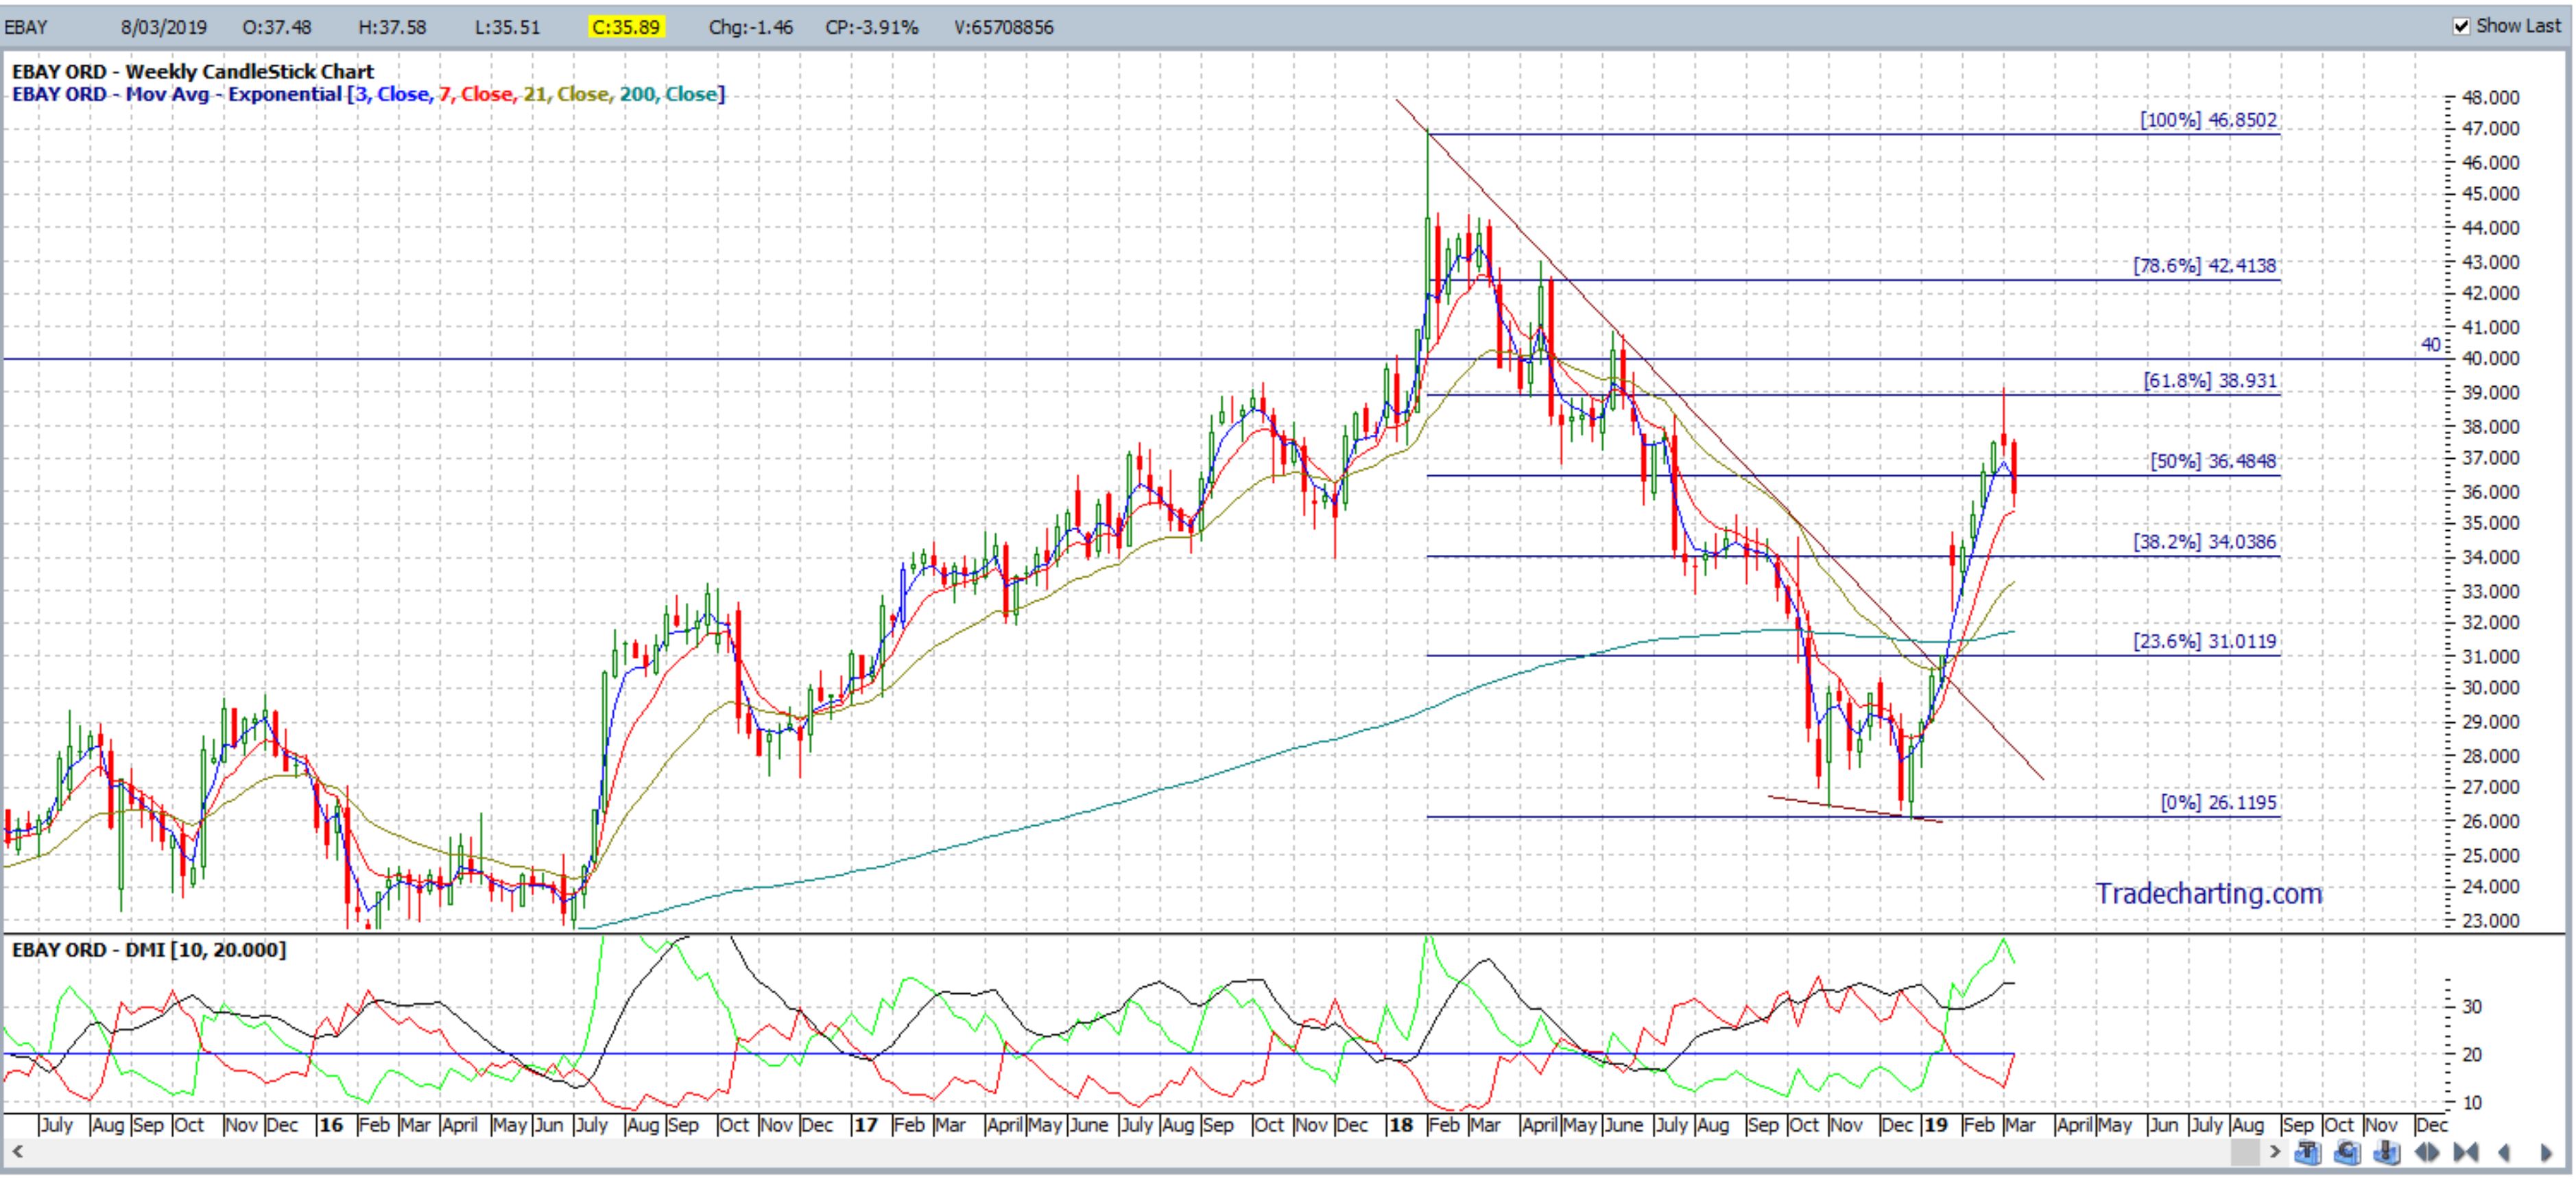
Figure 7: EBAY breaking out from the Descending Wedge
Example 3: Marvel Technology Group: MRVL.nasdaq
Marvel Technology went on a bullish run from January 2016 until March of 2018. Price action subsequently pulled back and the chart below shows that this pullback reached down to near the 61.8% Fibonacci of this swing High move. This price action also started to shape up in a Descending Wedge as the stock pulled back from March 2018 until January 2019 and this was noted in a post on my blog that was published on January 6th and Tweeted about on the same day:
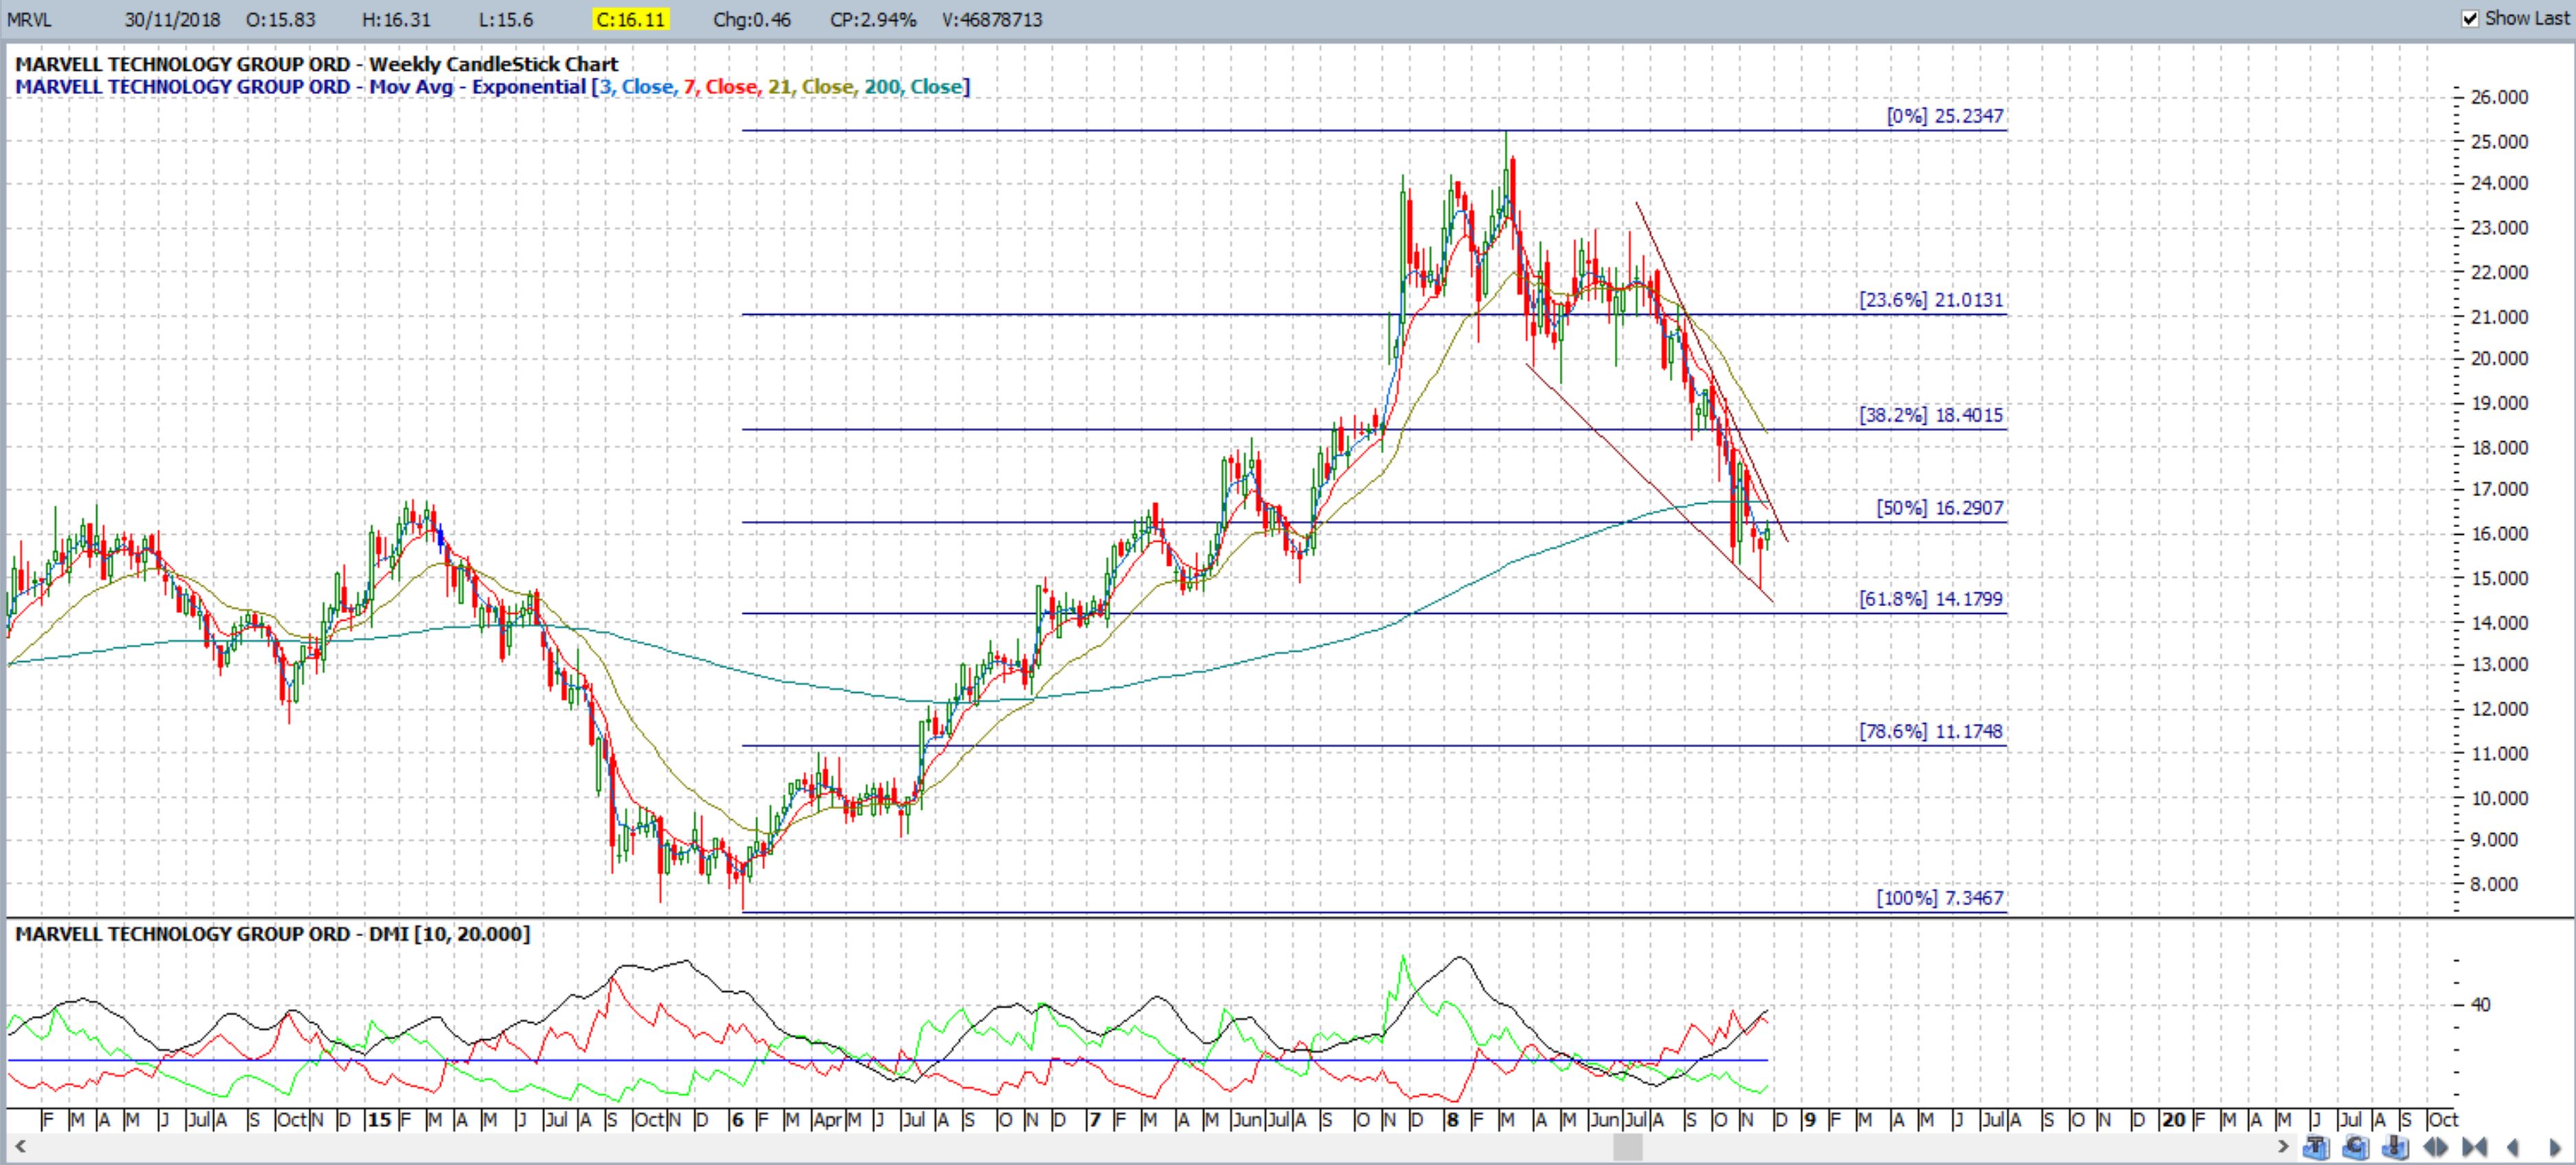
Figure 8: MRVL setting up in a Descending Wedge
There was a Descending Wedge breakout in early January 2019 as shown in Figure 9 below:
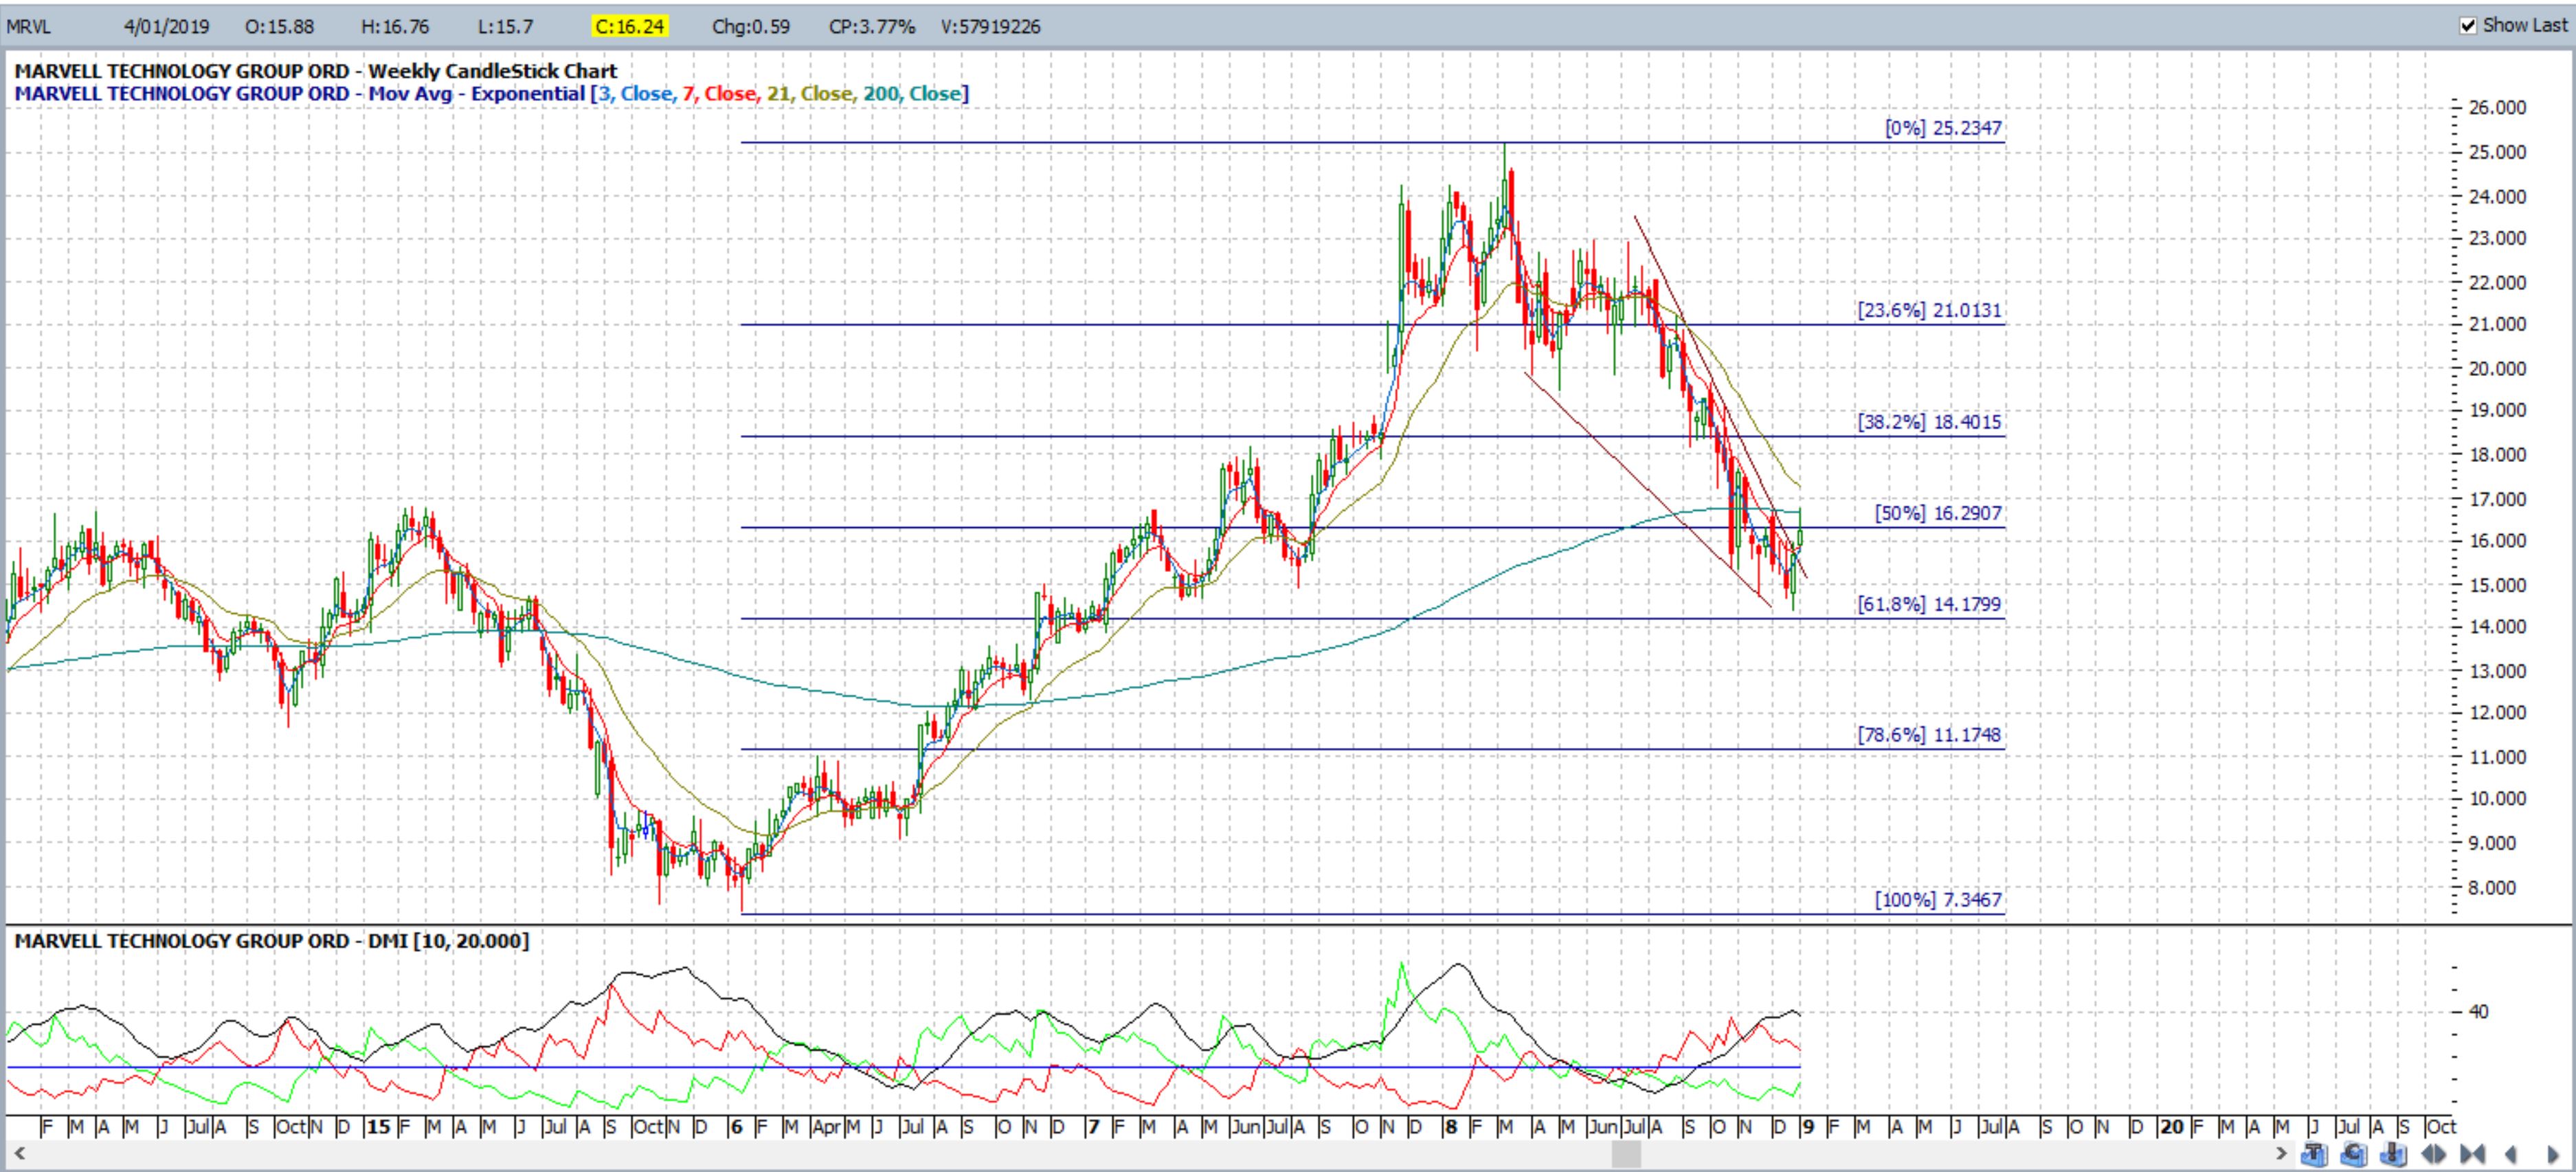
Figure 9: MRVL breaking out from the Descending Wedge
Fibonacci retracement was applied to this swing low move of March 2018 to January 2019. It showed the 61.8% level to be near a previous S/R level of $21 and this would have been the major target for this breakout move.
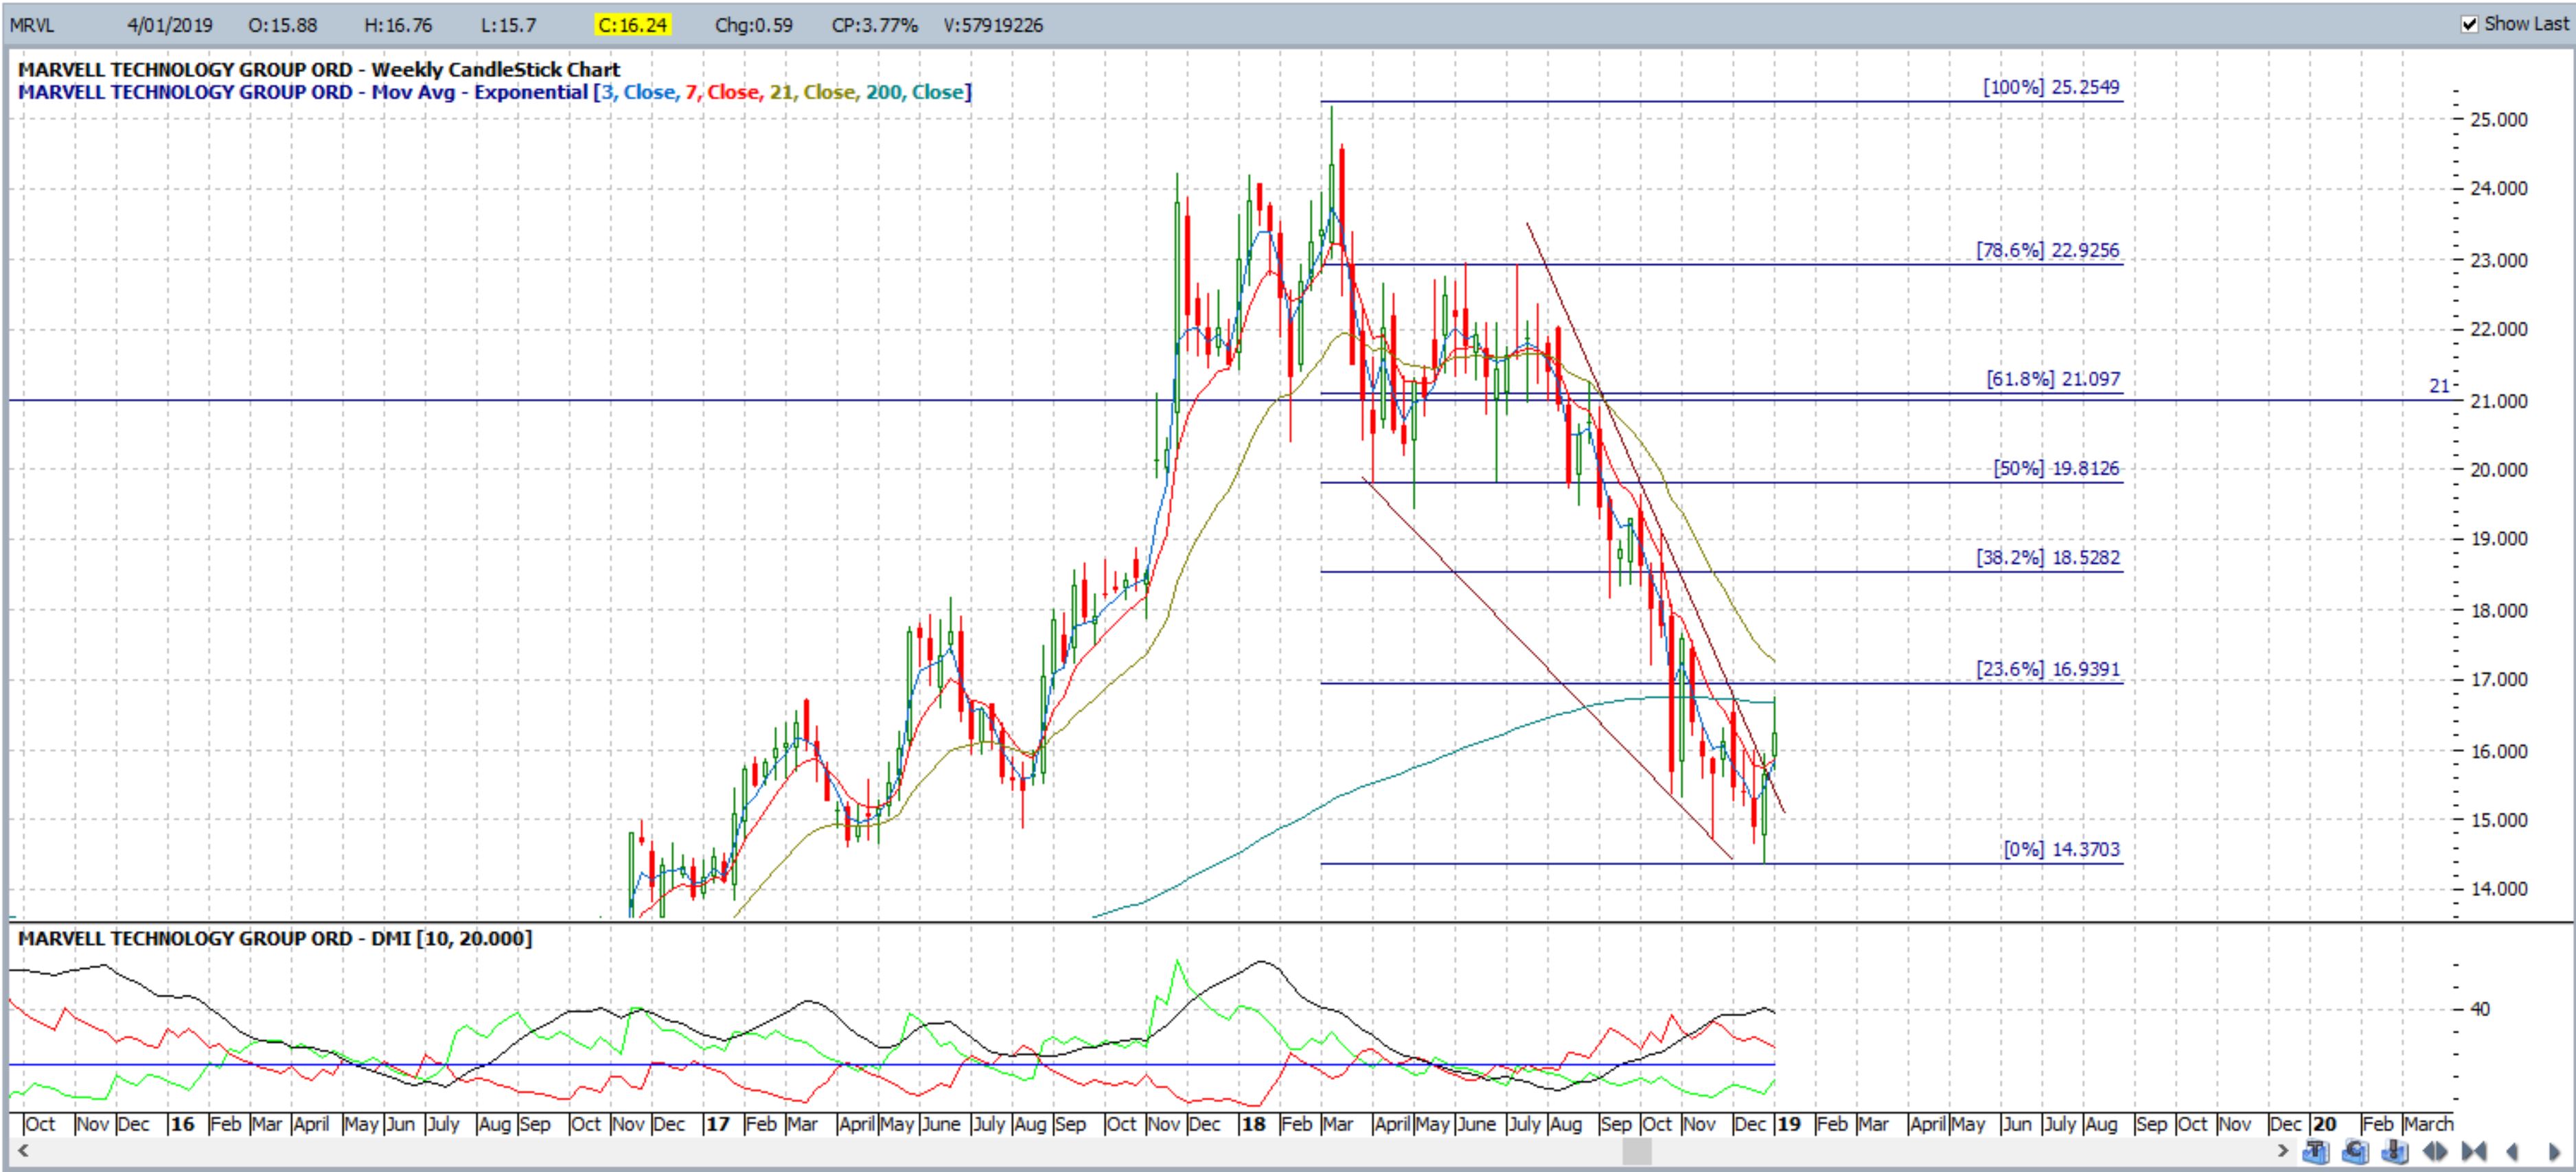
Figure 10: MRVL continuation from the Descending Wedge
The breakout pulled back to the 61.8% Fibonacci by late March 2019 as shown in Figure 11 below:
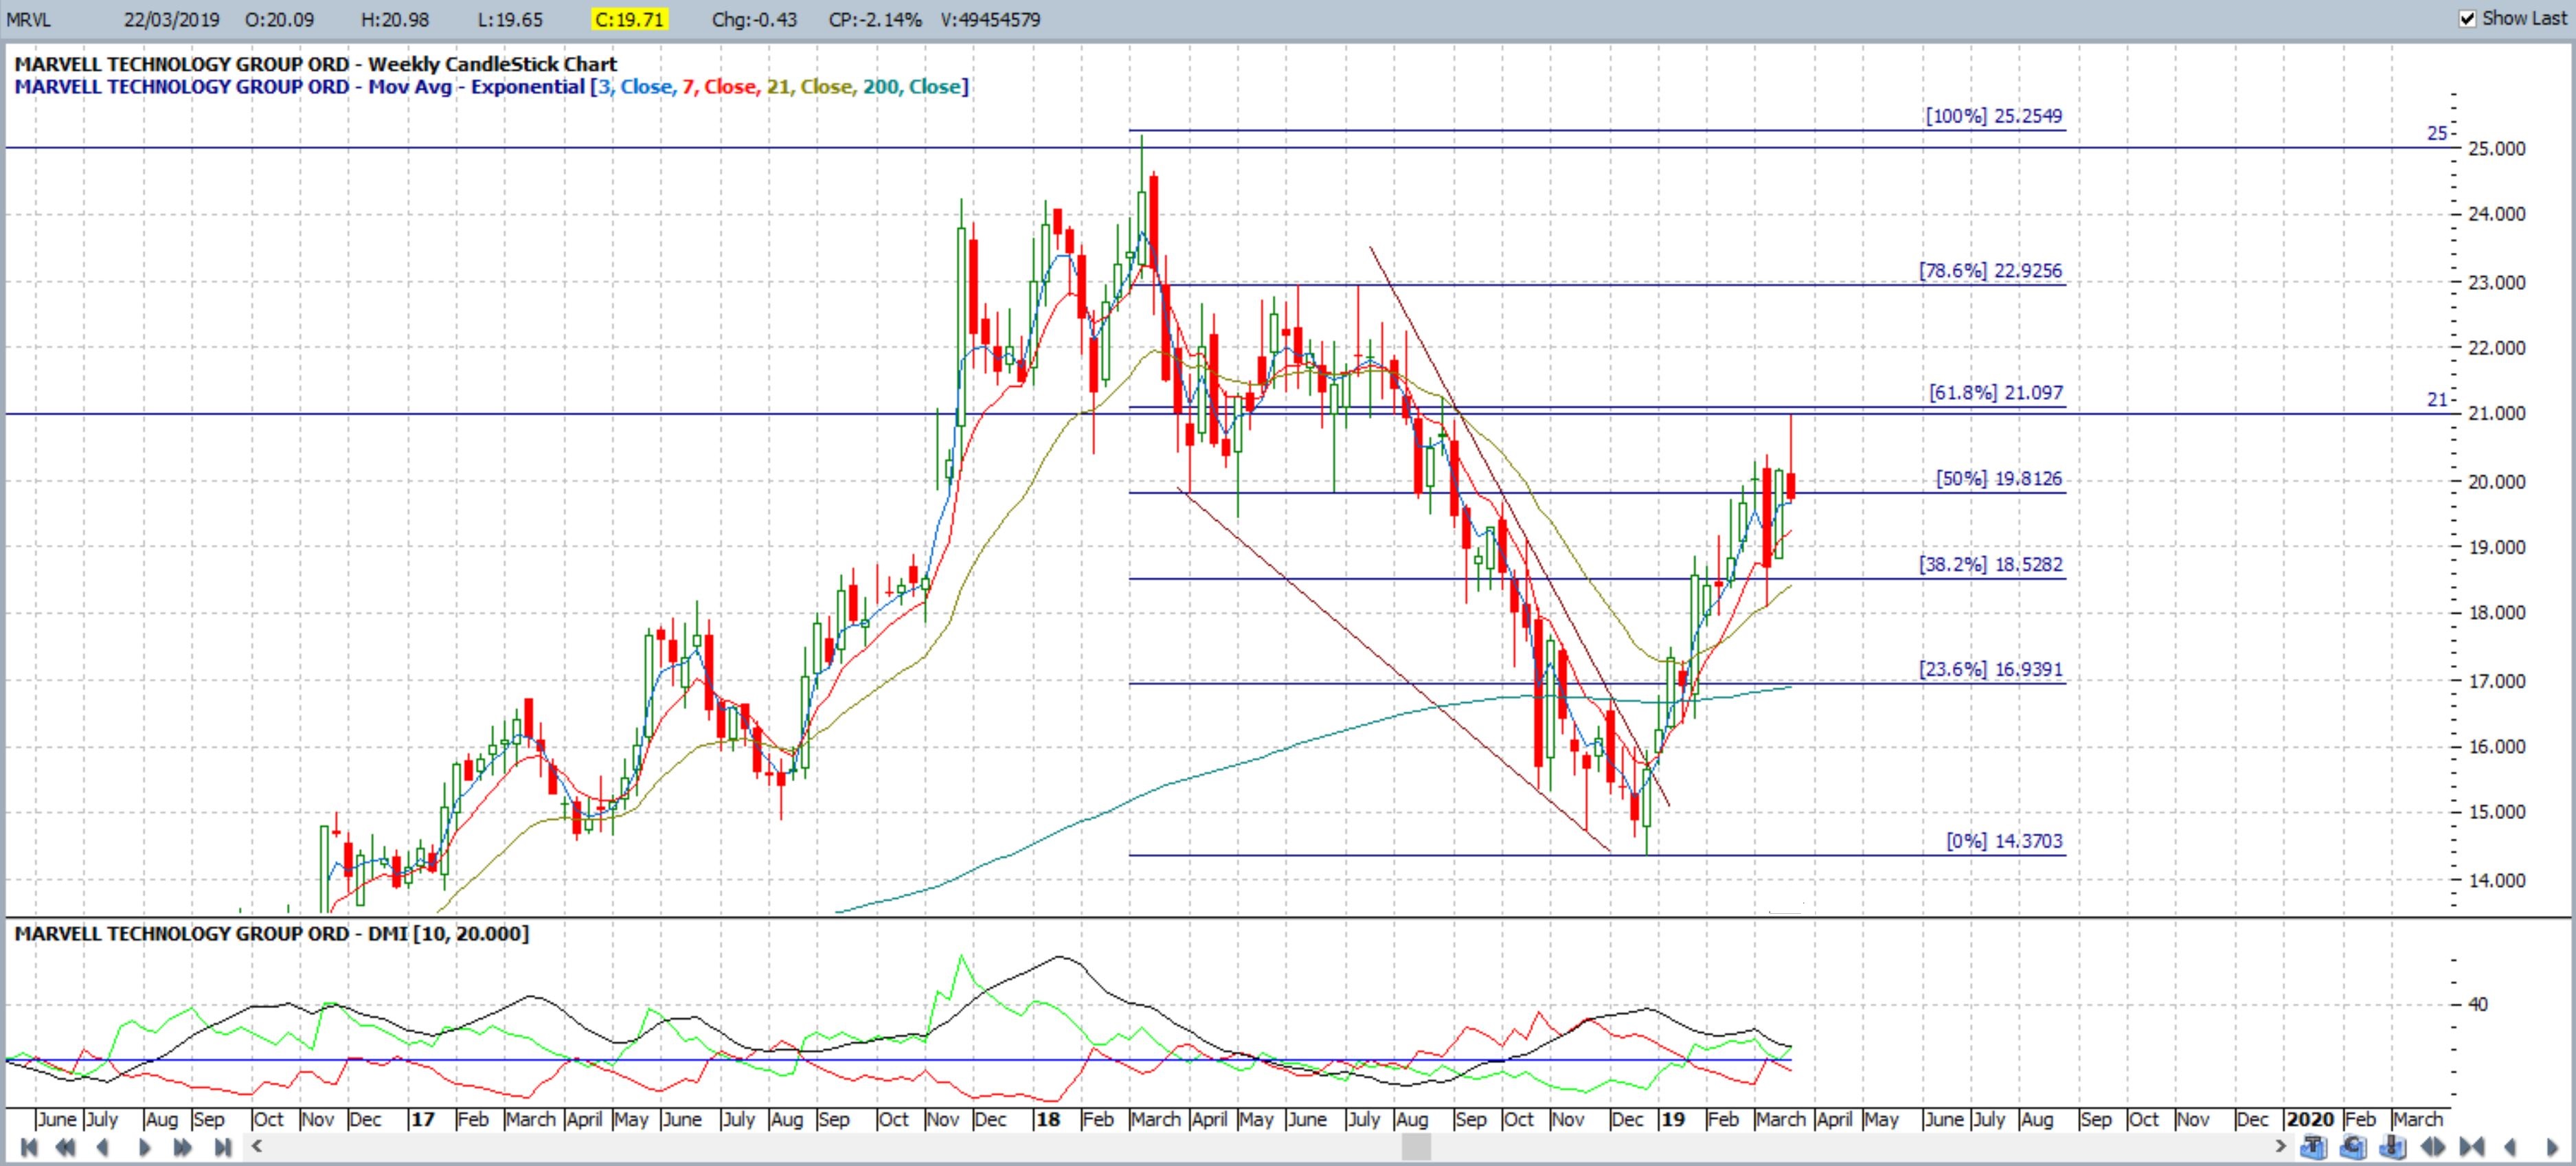
Figure 11: MRVL 61.8% Fibonacci retracement after the Descending Wedge breakout
The breakout move actually went past the 61.8% Fibonacci and on to the 100% level as shown in Figure 12 below. I would now be looking for any pause here, or even potential weakness, even if price action does eventually continue on higher.
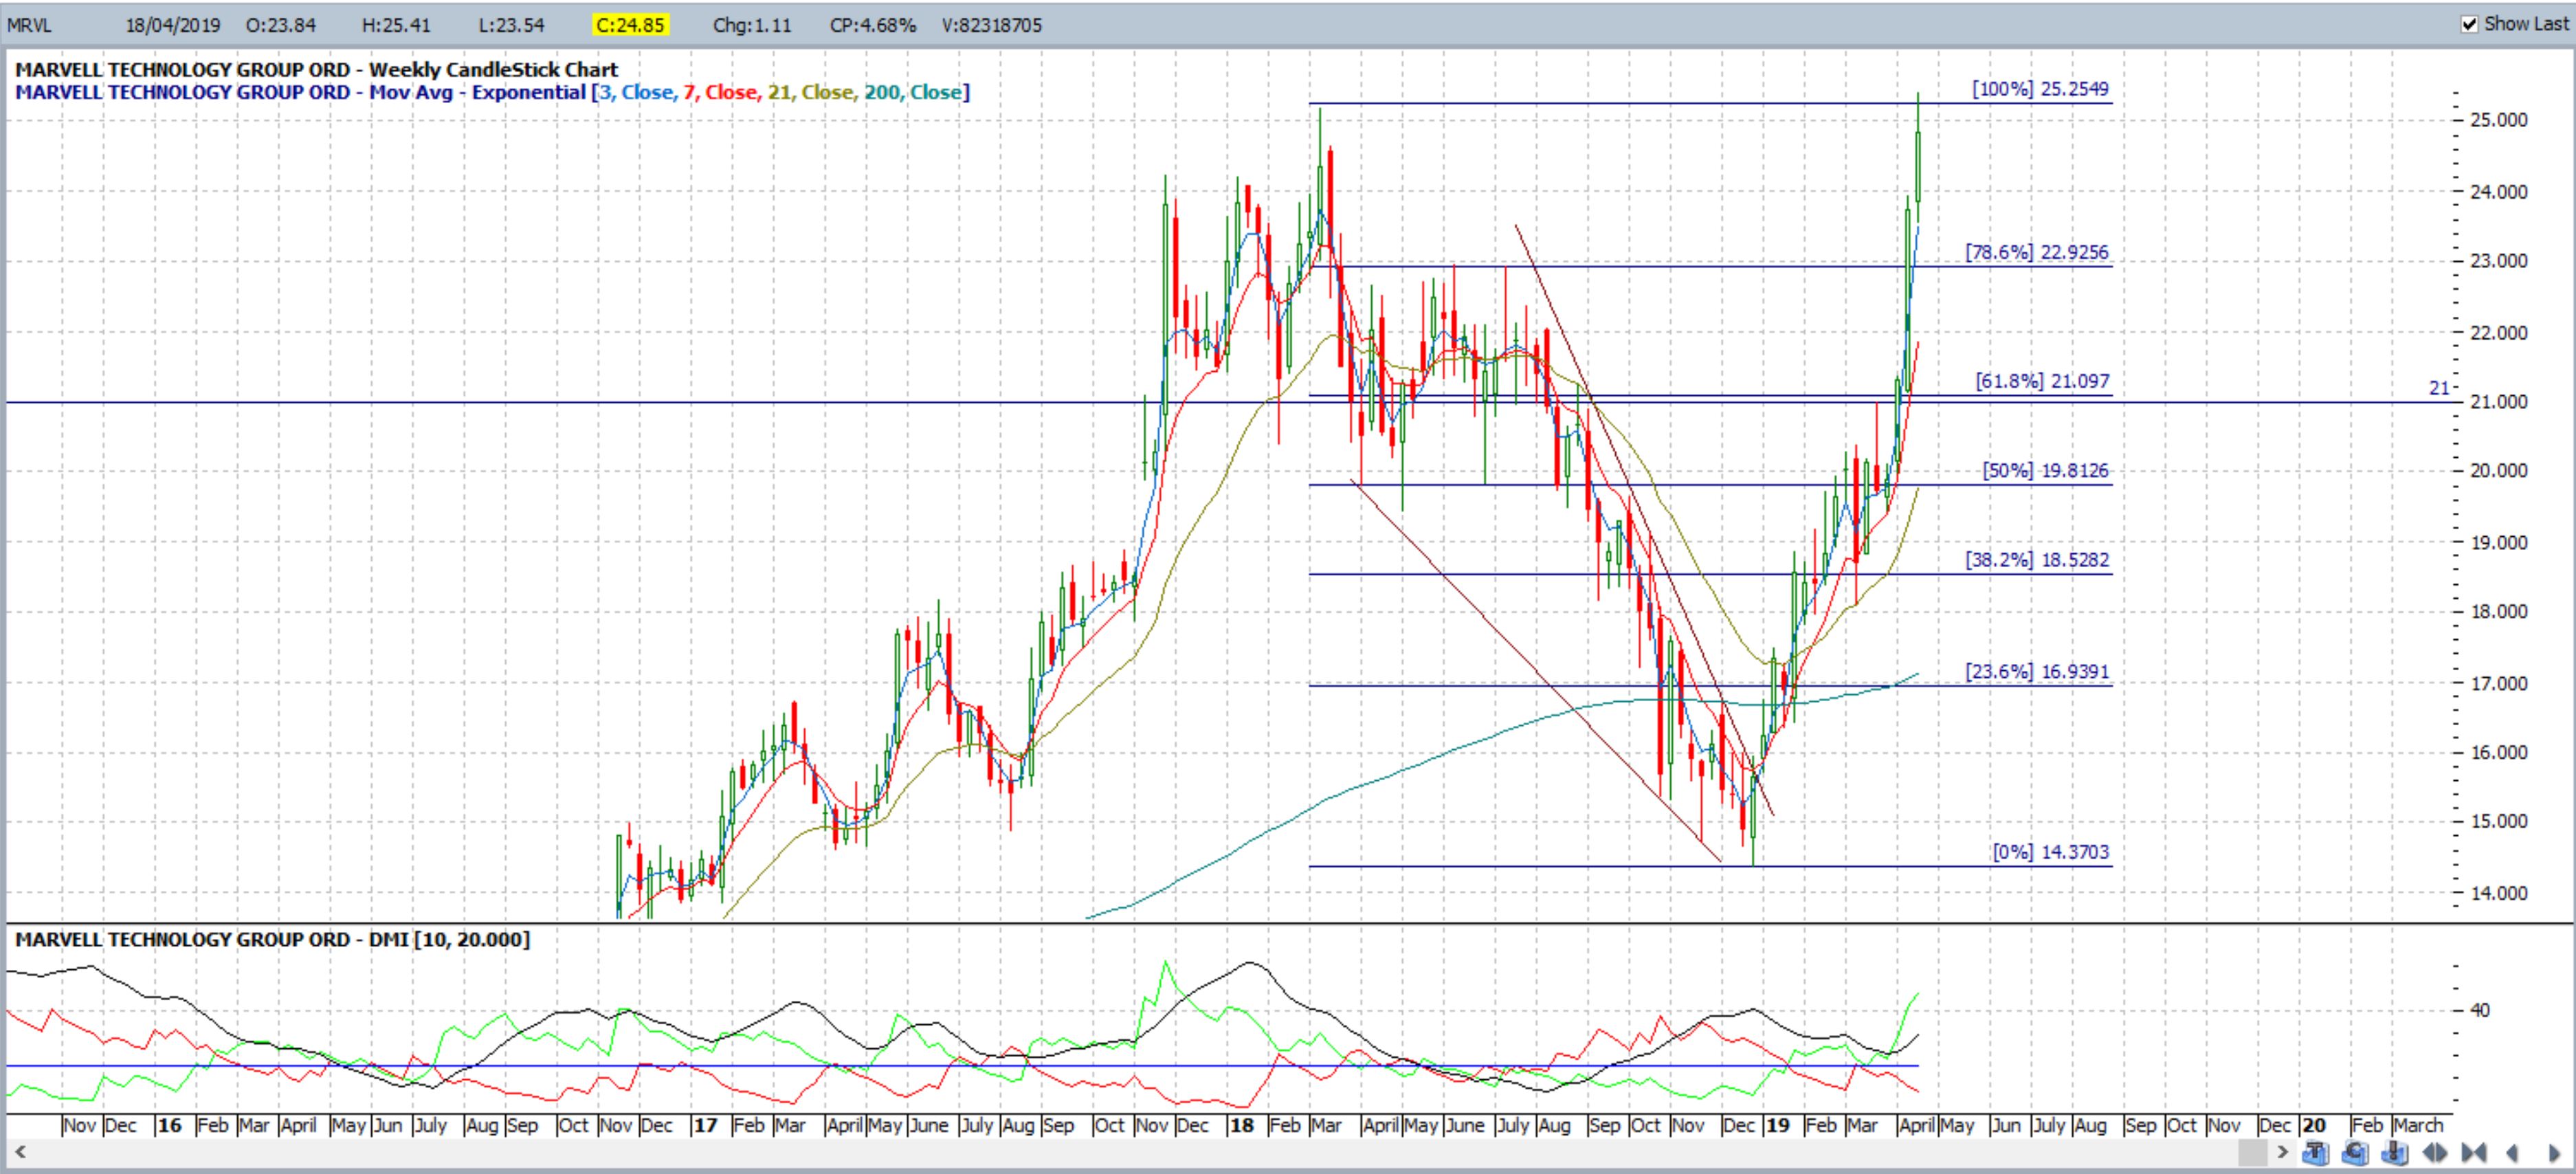
Figure 12: MRVL 100% Fibonacci retracement after the Descending Wedge breakout
Example 4: AMAT Applied Materials NASDAQ:
This wedge breakout started back in January 2019. This wedge looks like it also is forming part of a Bull Flag.
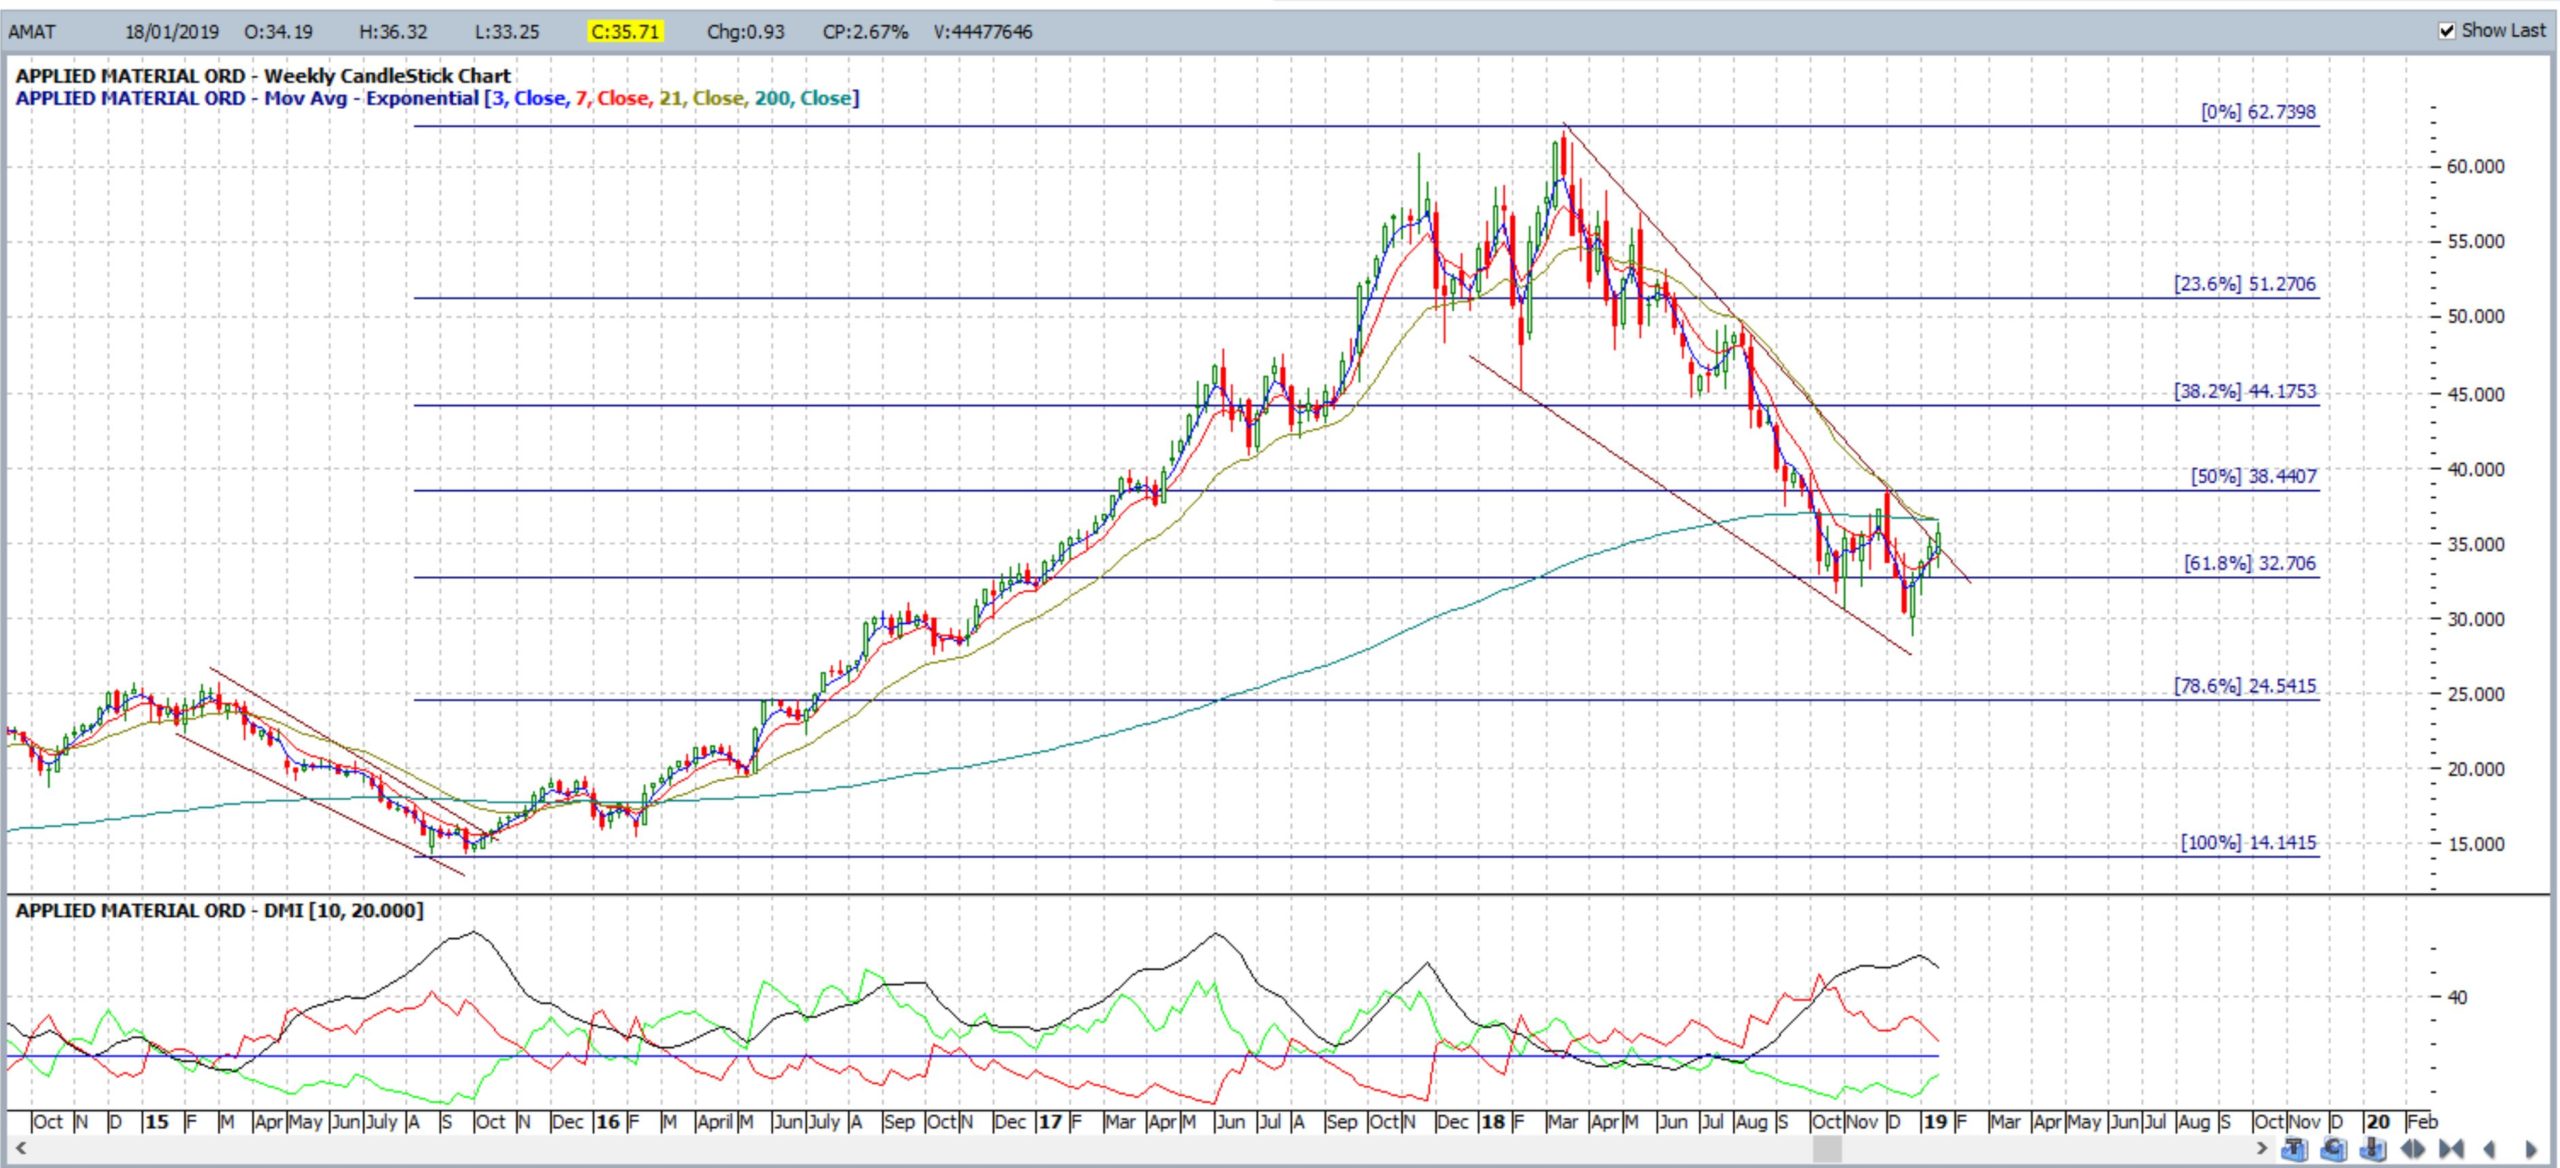
Figure 13: AMAT breaking out from the Descending Wedge
The first main target for the breakout move was the 61.8% fib as this was also near previous S/R at $50:
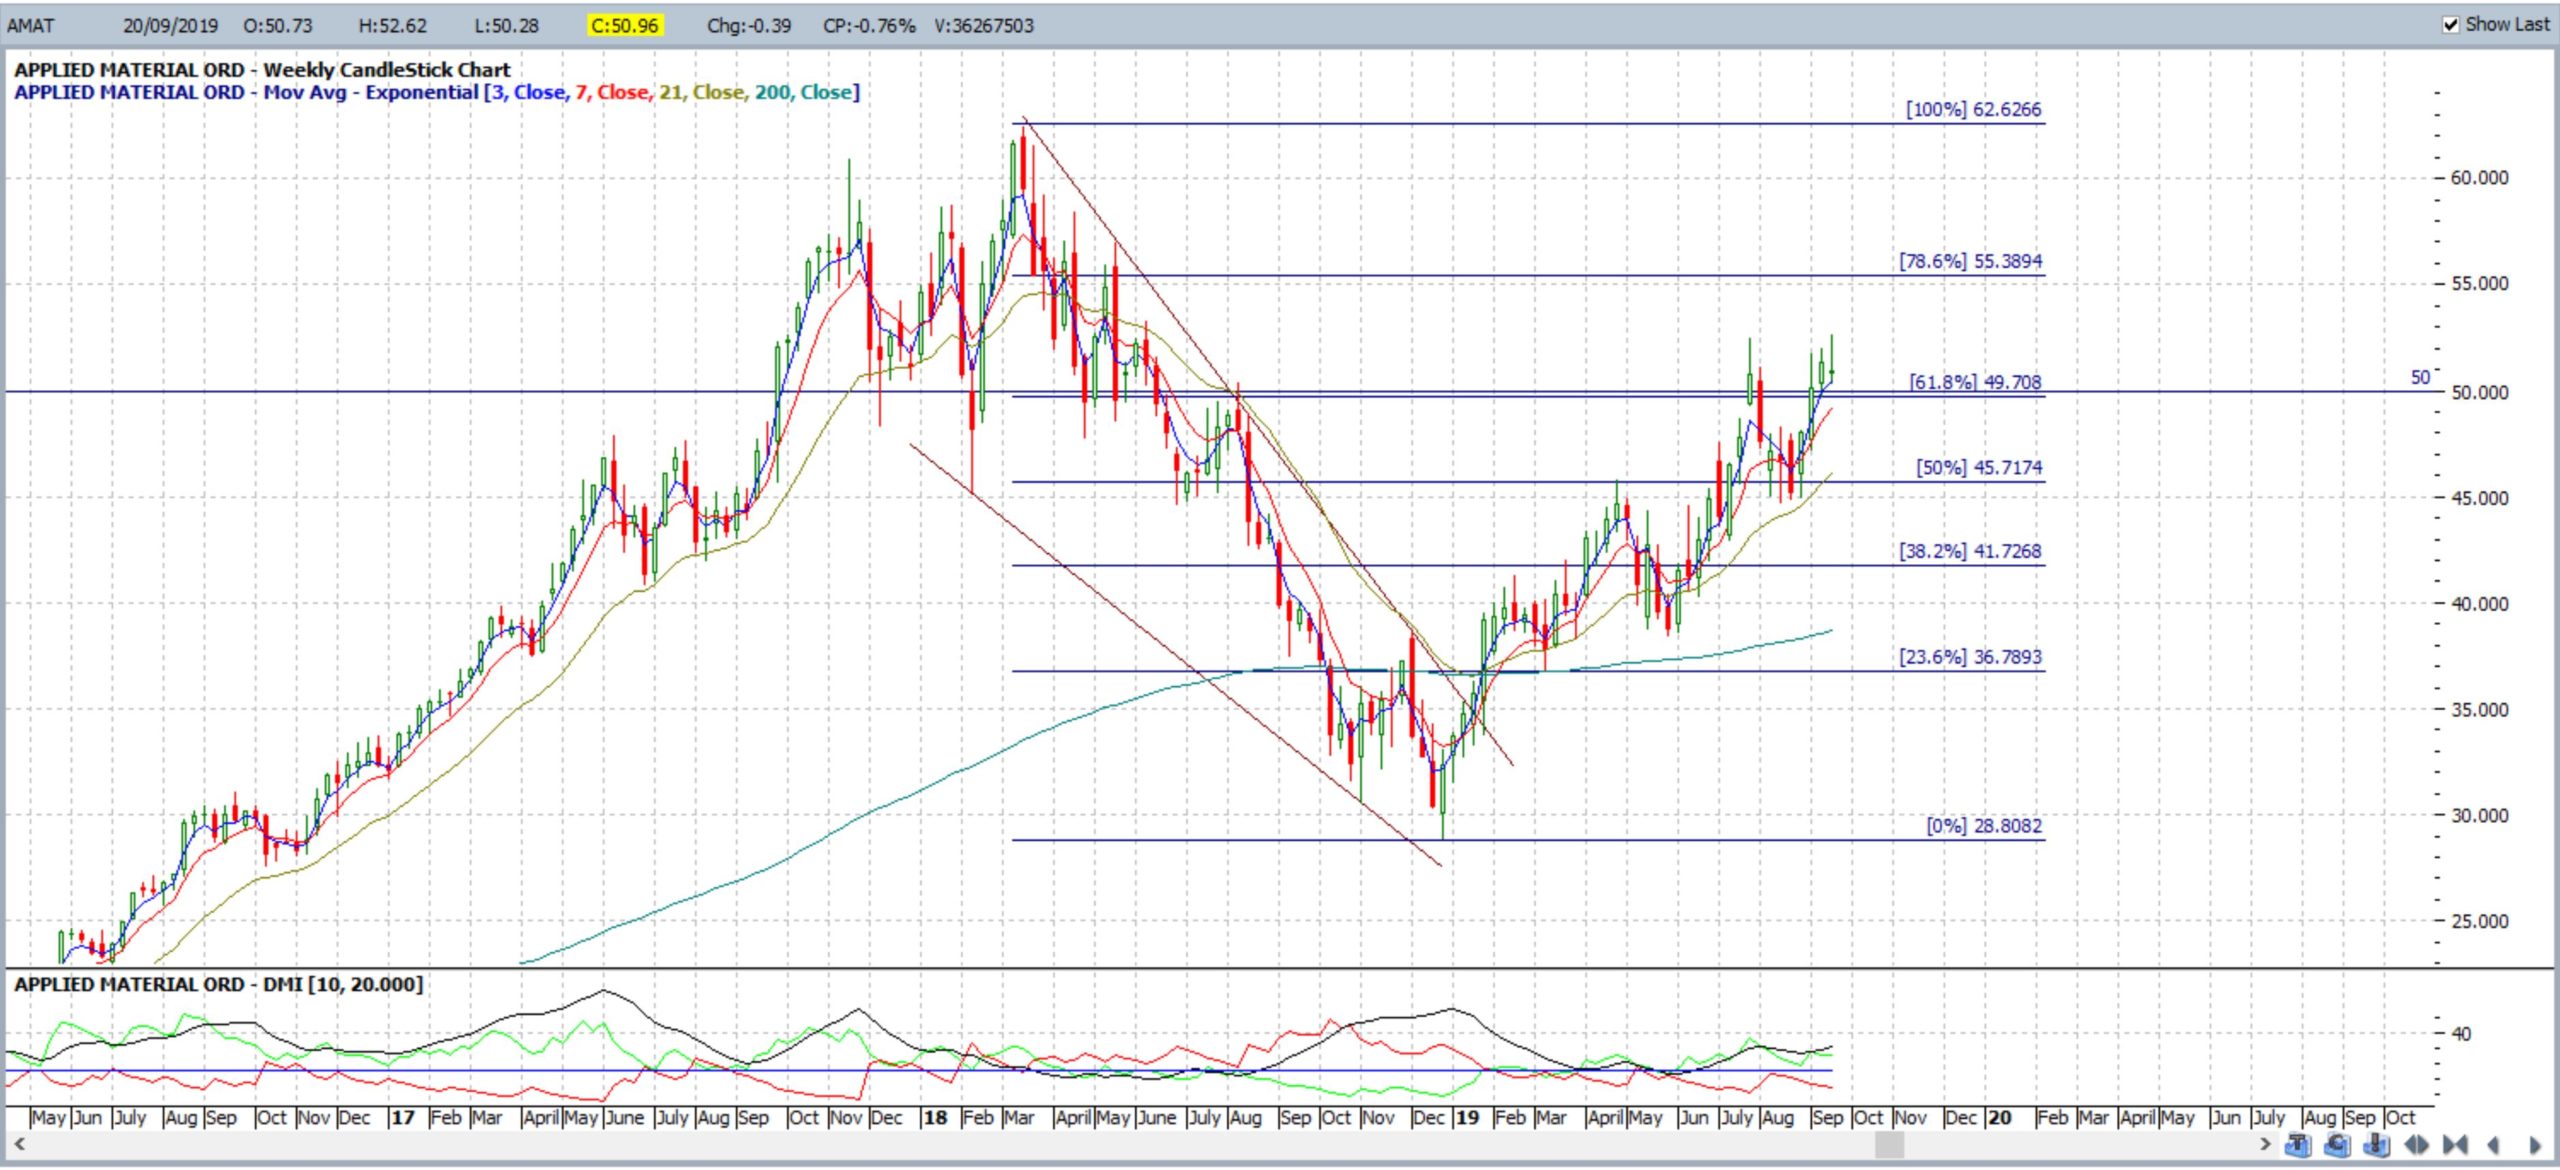
Figure 14: AMAT 61.8% % Fibonacci retracement after the Descending Wedge breakout
Note how bullish price action continued up to the 100% fib level;
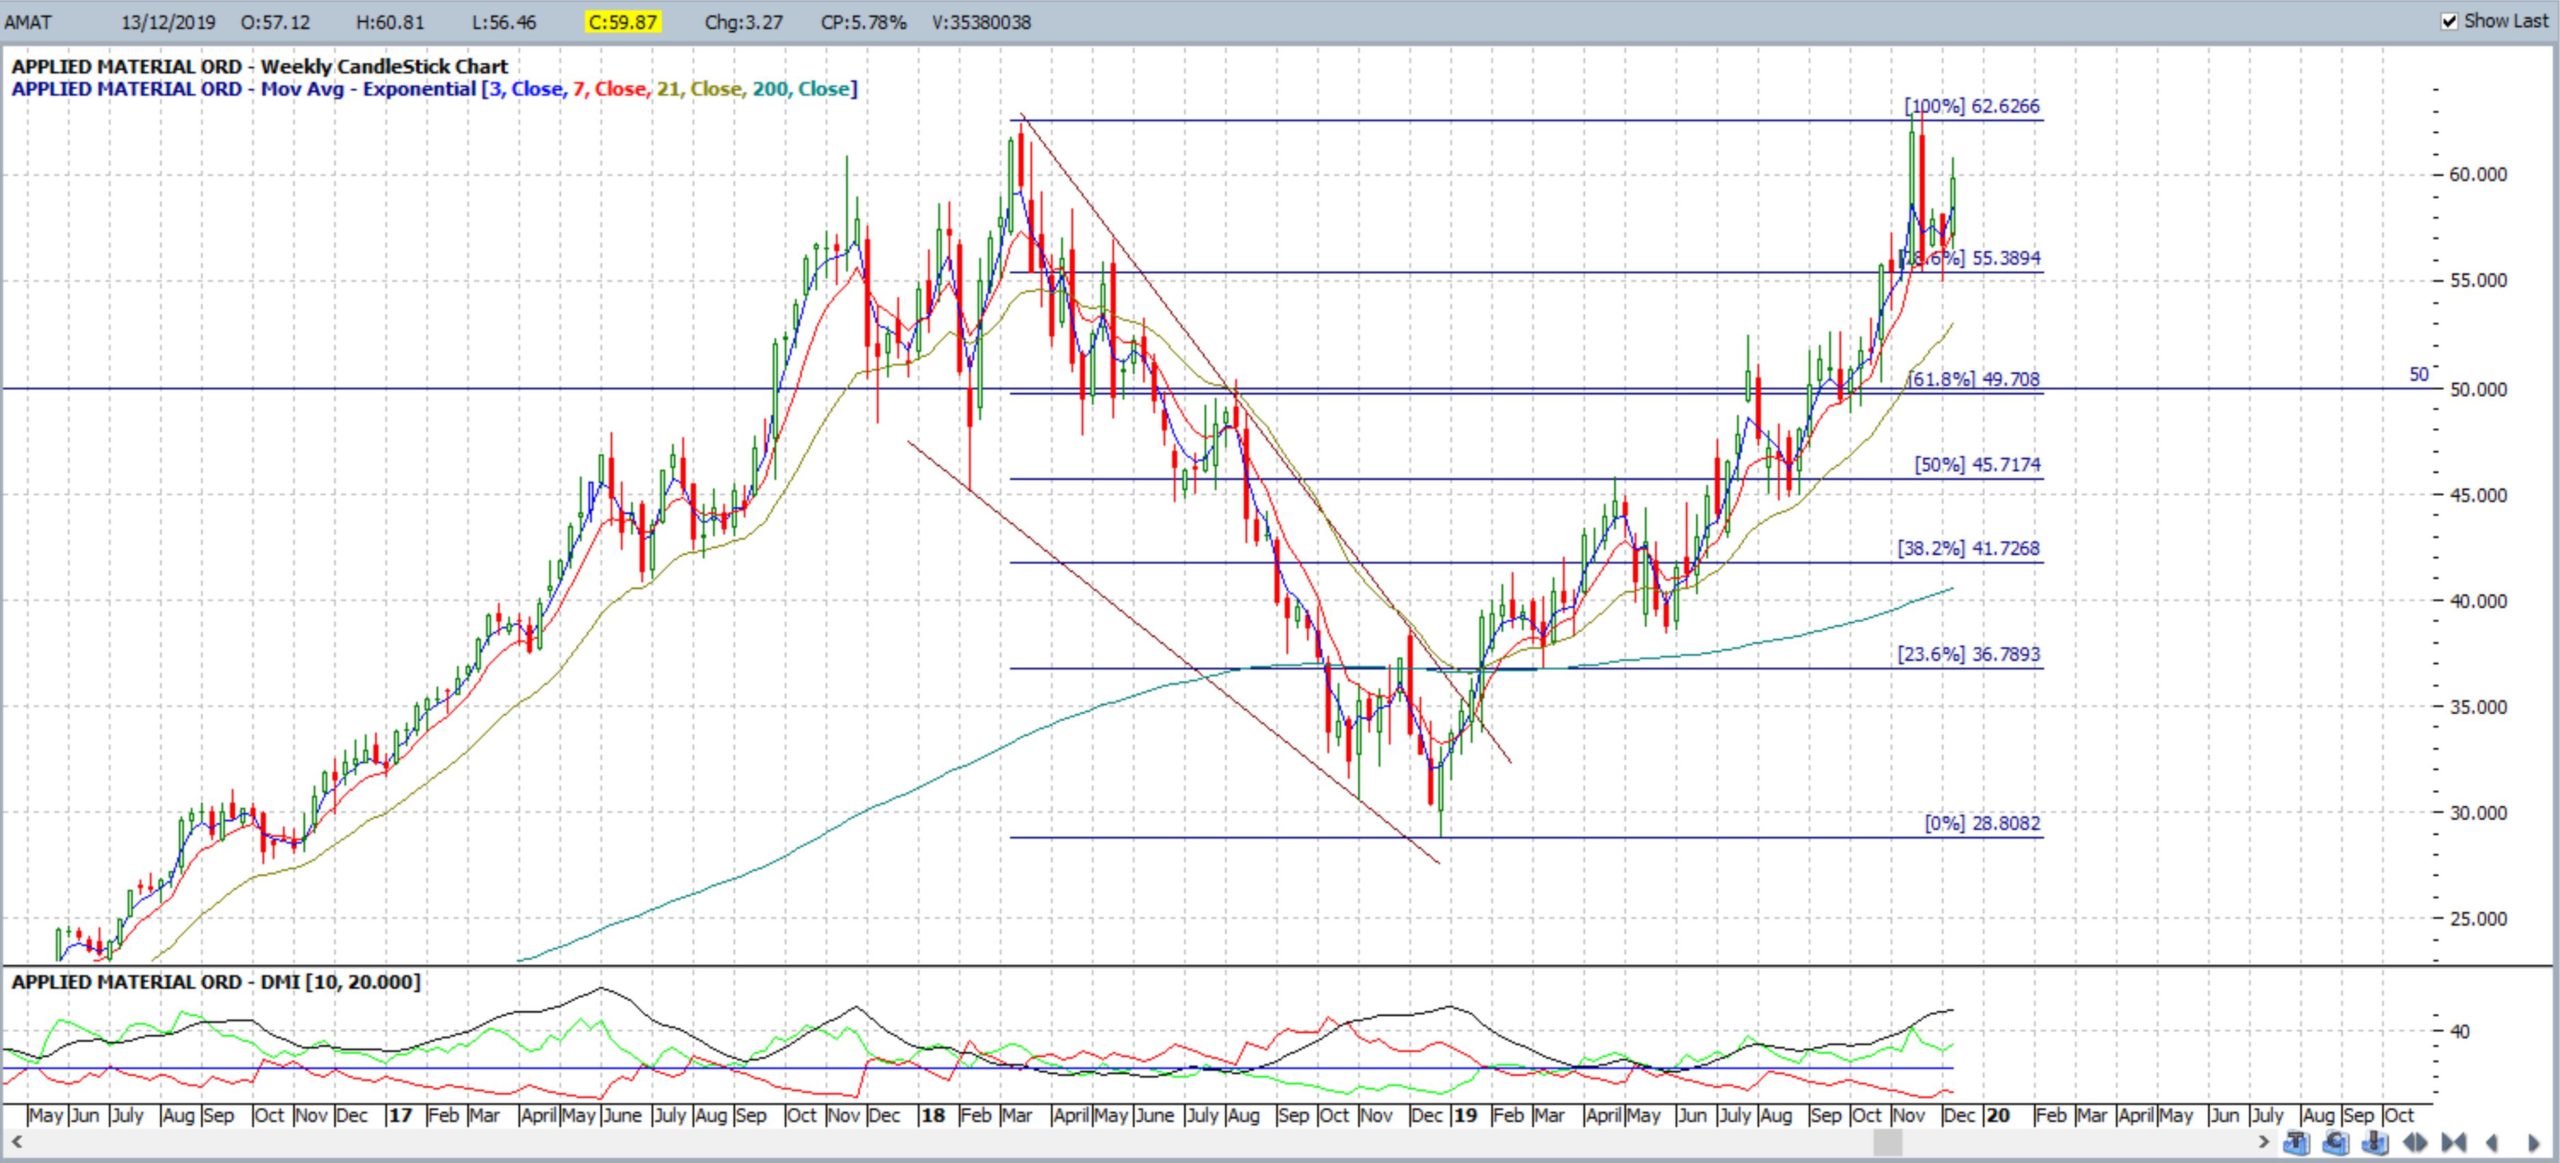
Figure 15: AMAT 100% Fibonacci retracement after the Descending Wedge breakout
Word of Caution:
Descending wedge breakouts may sometimes take a while to get going with any mean reversion activity. I use the analogy here like turning a ship, they often take a while to turn and don’t turn 180o on a dime and so, too, descending wedge breakouts can take a while to get going. Look at the example in Figure 13 below. There were up to six weekly candles printed after the bullish candle breakout before price action really got going:

Figure 16: EVH takes up to 6 weeks to get going on its Descending Wedge breakout
Summary: The Descending Wedge pattern is classified as a bullish-reversal pattern and, in my experience, have been one of the most reliable technical charting patterns. I therefore regularly scan my weekly charts for any potential Descending Wedge setups.
I encourage readers who have charting software, and who don’t normally focus on scanning weekly charts, to scroll out and assess this time frame for any Descending Wedge setups forming on stocks you analyse; you might be surprised by how many setups you find!
In this article I have illustrated the concept of tracking a Descending Wedge breakout using FMG, EBAY and MRVL as recent examples. There are more examples of successful Descending Wedge breakouts posted on my website and these can be accessed through the following link.
Please remember that there are no guarantees with any charting analysis and that all trading carries risk. Traders should exercise their own due diligence and apply strict risk-management criteria to any trading activity. The information provided in this article is meant to be for educational purposes only and is not a trading recommendation of any type.