


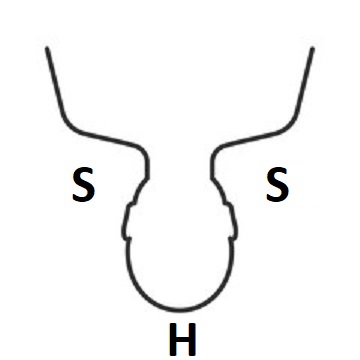
The Inverse Head and Shoulder pattern is generally regarded as a bullish-reversal charting pattern. They are not all that common to find and so, when they do pop up, they are worth giving consideration. There was just such a pattern on the chart of Crude Oil in early 2019 and so this has been used in this article as an example of how to chart an Inverse Head and Shoulder.
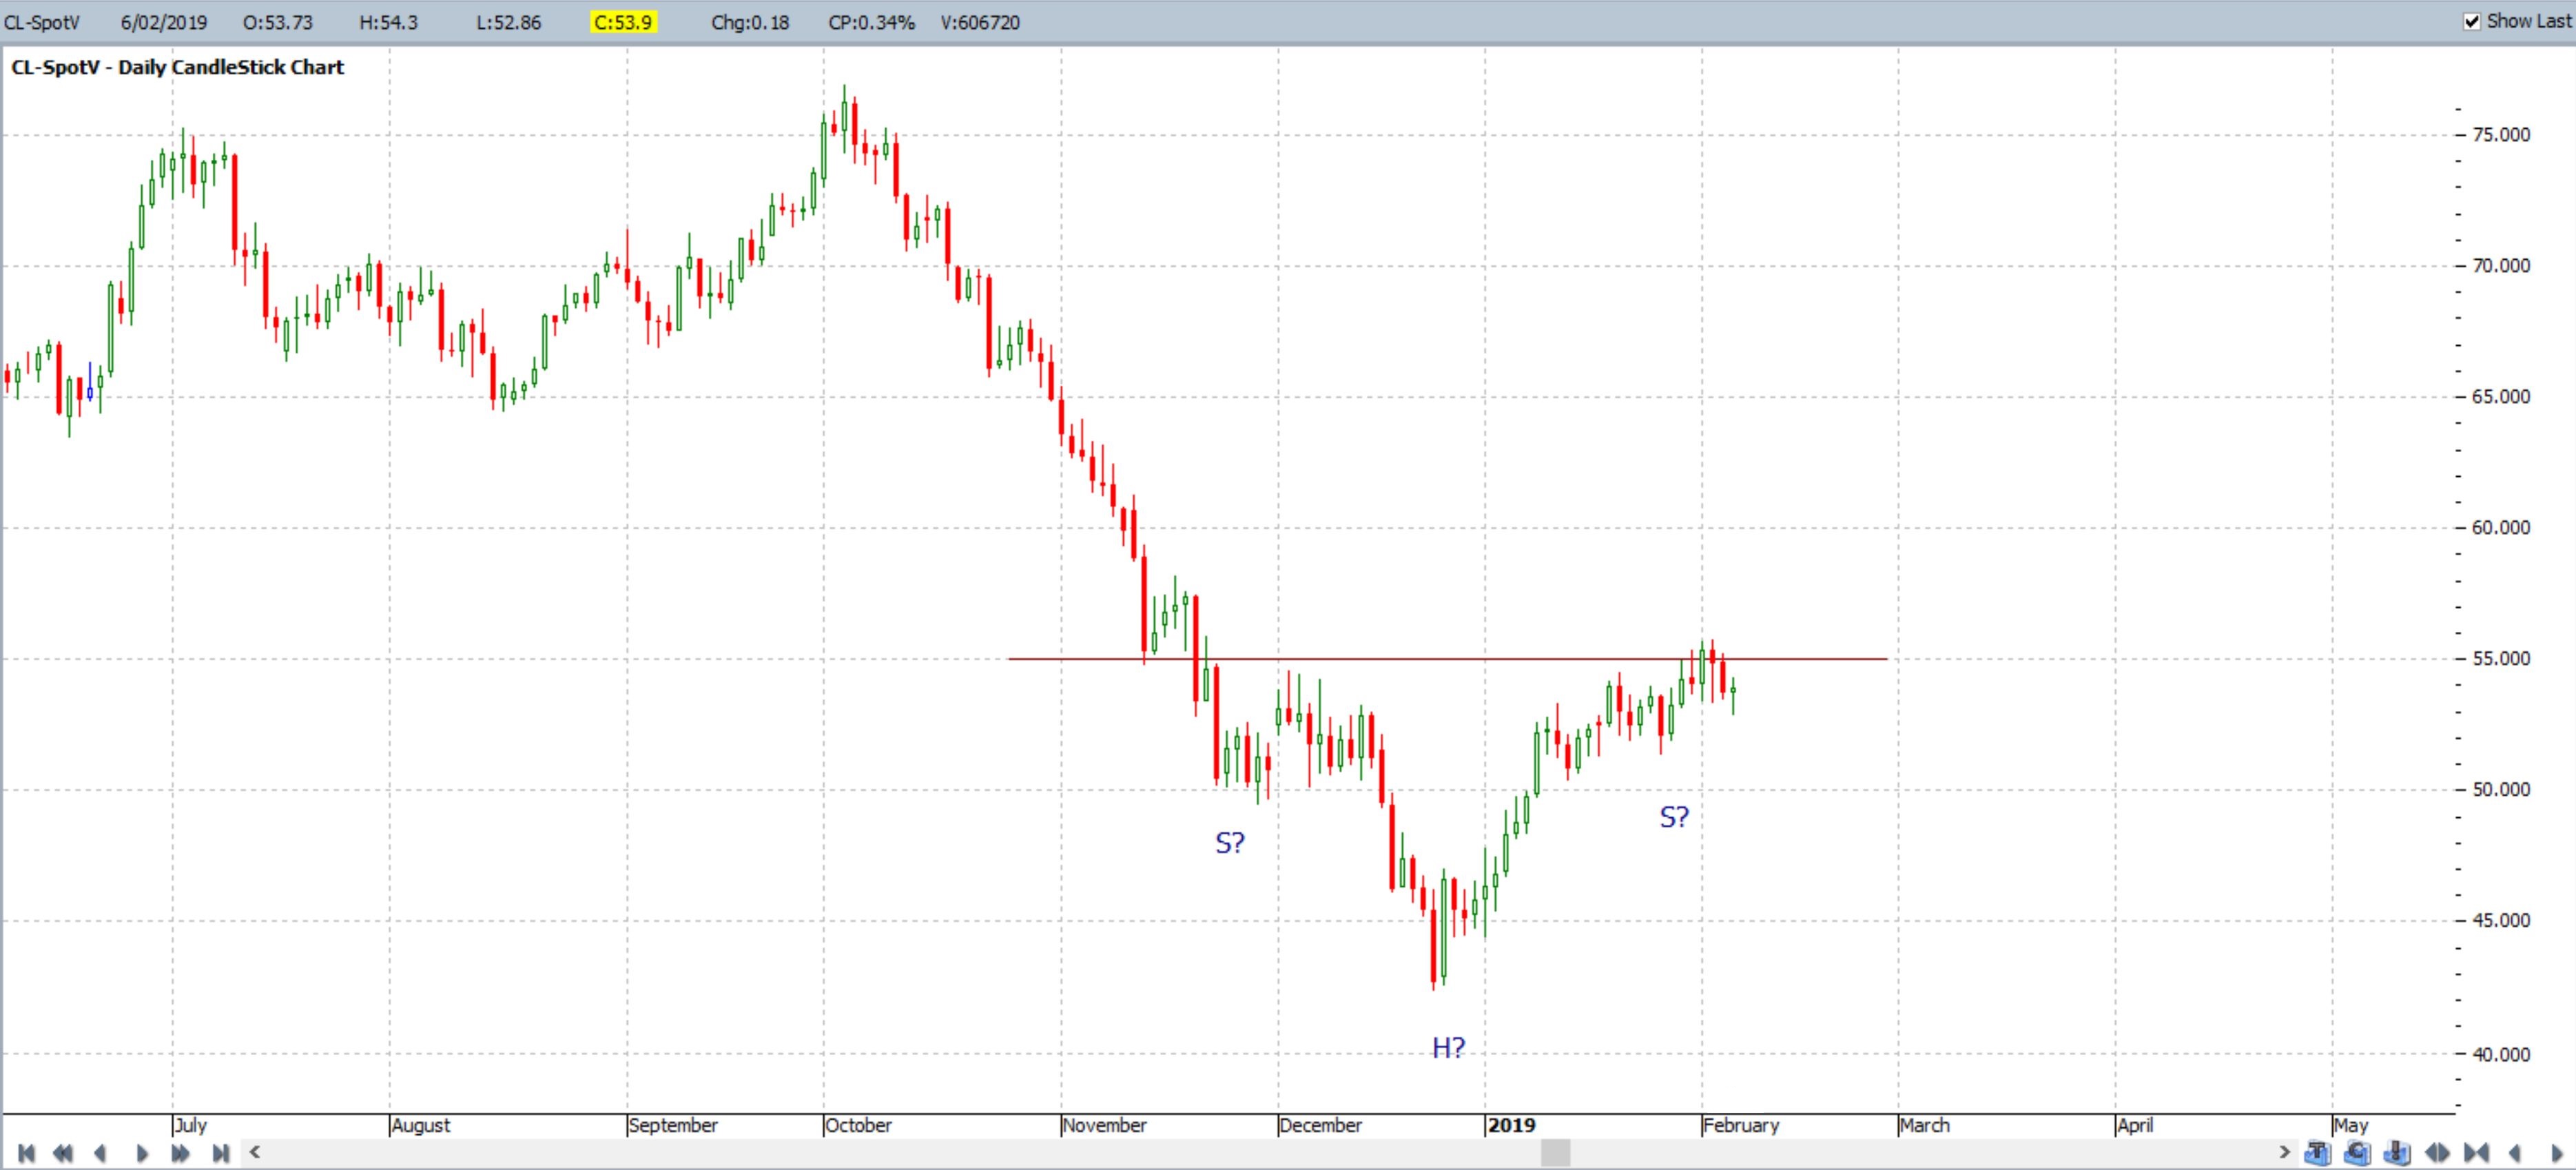
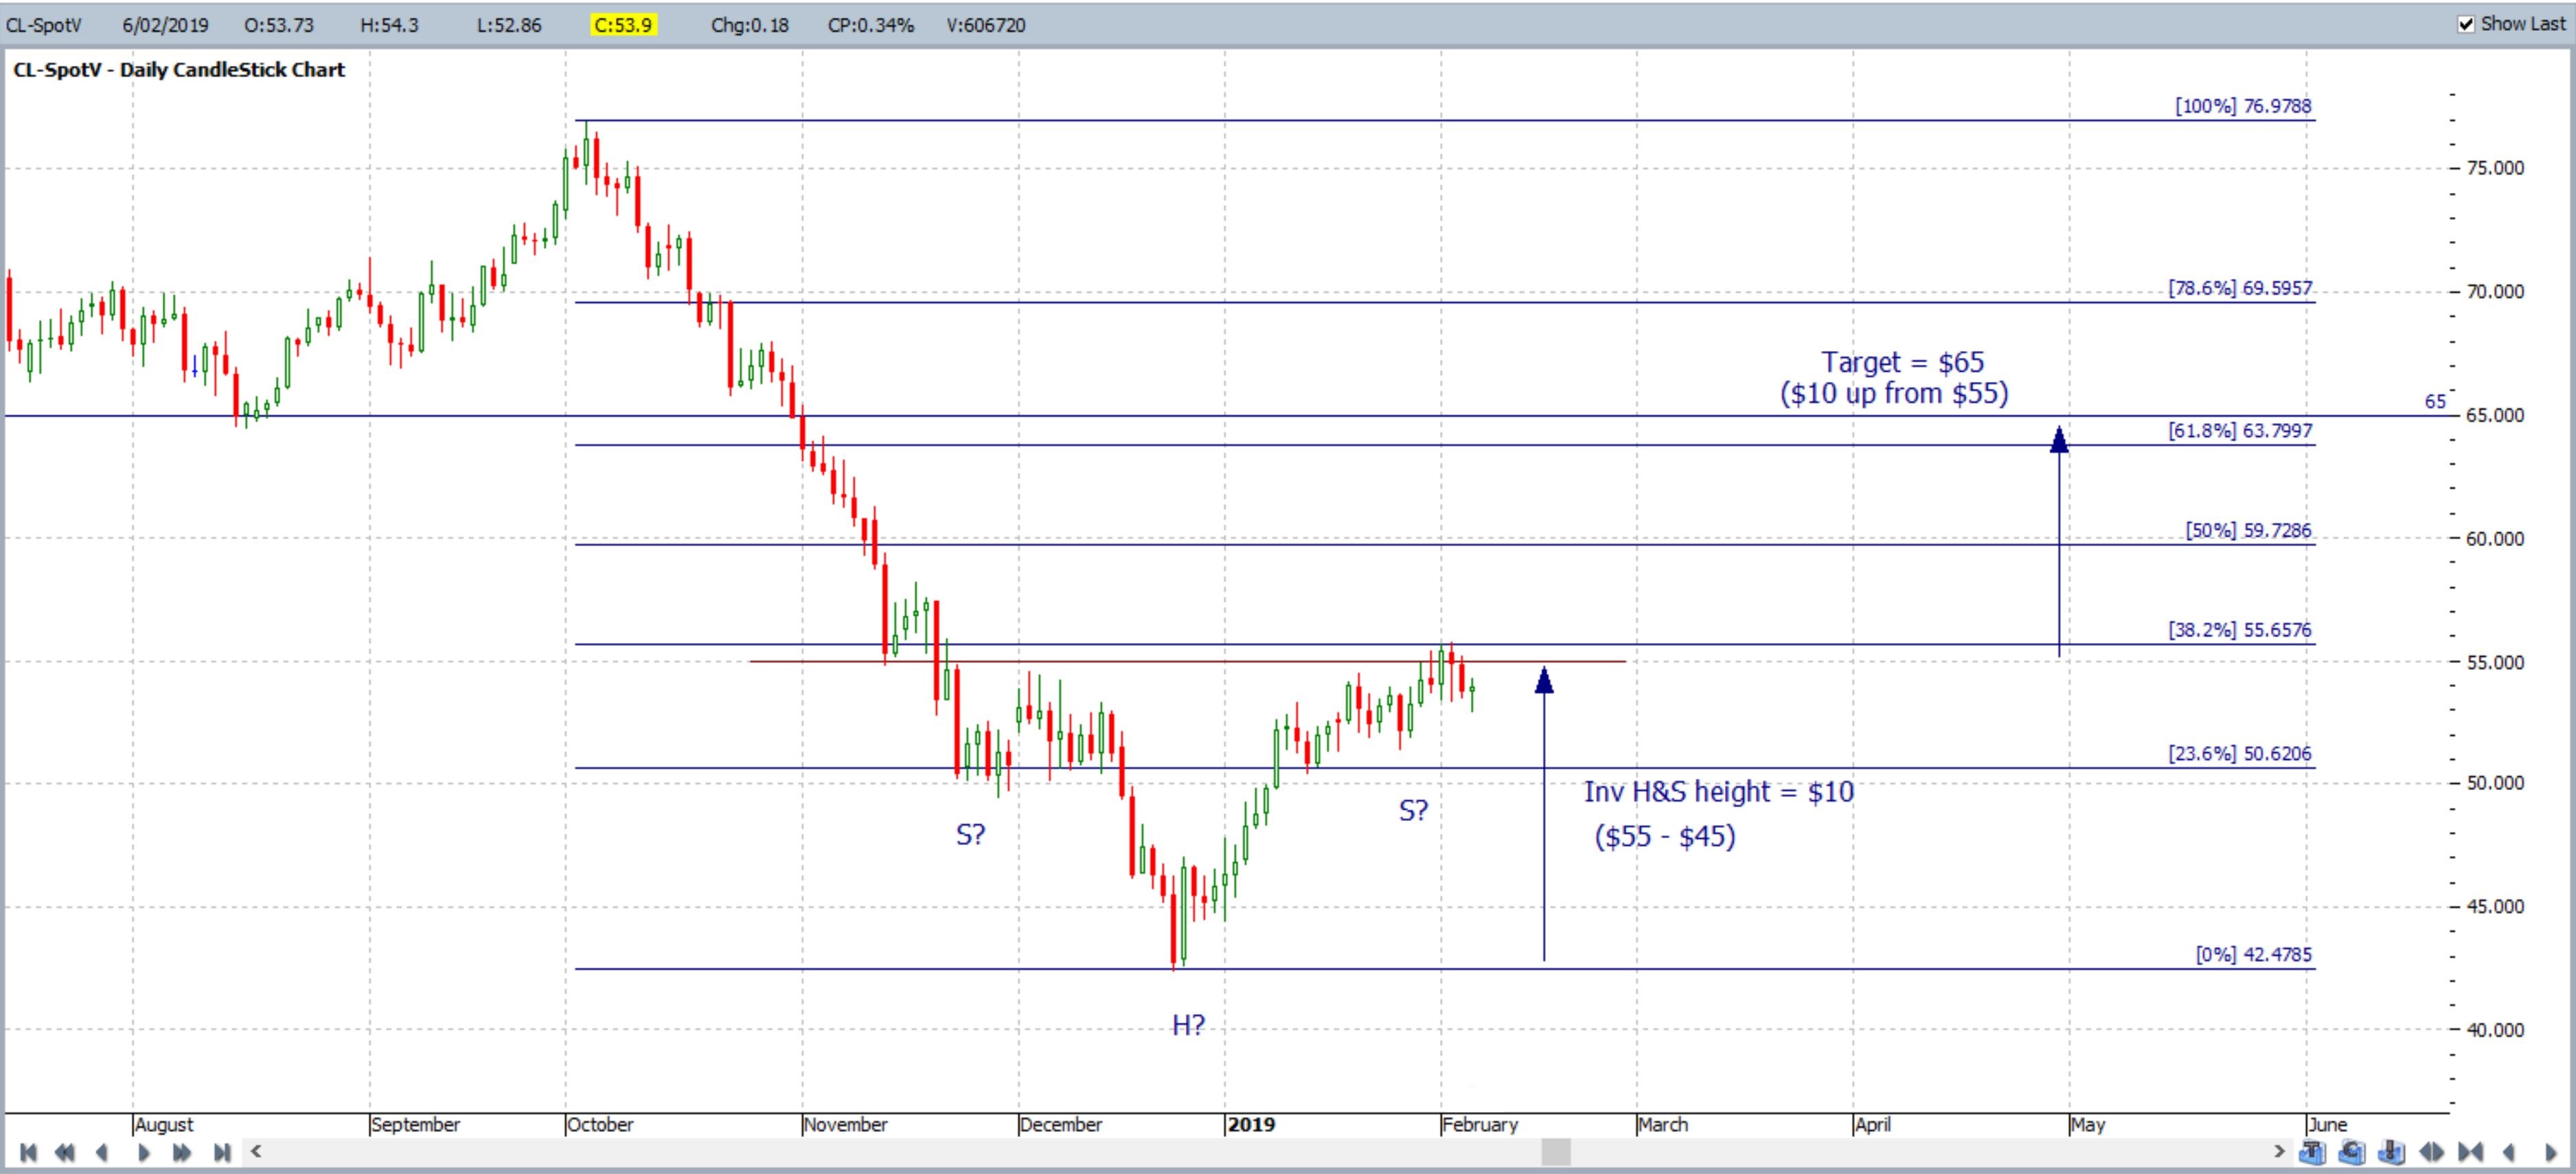
Oil daily: this daily chart from early February shows a clear Inverse Head and Shoulder pattern setting up on the the chart of Crude Oil:
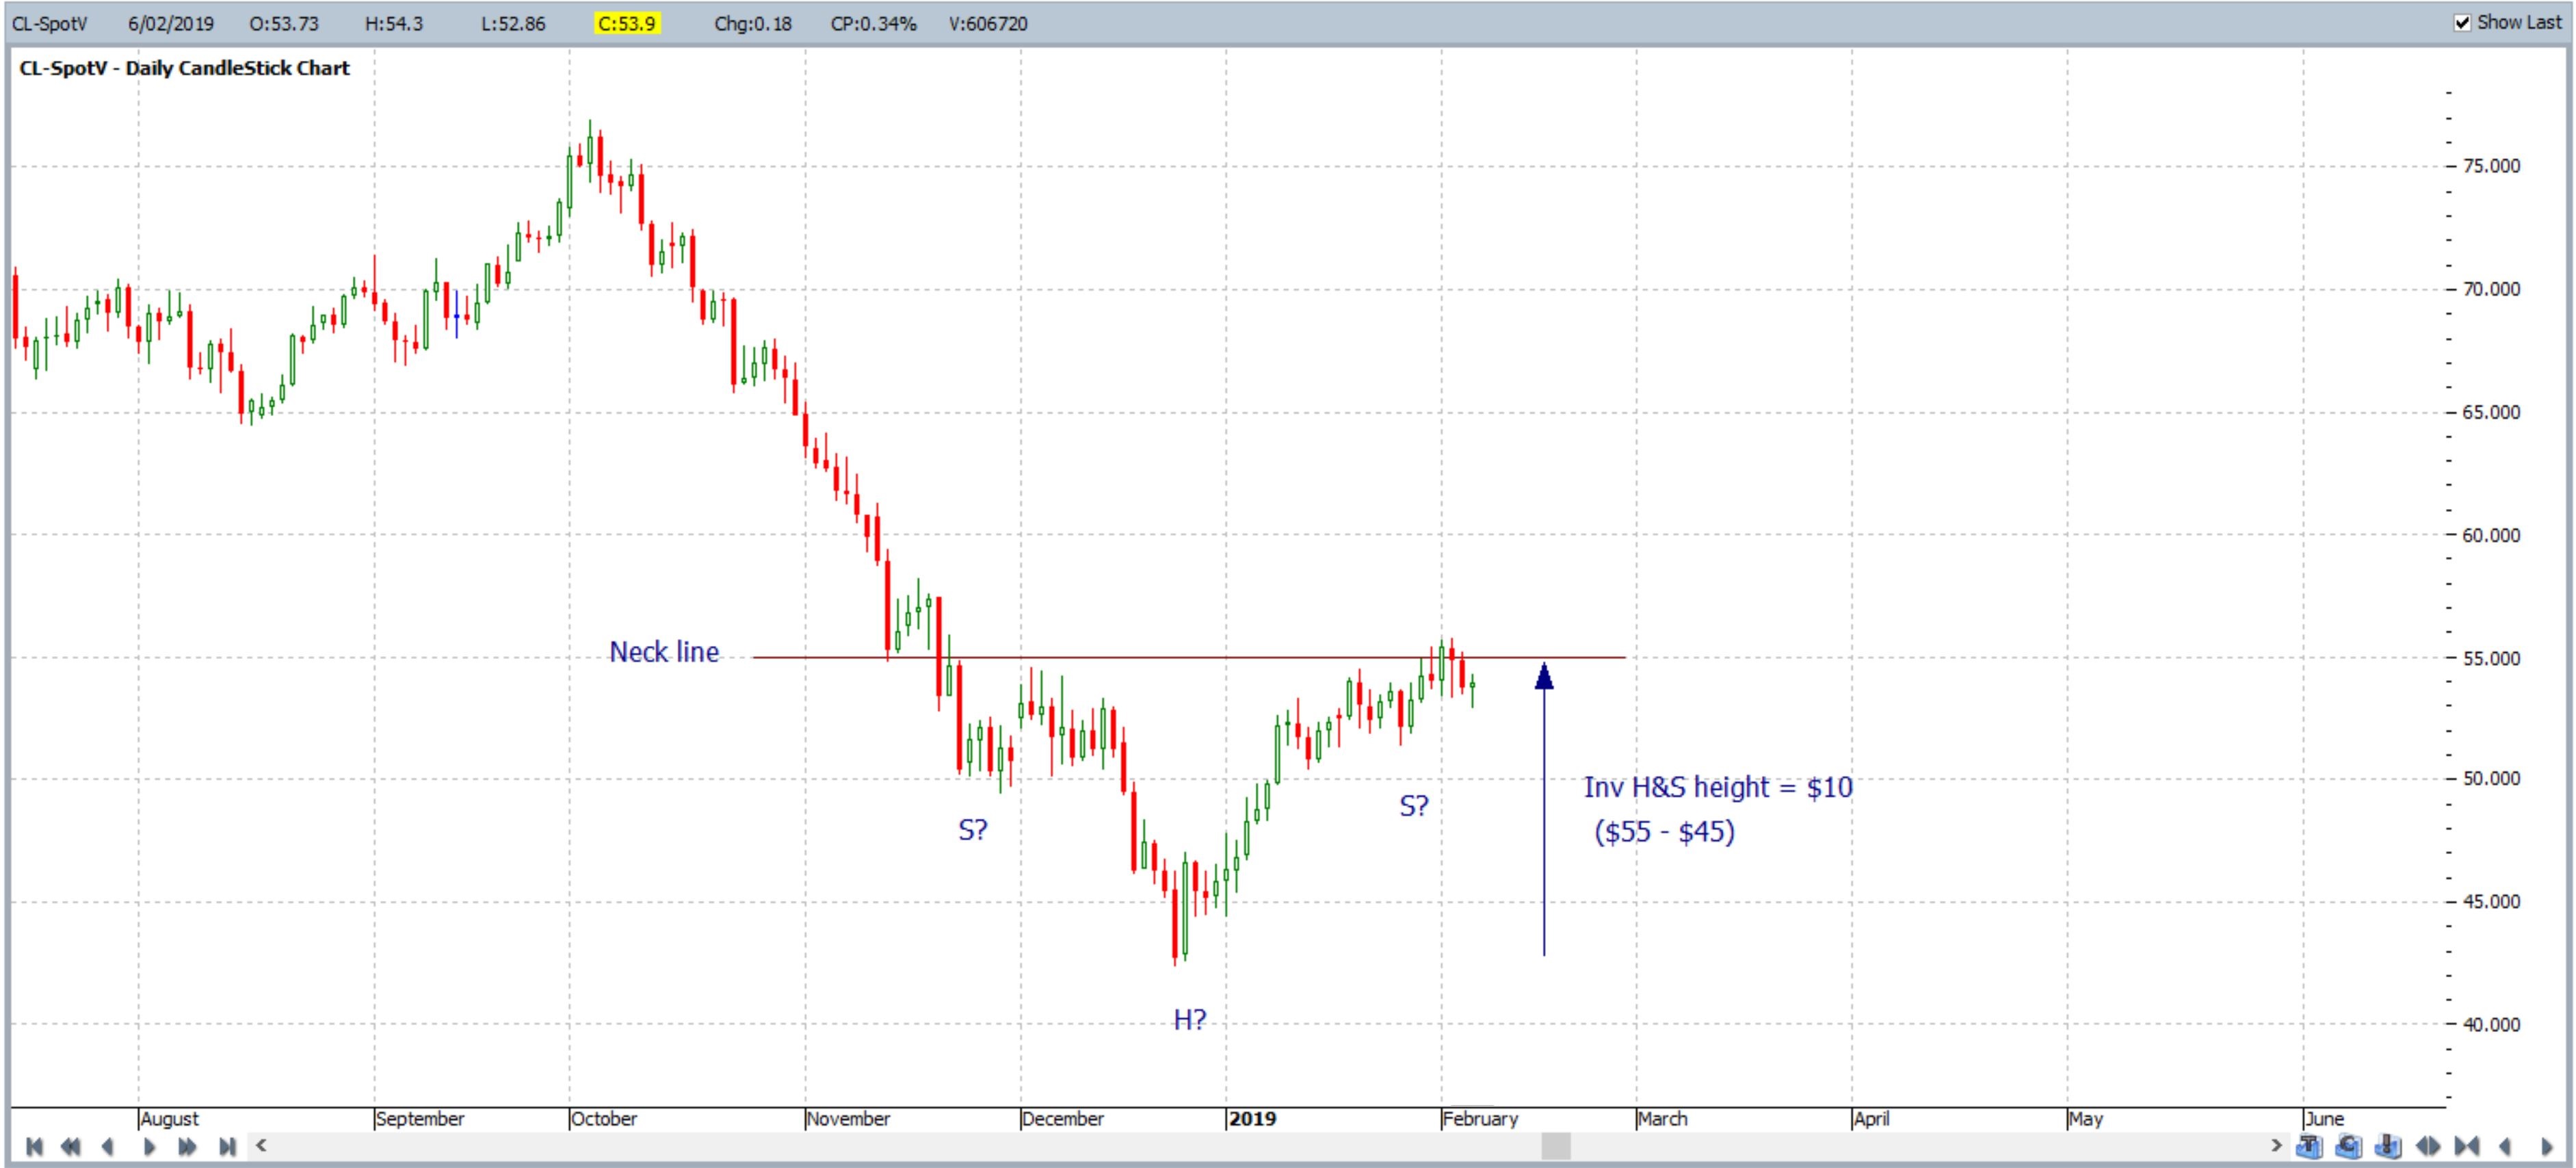
Oil daily: this Height of this Inverse Head and Shoulder pattern is around $10, This is measured from the low of the Head up to the horizontal ‘neck line‘:
Oil daily: the target for any breakout move would be for a $10 rise above the neck line which, in this instance, came in at around $65. The chart below shows that this was also a region of prior Support / Resistance and so this would give added confidence in this level being used as a profit target:
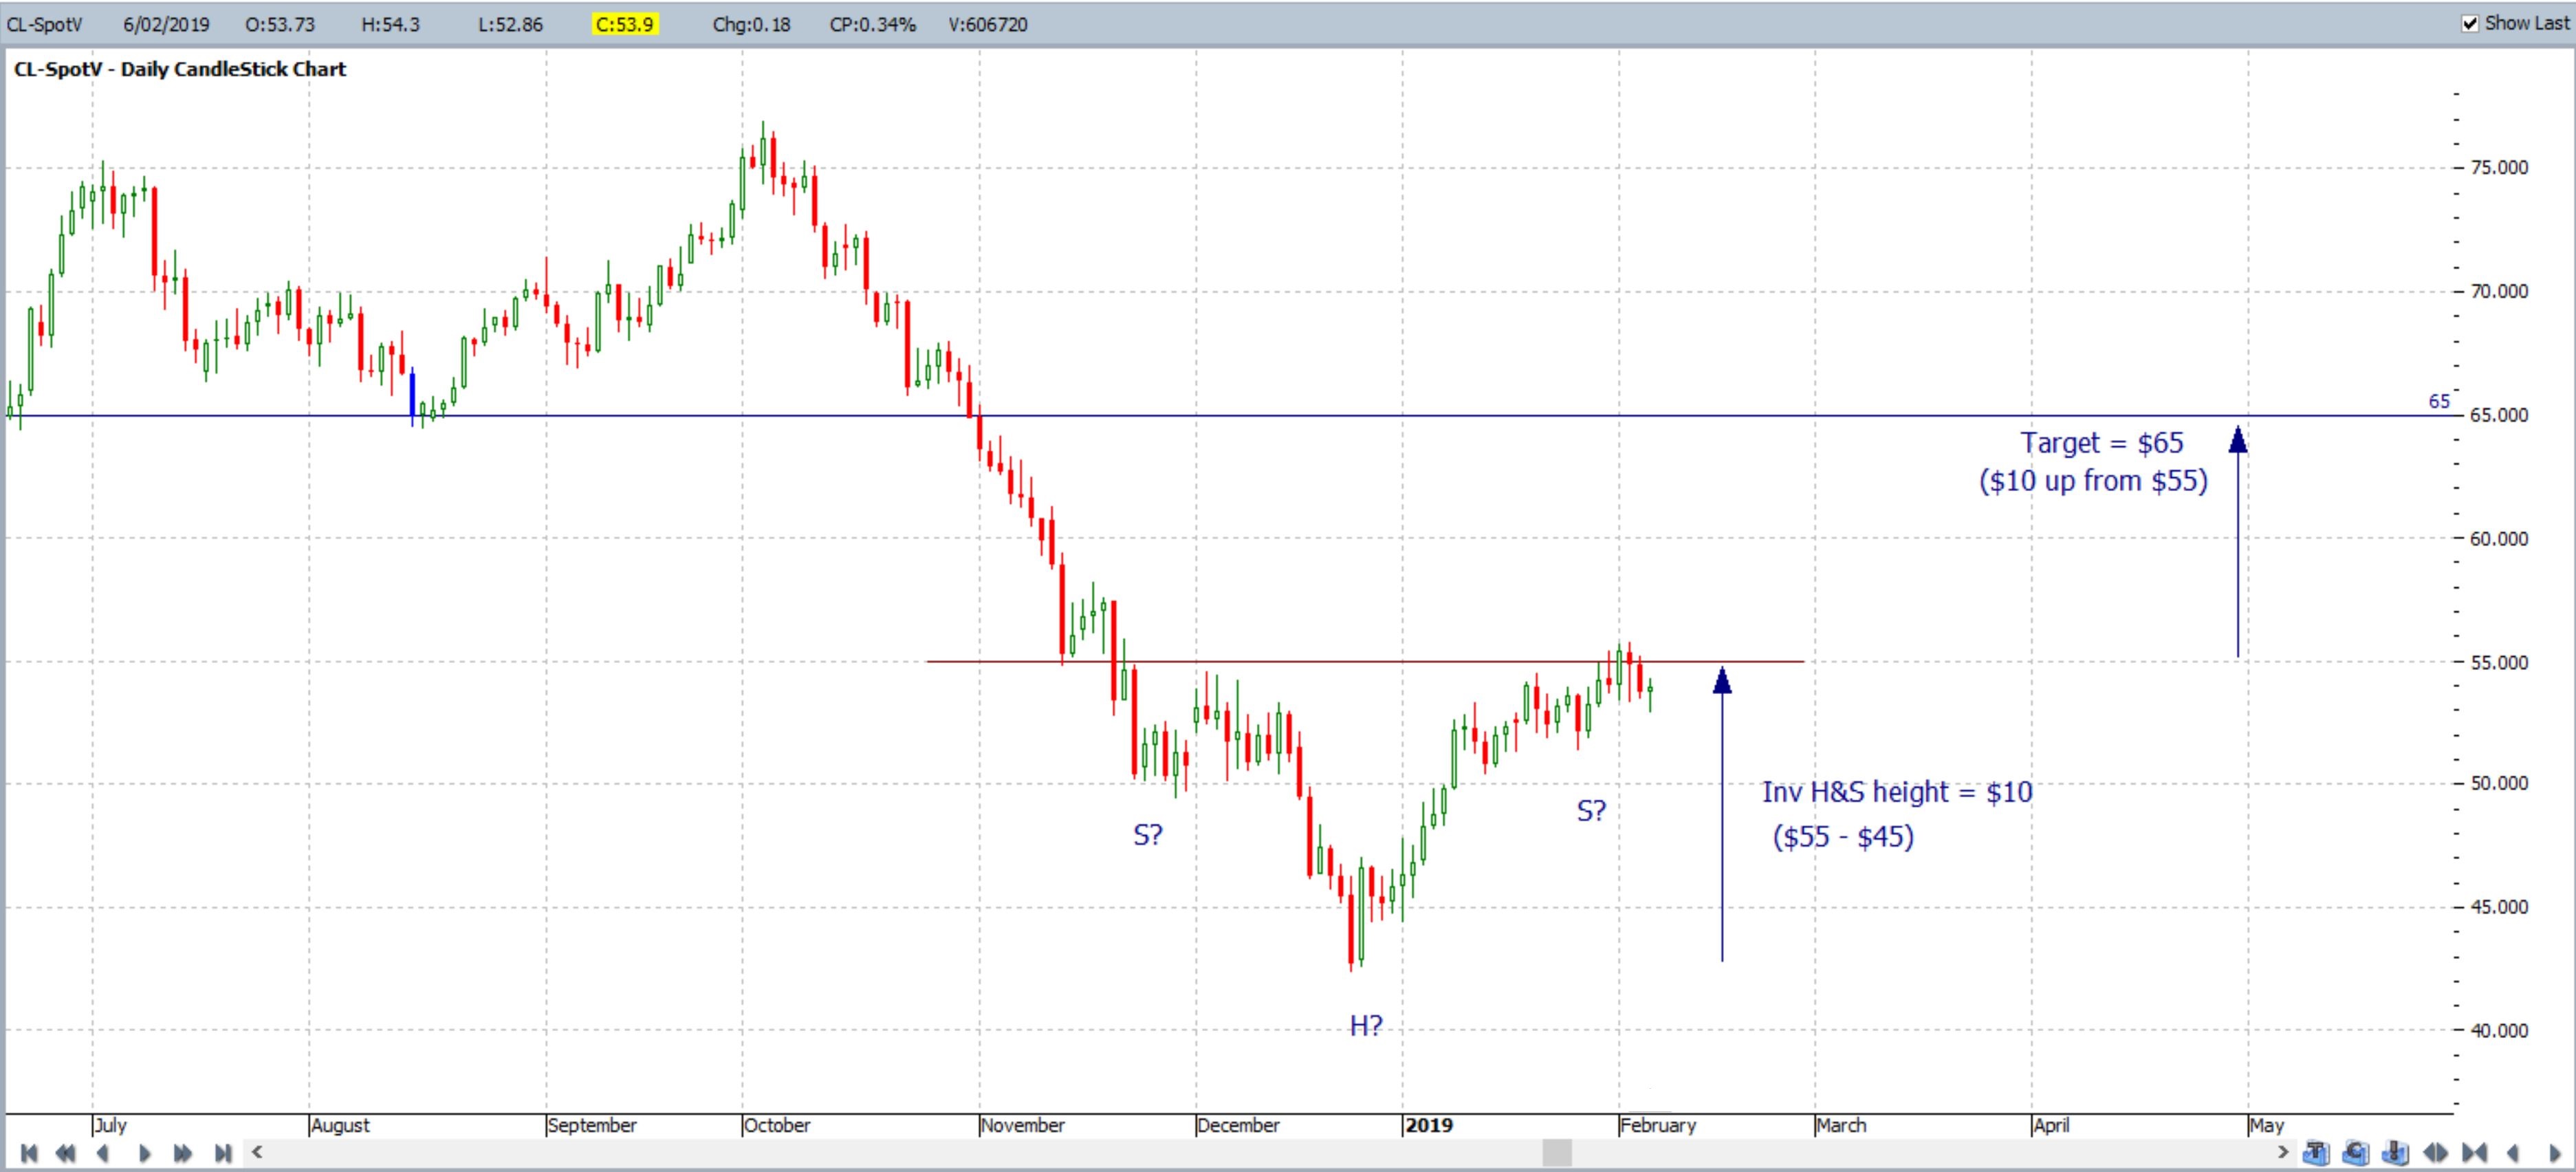
Oil daily: there was another area of confluence around this $65 region. The $65 level was near to the popular 61.8% Fibonacci level for this swing Low move. That would give even more confidence in using this level as a take profit target.
Oil daily: the chart below shows that the $65 target was reached in late April.

Summary:
The Inverse Head and Shoulder is one example of a technical pattern that can evolve on charts. They are not all that common so are worth mapping when they do evolve. There are no guarantees with any technical trading but using a confirming momentum or volume indicator can help give traders more confidence with any trend line breakout. As always, traders should exercise appropriate risk management with any trading.