This post was prompted by an ATAA member asking for me to look back at charts of past market pullbacks and to try and find any recurring or identifiable chart patterns. I checked back through the S&P500 and ASX-200 and, whilst it wasn’t a chart pattern, a chart phenomenon did emerge: that being a pullback to the 61.8% Fibonacci and a break down through the weekly Ichimoku Cloud. I stress, at this point, that there is no way of knowing yet whether the economic impact of Coronavirus will be as significant as the issues triggering the 1987, Dotcom and Global Financial Crisis major market corrections. As well, technical analysts always warn that past performance is no guarantee of the future, but, one does have to wonder if history might be a strong enough pull here to repeat itself!
S&P500
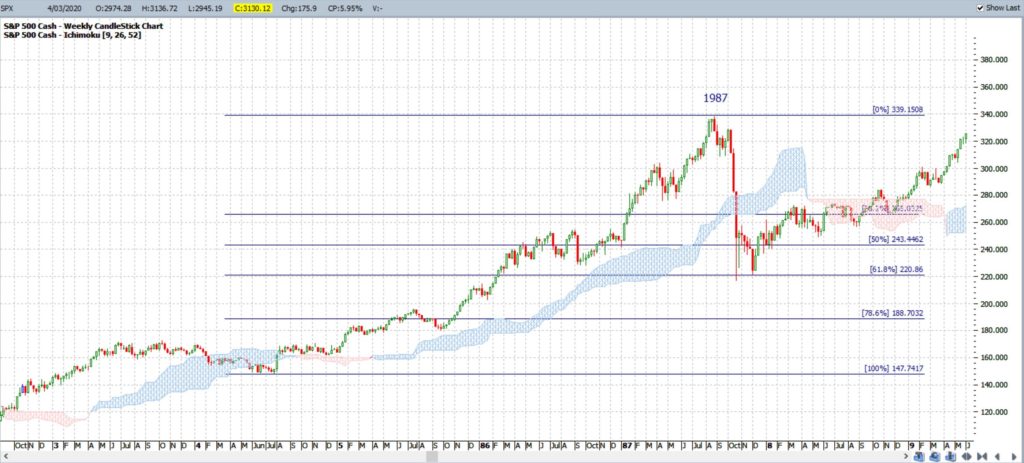
SPX: 1987: The 1987 market crash was well before my time with trading and my purpose here is, not to analyse the causes of this correction but, to assess the technical chart behaviour with this event. My main take-away from studying this chart period is that the market pulled back to the key 61.8% level; a popular Fibonacci level for traders and analysts and the index also fell below the support of the weekly Ichimoku Cloud.
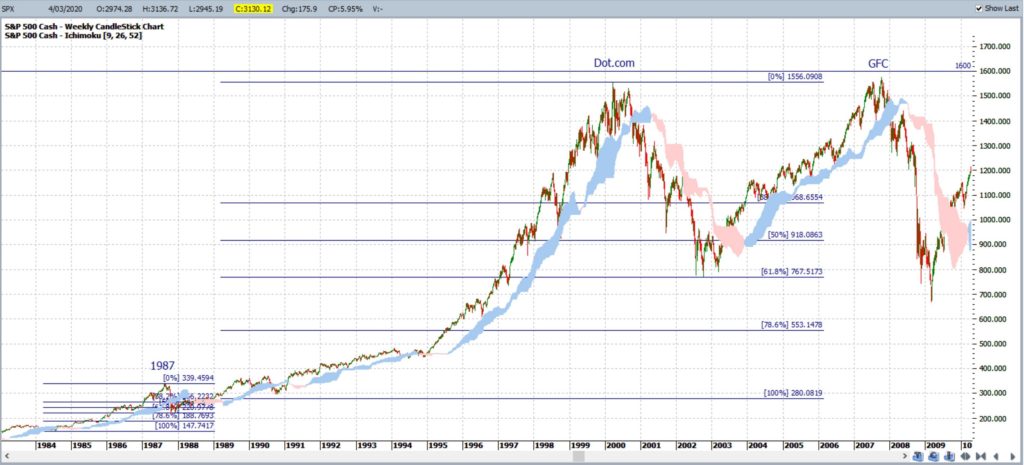
SPX: Dot.com & GFC: The 2000 Dotcom bubble crash was another correction before my time and, as above, my main interest is the chart pattern. Note how price action pulled back to the 61.8% Fibonacci move of the swing High that followed on after the 1987 correction and also fell below the weekly Ichimoku Cloud. The 2008-2009 Global Financial Crisis (GFC) saw a similar peak as the Dotcom bubble and a similar pullback level:
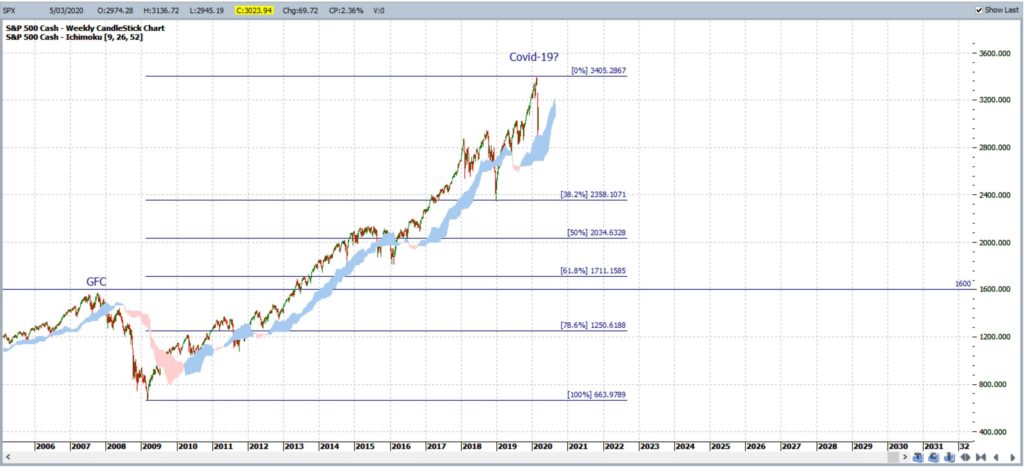
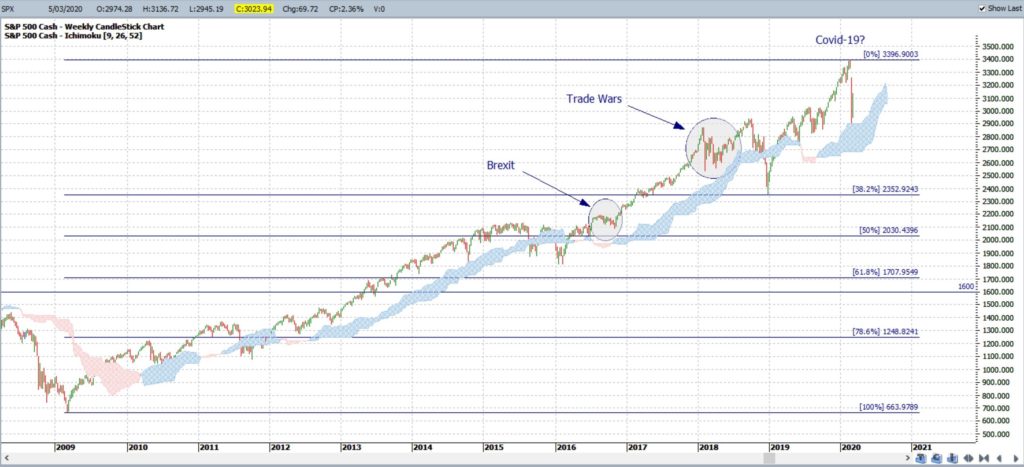
SPX: Covid-19: So, will history repeat itself here and will the index pullback to the 61.8% Fibonacci due to any deepening Covid-19 correction? No one can predict an outcome here but it pays to be mindful of this major pullback level; should the market correction continue. Note how price action is currently just above the weekly Ichimoku Cloud:
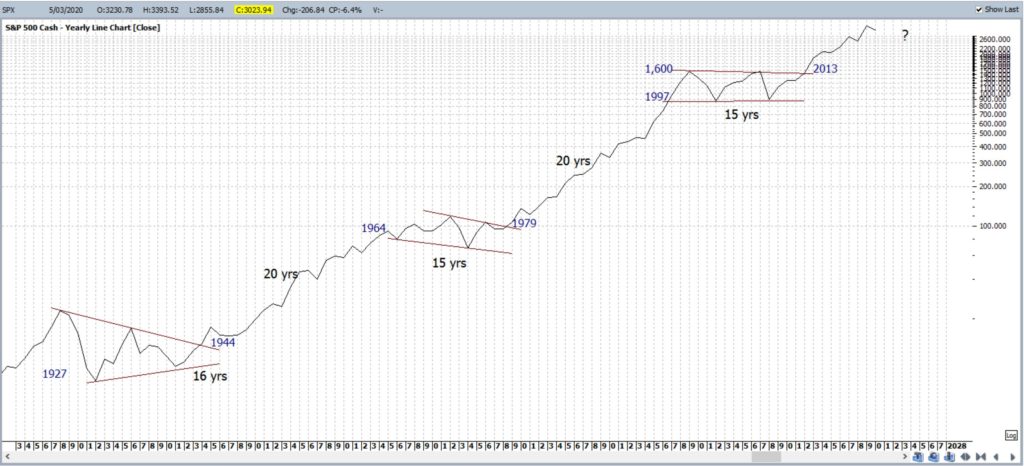
SPX yearly: The 61.8% Fibonacci level, on the chart above, is very near the 1,600 level. The 1,600 level also happens to be the upper region of the breakout from the the most recent multi-year consolidation phase, for added confluence:
SPX- Brexit and US- China Trade Wars: It is worth noting at this point that the impact from Brexit and the US Trade War, highlighted on the chart below, did not result in as much of a market pullback. Note how the weekly chart price action remained above the support of the Ichimoku Cloud for much of these two periods. Price action remains above the Ichimoku Cloud for the time being so this would be one metric to monitor in coming trading sessions for the S&P500:
ASX-200 / XJO
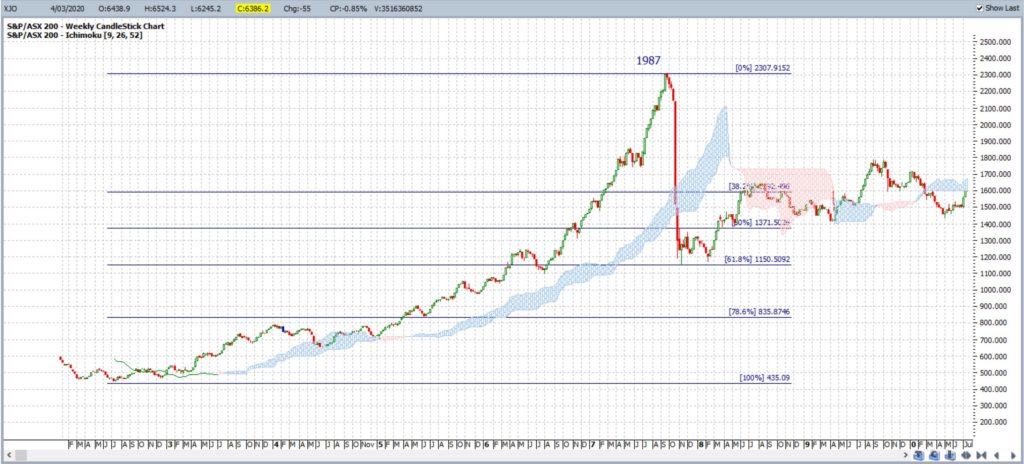
ASX-200: 1987: The reaction to the 1987 crash was of similar magnitude for the ASX-200 as it was for the S&P500; a pullback to the 61.8% fib and a break below the weekly Ichimoku Cloud:
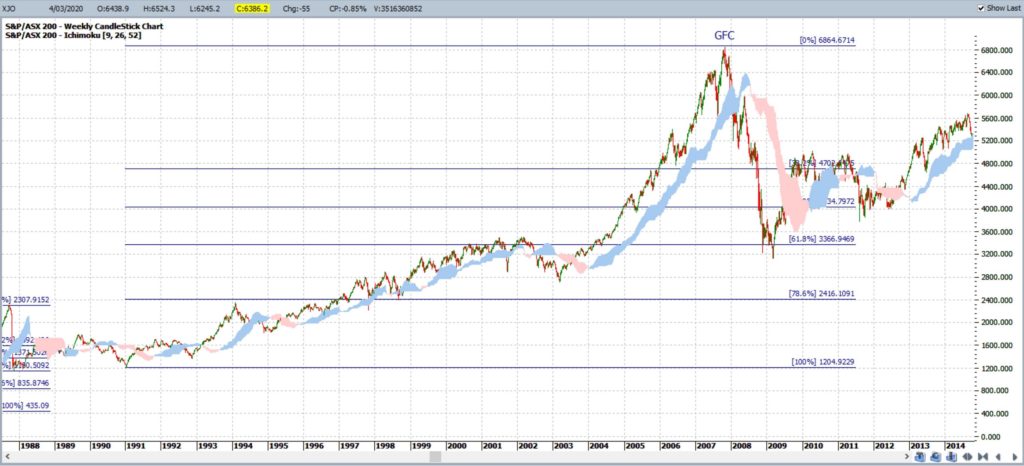
ASX-200: GFC: The 2000 Dotcom pullback was not as marked for the ASX-200, although price action did fall below the weekly Ichimoku Cloud. However, note the pullback to the 61.8% Fibonacci region with the GFC and how price action also fell well below the weekly Ichimoku Cloud:
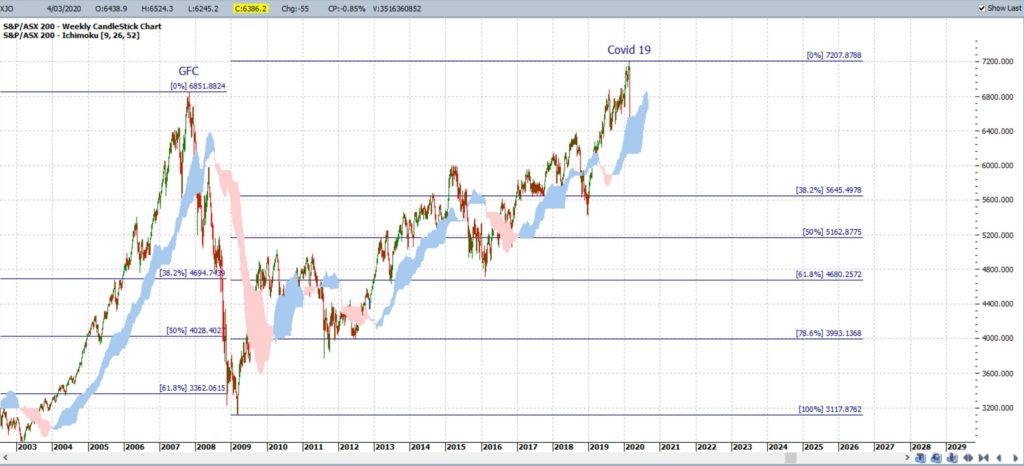
ASX-200: Covid-19: Thus, a similar question can be posed here: will history repeat itself and will the ASX-200 index pullback to the 61.8% Fibonacci region? Like with the S&P500, price action remains above the Ichimoku weekly Cloud so watch this support region for any change in coming trading sessions:
Summary:
The major market corrections of the 1987 crash, Dotcom bubble and Global Financial Crisis all resulted in the S&P500 and ASX-200 experiencing a significant correction back down to the 61.8% Fibonacci level and breaking below the weekly Ichimoku Cloud.
No one can be sure how far reaching the economic impact of Coronavirus will be but the 61.8% Fibonacci level is a long way off for both the S&P500 and ASX-200. Price action also remains above the weekly Ichimoku Cloud for the time being but this would be one proximal metric I suggest you watch to assess any deepening pullback on both indices.
The important point is not to be panicked or alarmed by this potential but to manage risk and trade size appropriate to the recent volatile conditions.
There is a weird tradition in our family of playing Pollyanna’s glad game whenever misery might strike and I would invoke this line of thinking here, should the market pullback deepen across global indices: be glad that any pullback to the 61.8% Fib level is generally followed by a lengthy market rally!


