


Advanced Micro Devices Inc (AMD) is one of my favourite NASDAQ stocks to trade and it enjoyed a great swing high move from May to September of this year. The last few months have been rough going for the stock with price action pulling back quite significantly. However, I am on the lookout for any recovery move here and in this post I explain what levels and activity I will be looking for.
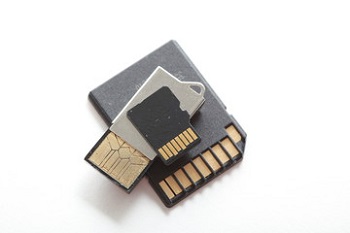
AMD monthly: price action is back negotiating the $20 S/R level and the monthly chart reveals that this region is rather significant S/R for AMD. Watch to see where the stock closes for the week and, later on, for the month:
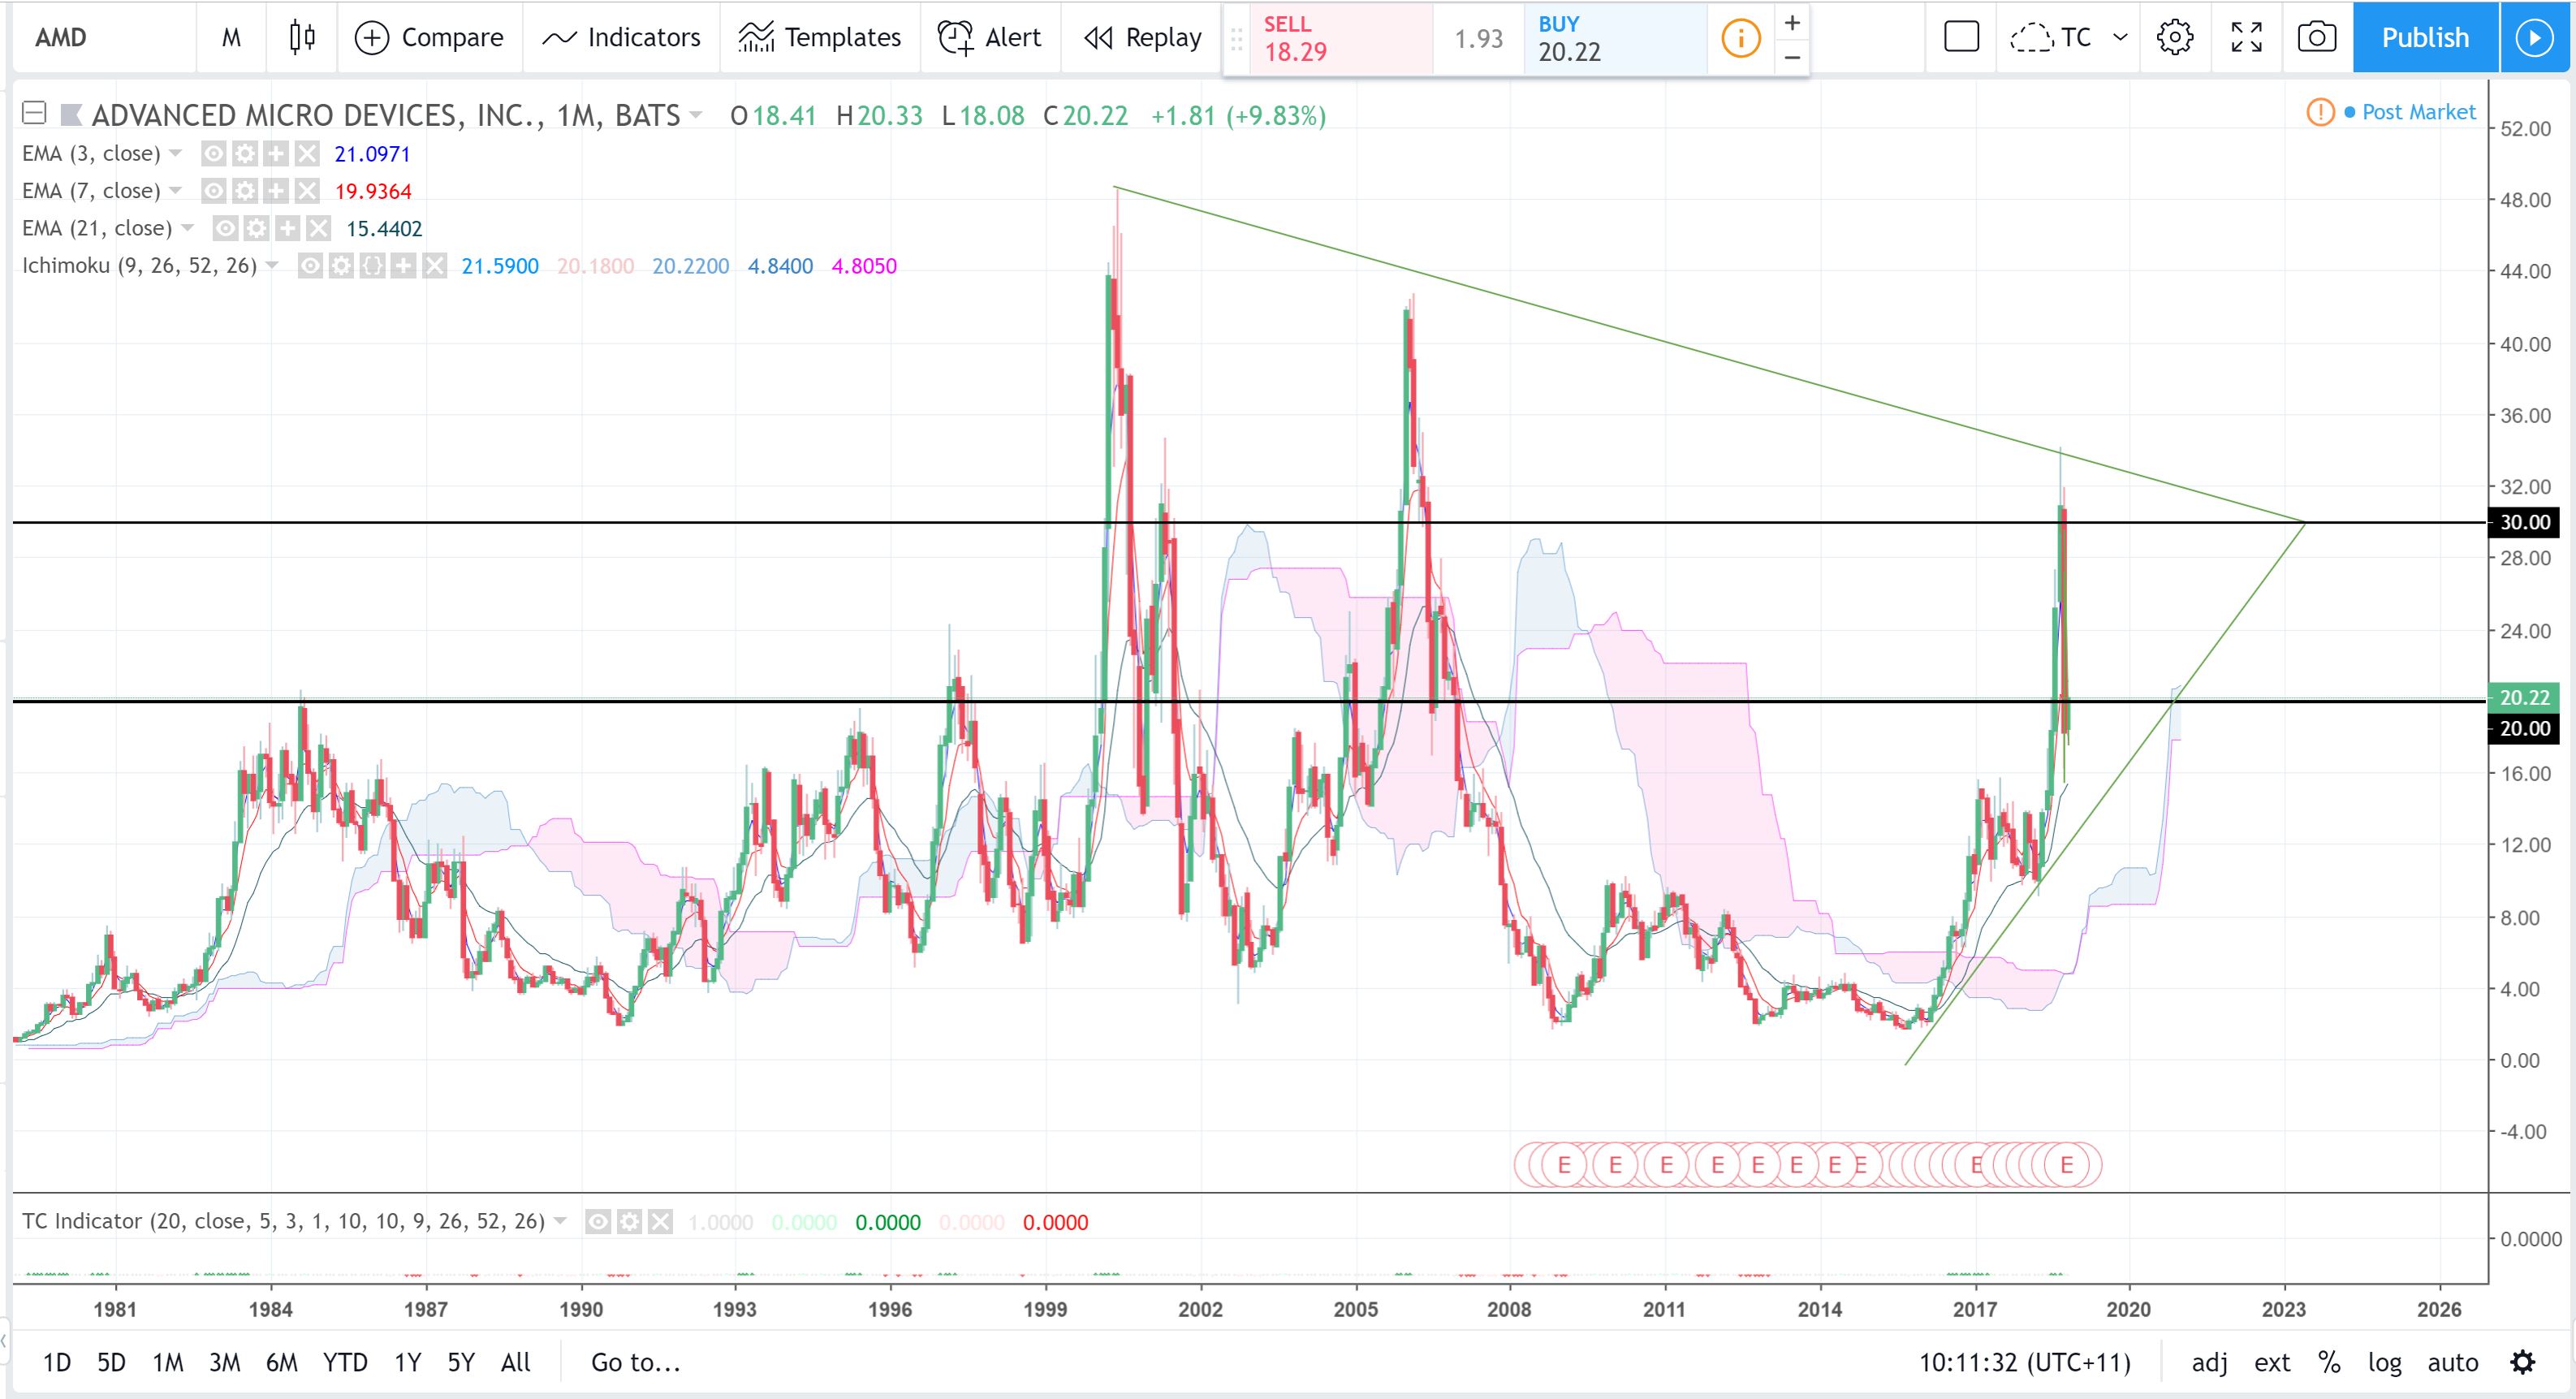
AMD weekly: the longer term weekly chart here shows that price action pulled back to the 50% fib of this lengthy swing High move, circa $18:
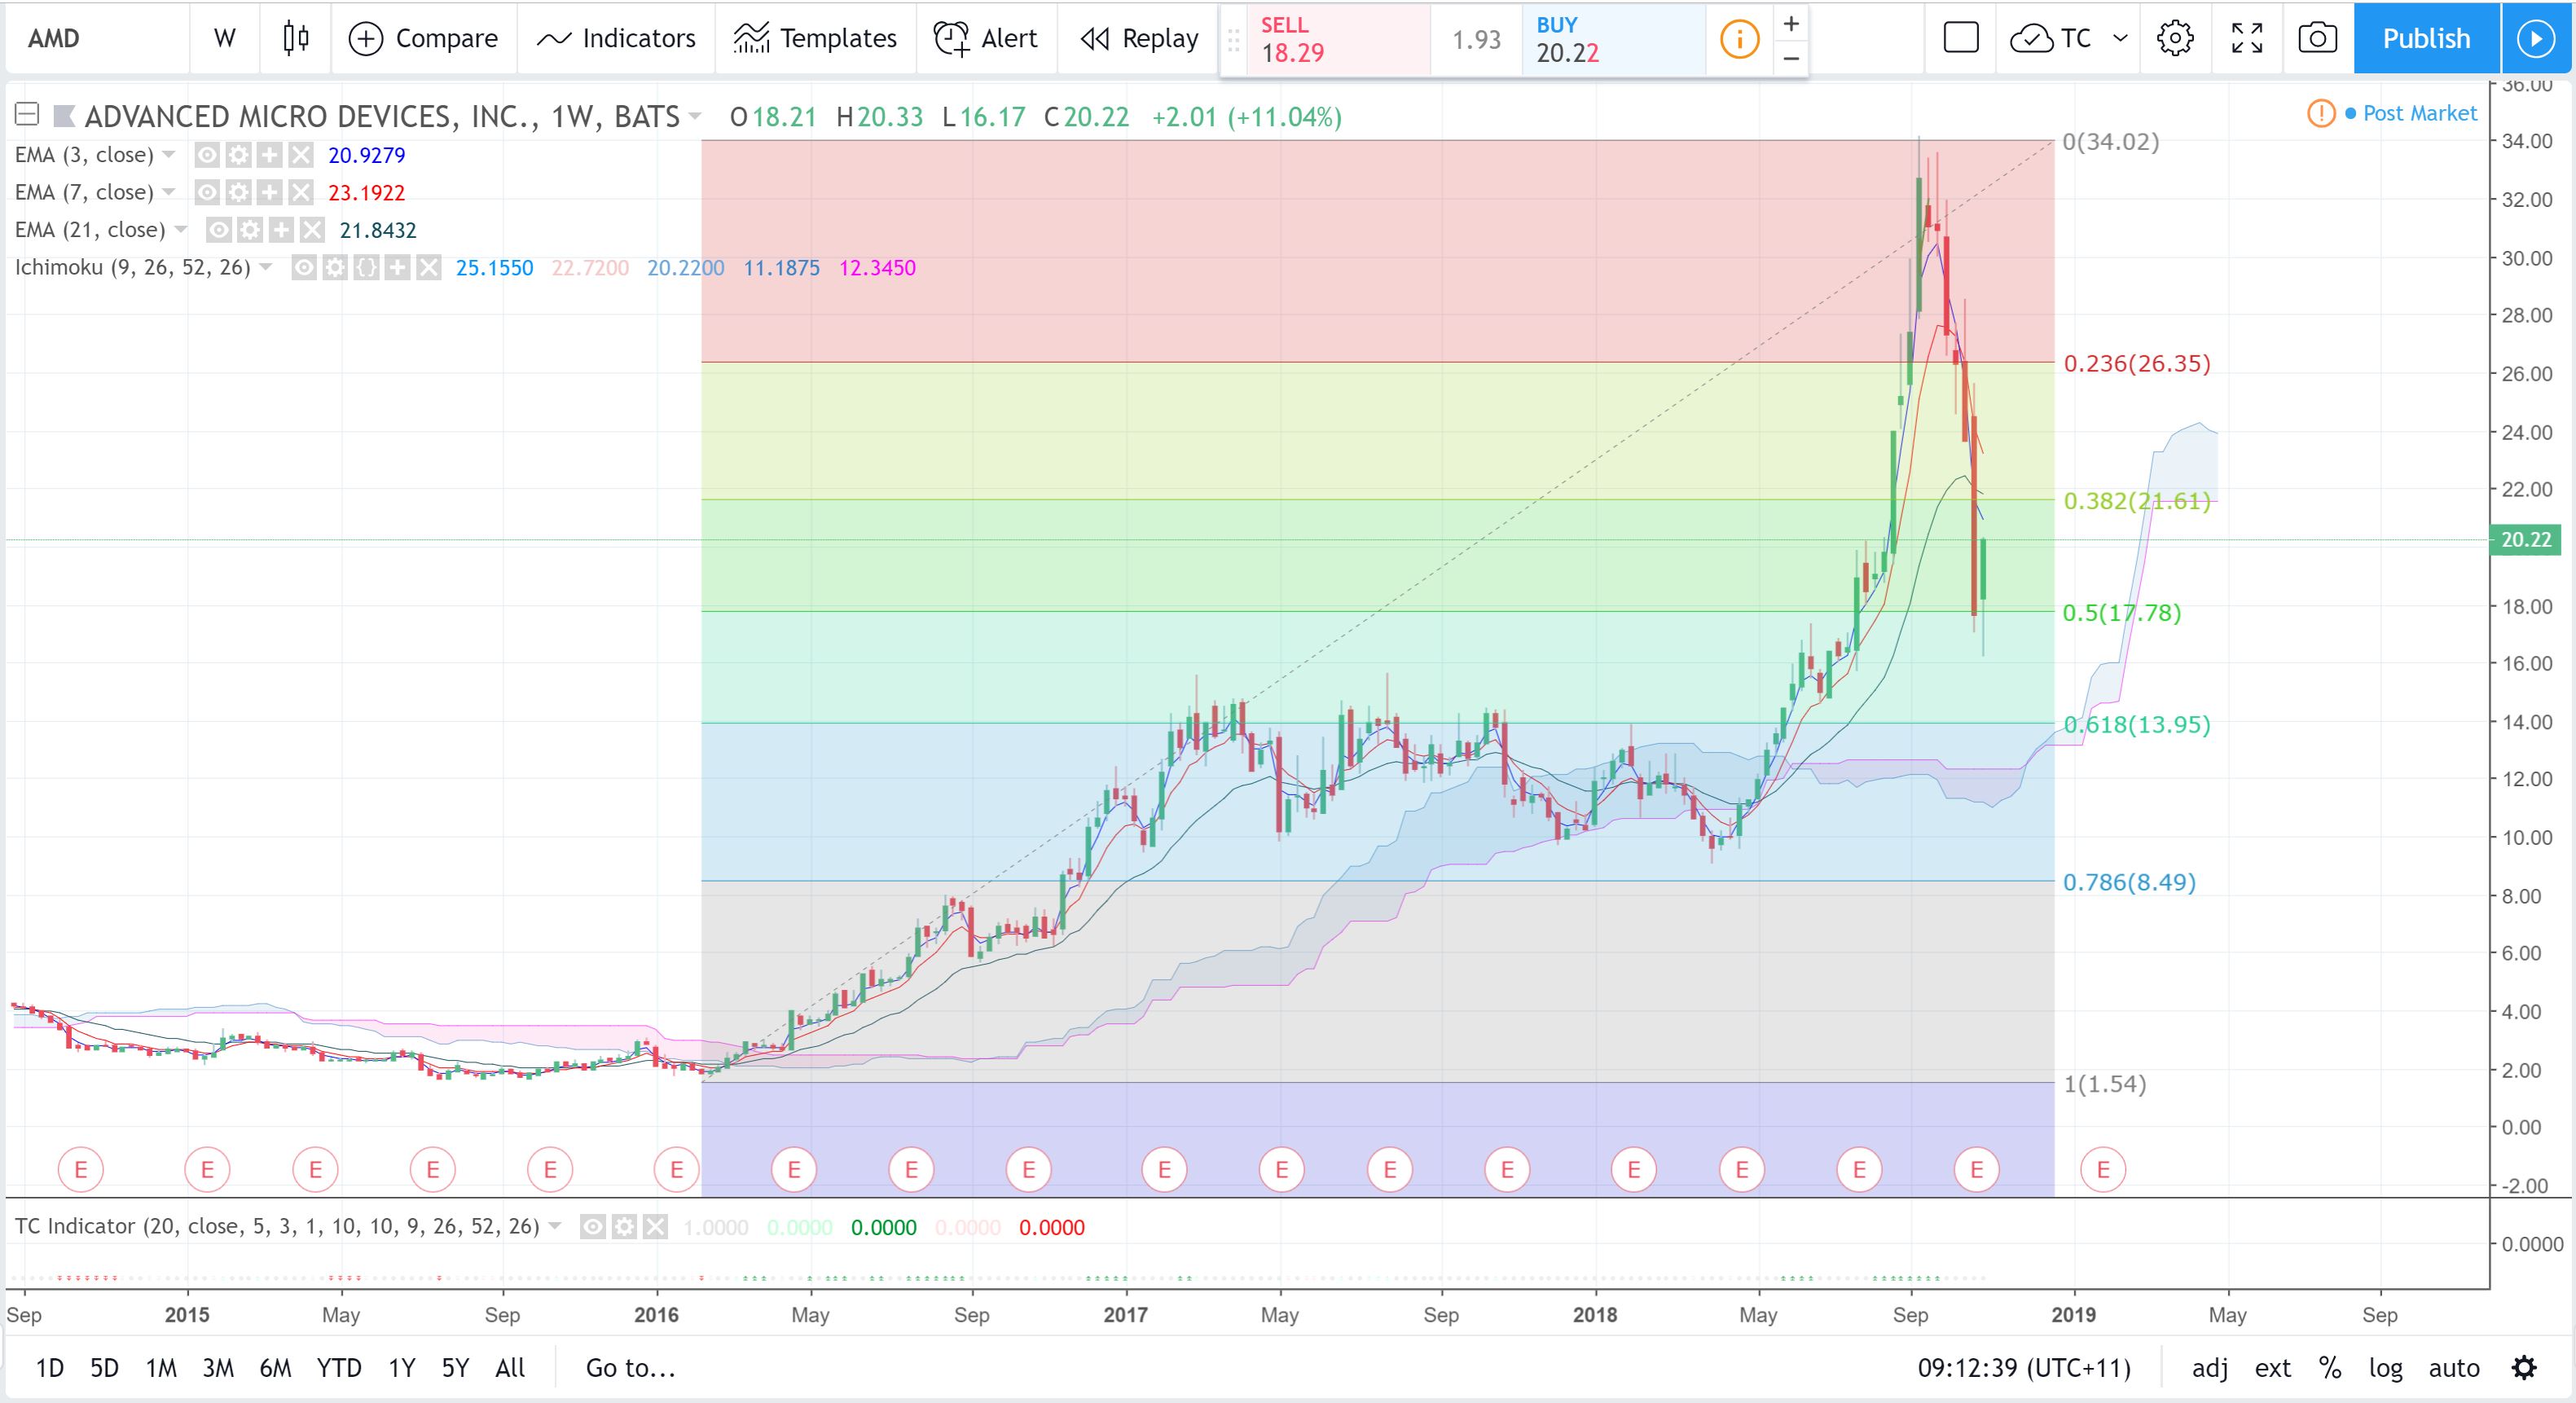
This 2018 swing High move however, on this weekly chart below, shows that the this recent pullback has stalled, thus far, near the 61.8% Fib, circa $18. Note how the current weekly candle is an indecision-style ‘Inside’ candle.
Any close and hold below $18 would have me looking for a move down to the weekly chart’s support triangle trend line which is near the weekly Ichimoku Cloud, circa $12:
AMD daily: there is the look of a bullish-reversal descending wedge brewing here so watch for any momentum-based trend line breakout:
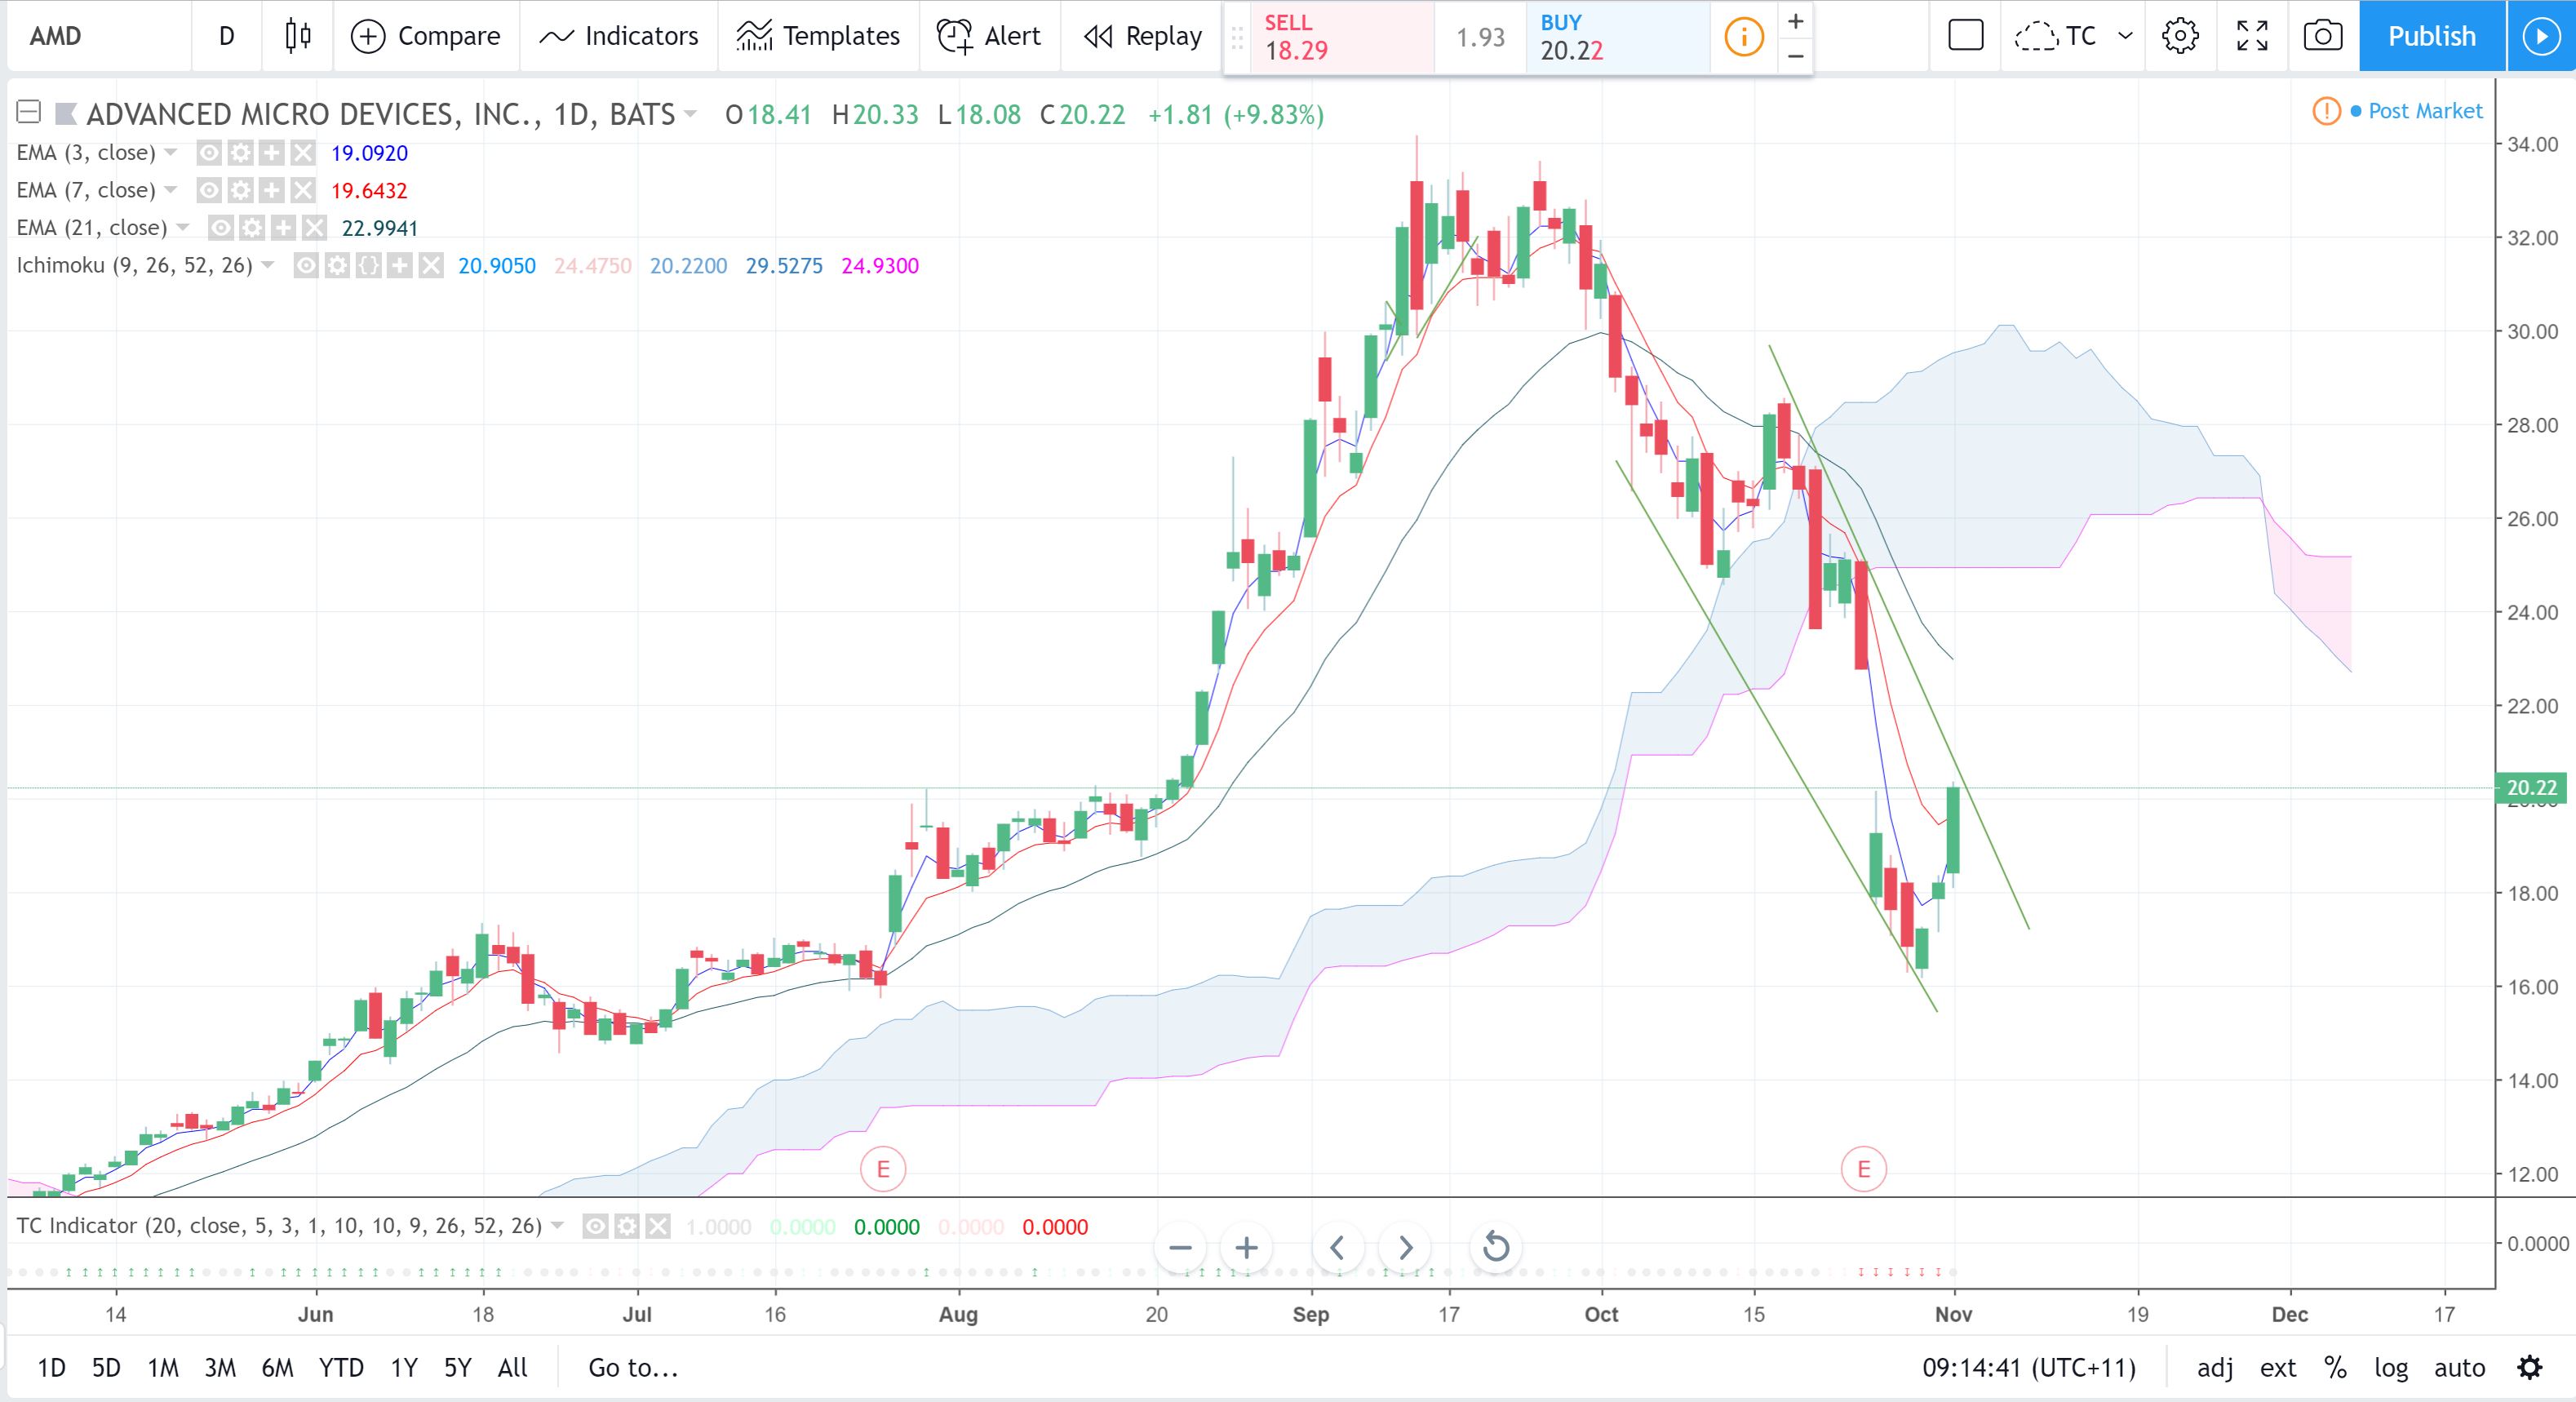
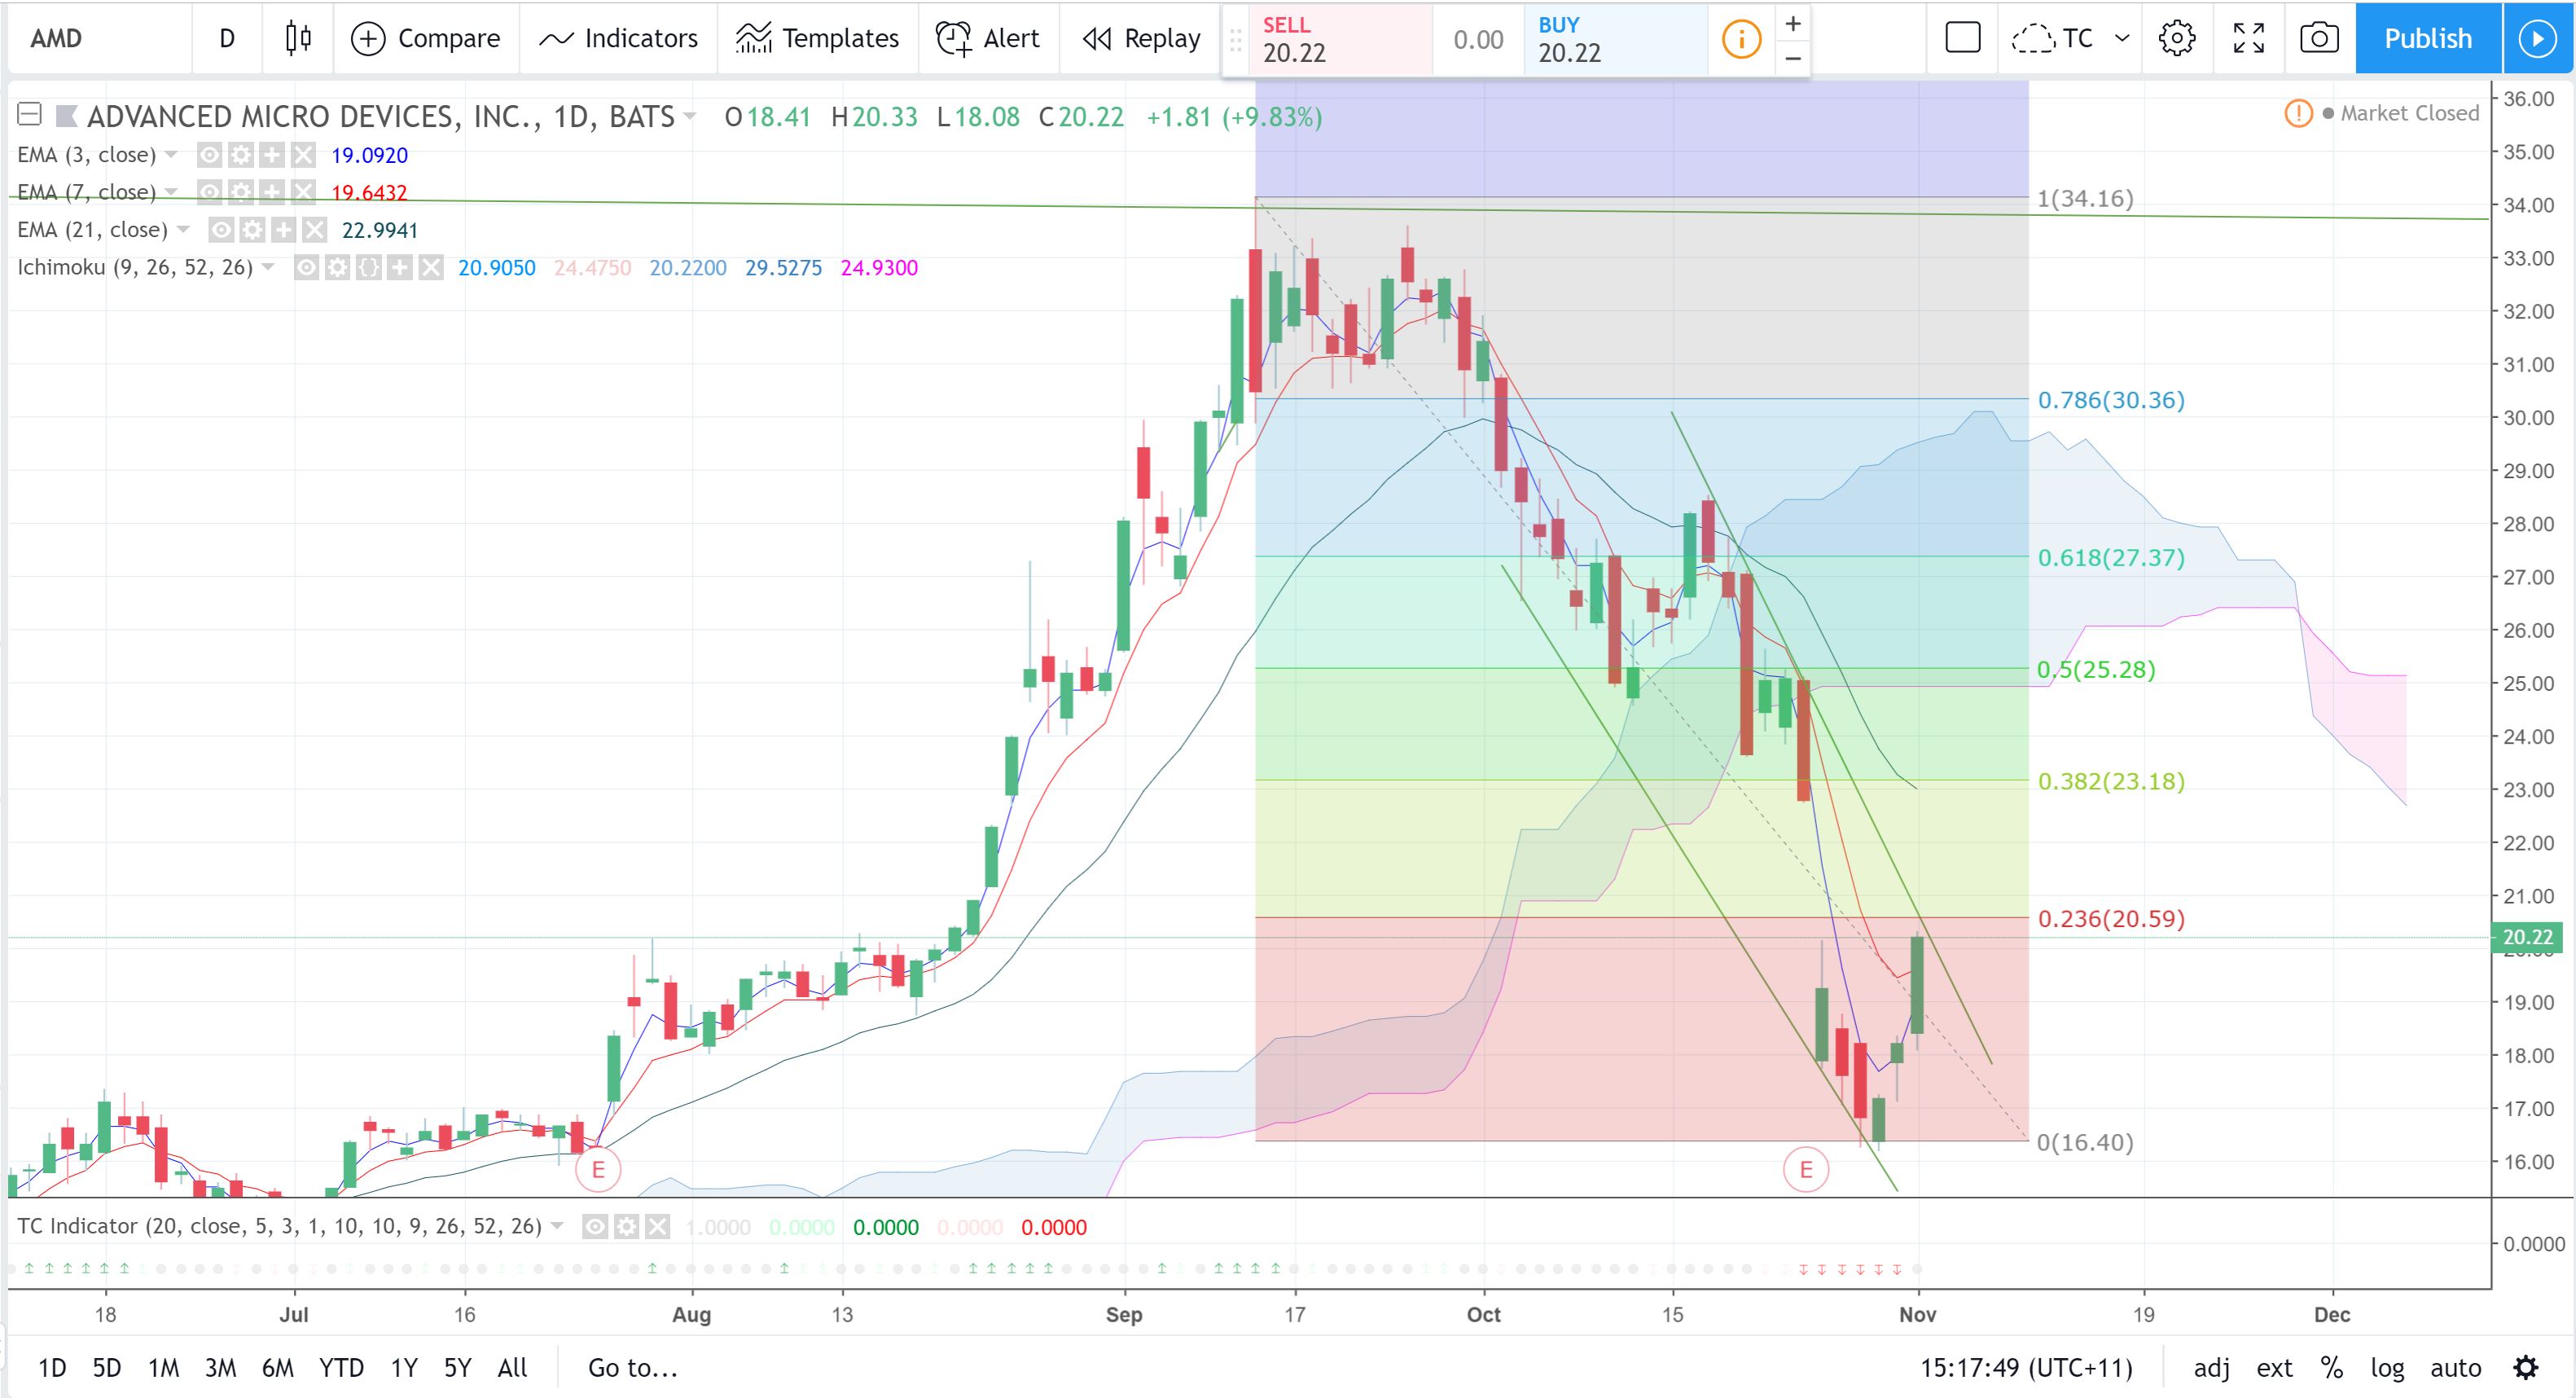
Any bullish breakout would have me looking for a first push up to the $27 region as this is near the 61.8% fib of this recent swing Low move:
AMD 4hr: watch for any wedge breakout:

AMD 60 min: watch for any wedge breakout and new move back above the 60 min Ichimoku Cloud:

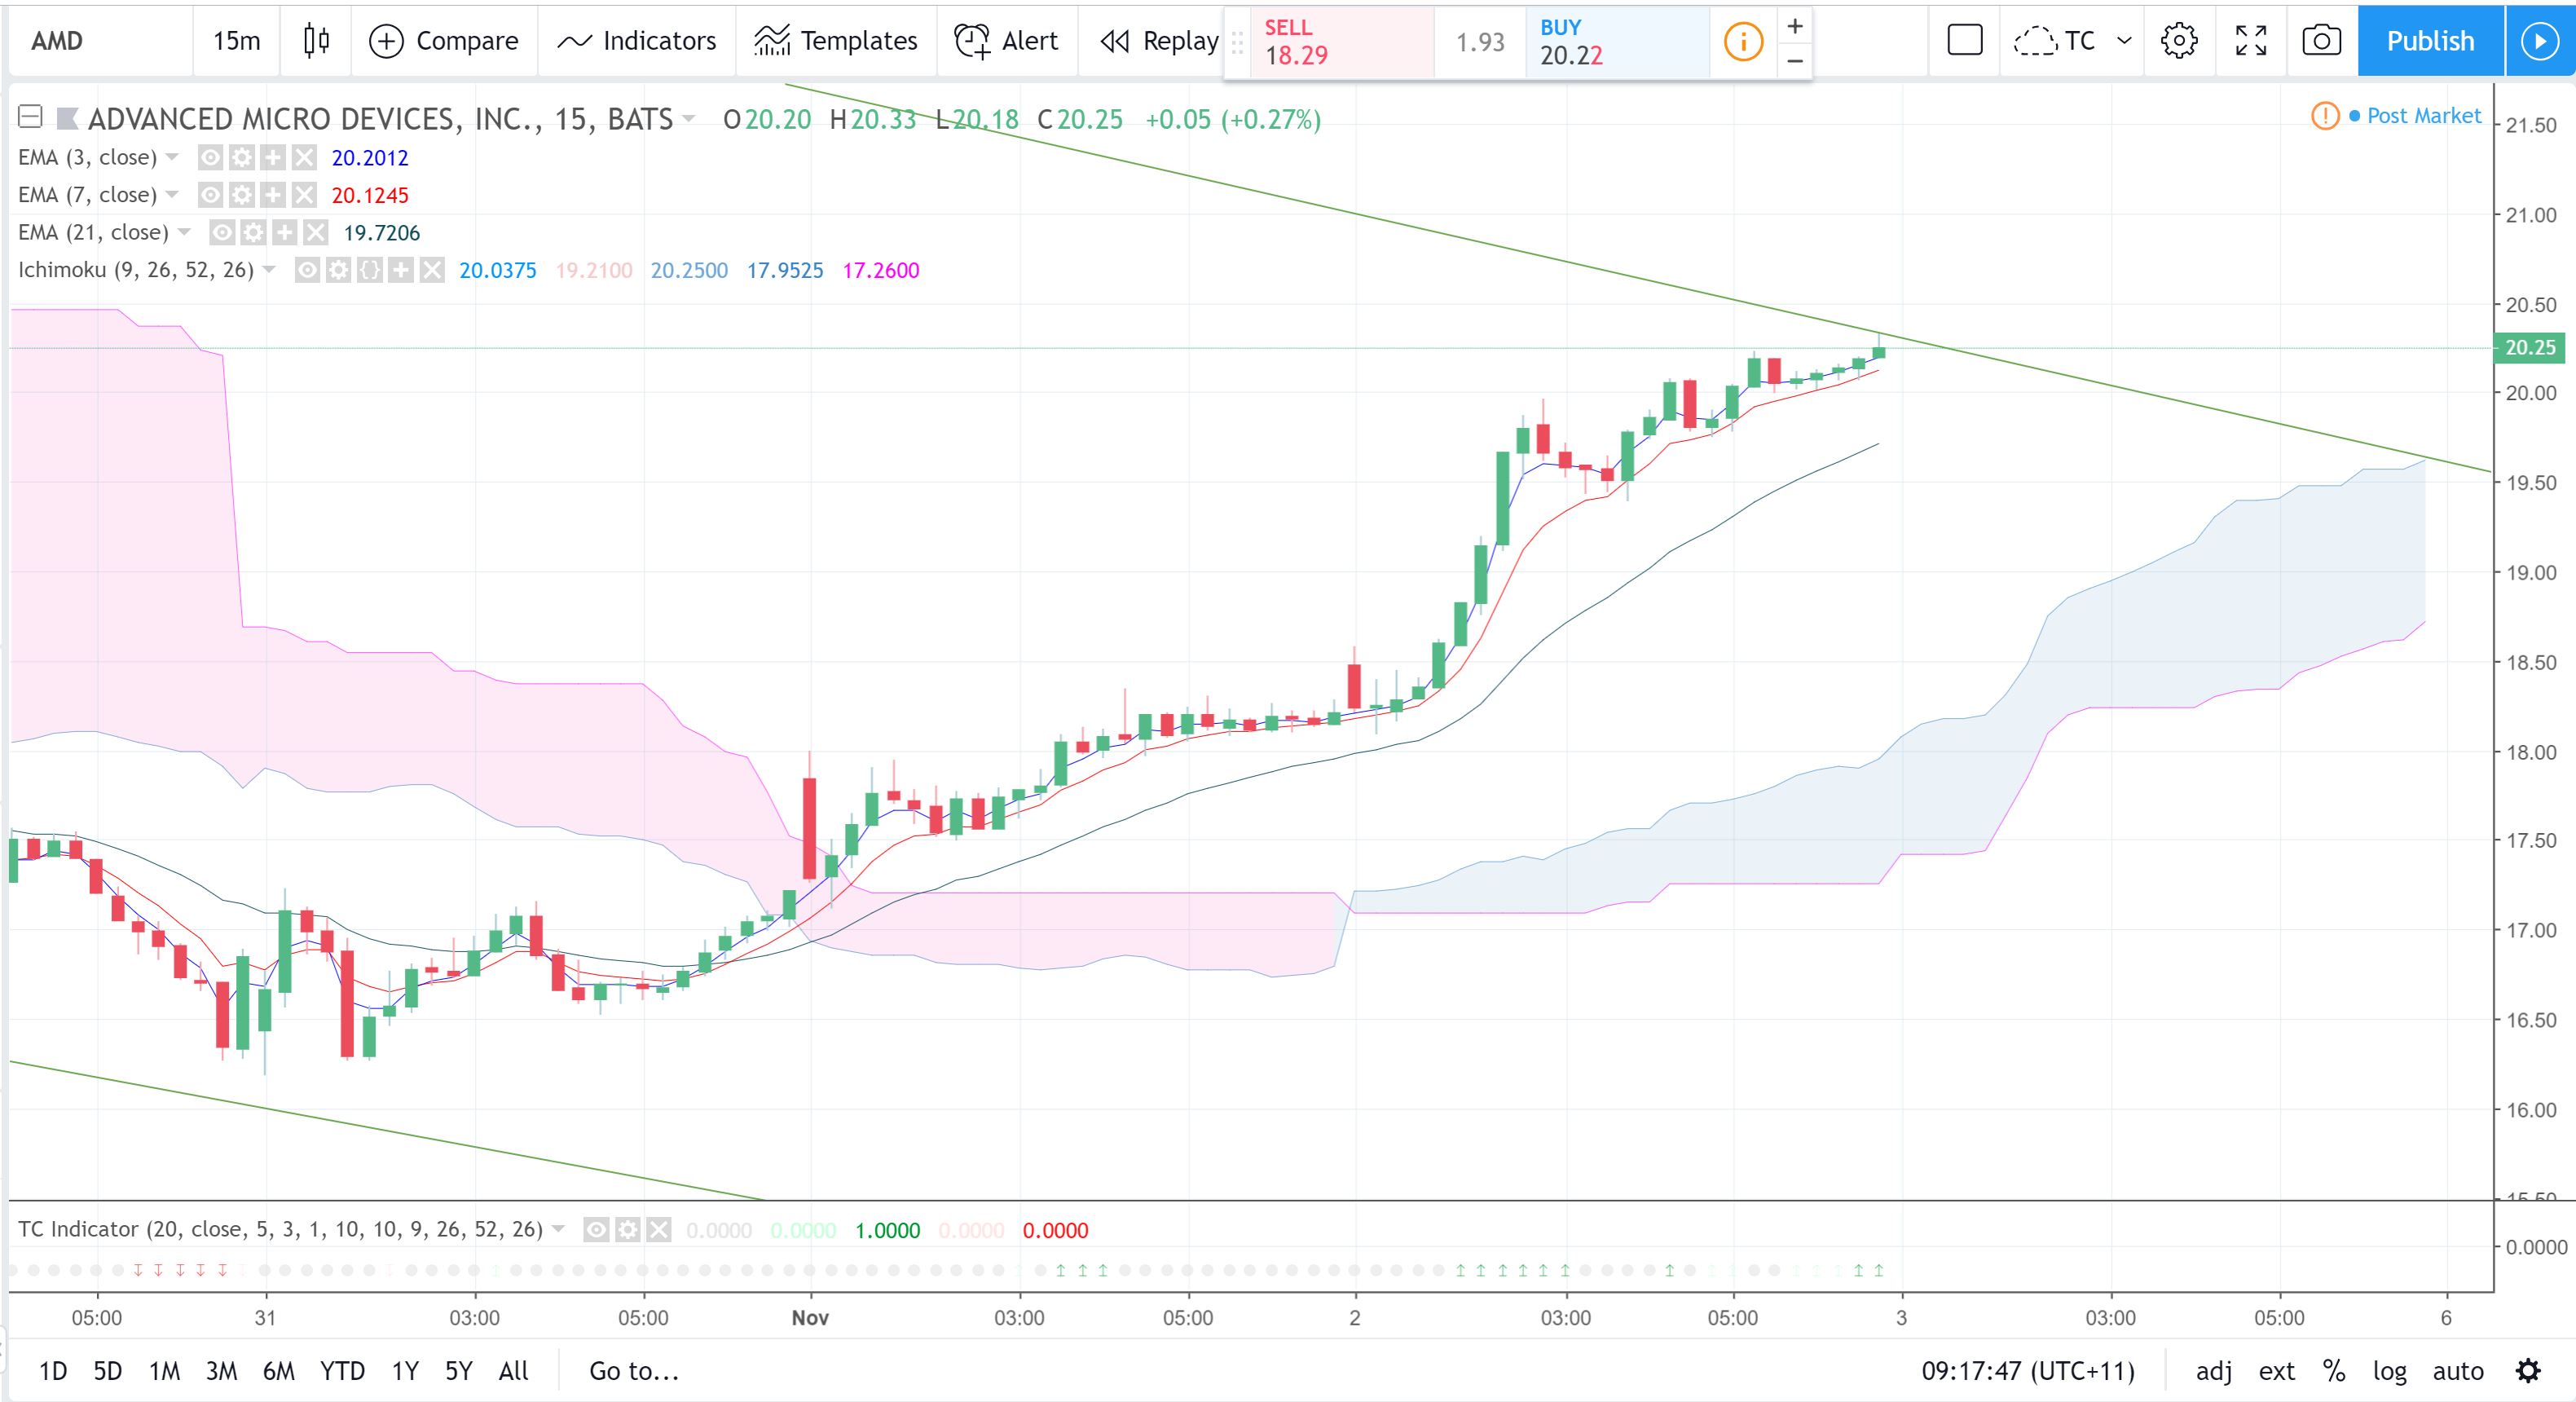
AMD 15 min: Sadly, there was no TC signal with this last push above the 15 min Cloud. Note how price is up near the wedge trend line:
Summary: AMD has pulled back over the last few months and looks to be consolidating within a bullish-reversal descending wedge pattern so watch for any new trend line breakout:
- Bullish Targets from any daily chart wedge breakout: $27 followed by $30 and then $35.
- Bearish Targets from any new close and hold below $18: the weekly chart’s support trend line, near the weekly Cloud, circa $12.
Disclosure: I am LONG on AMD stock.