


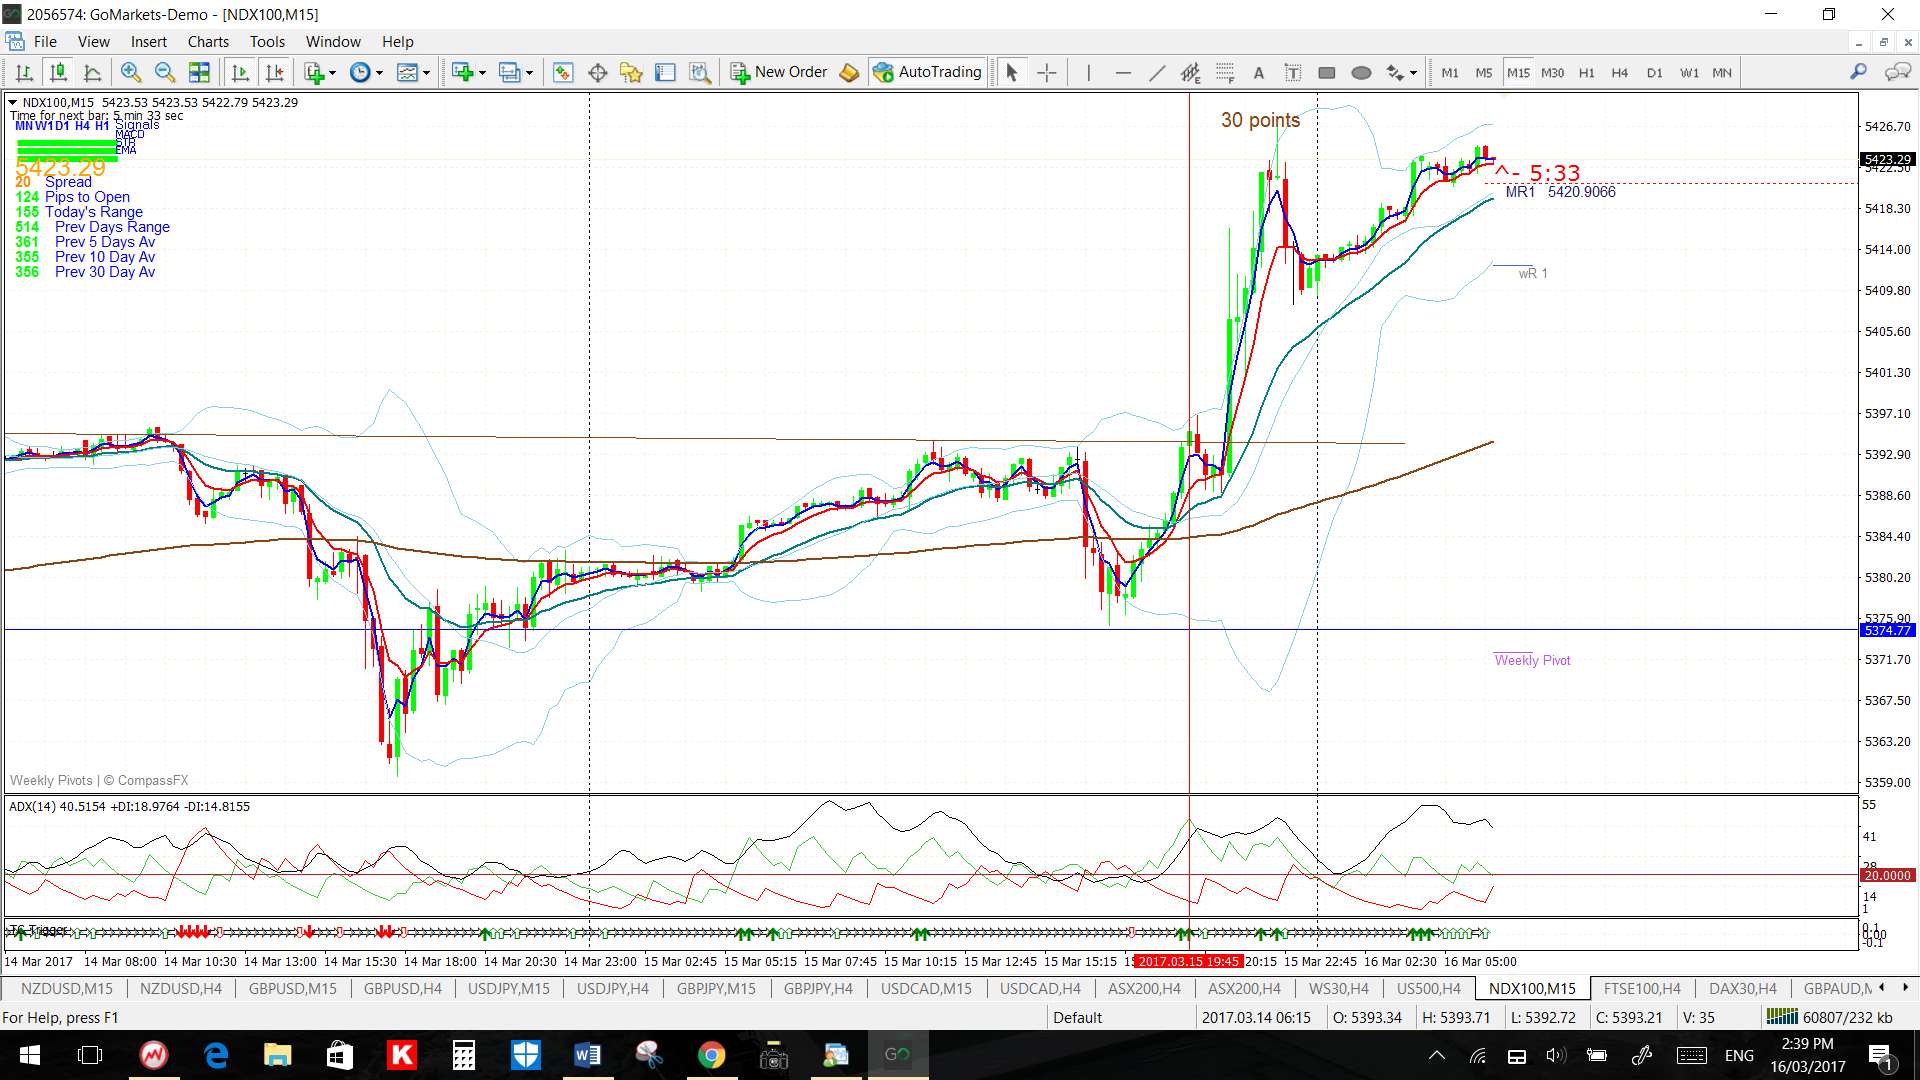
Wednesday’s European and US trading sessions proved to be very productive for Forex trading as written up earlier today. It was also productive for trend line (TL) breakout trades from some of the stock index technical patterns that I had been stalking over recent weeks and the charts are shown below in this post. These breakouts evolved from charting patterns that had been shown on this website well in advance, and for free, for the benefit of all traders. Note how the 15 min chart, for some of these indices, was most helpful in identifying new TC signals right near the trend line breakout move.
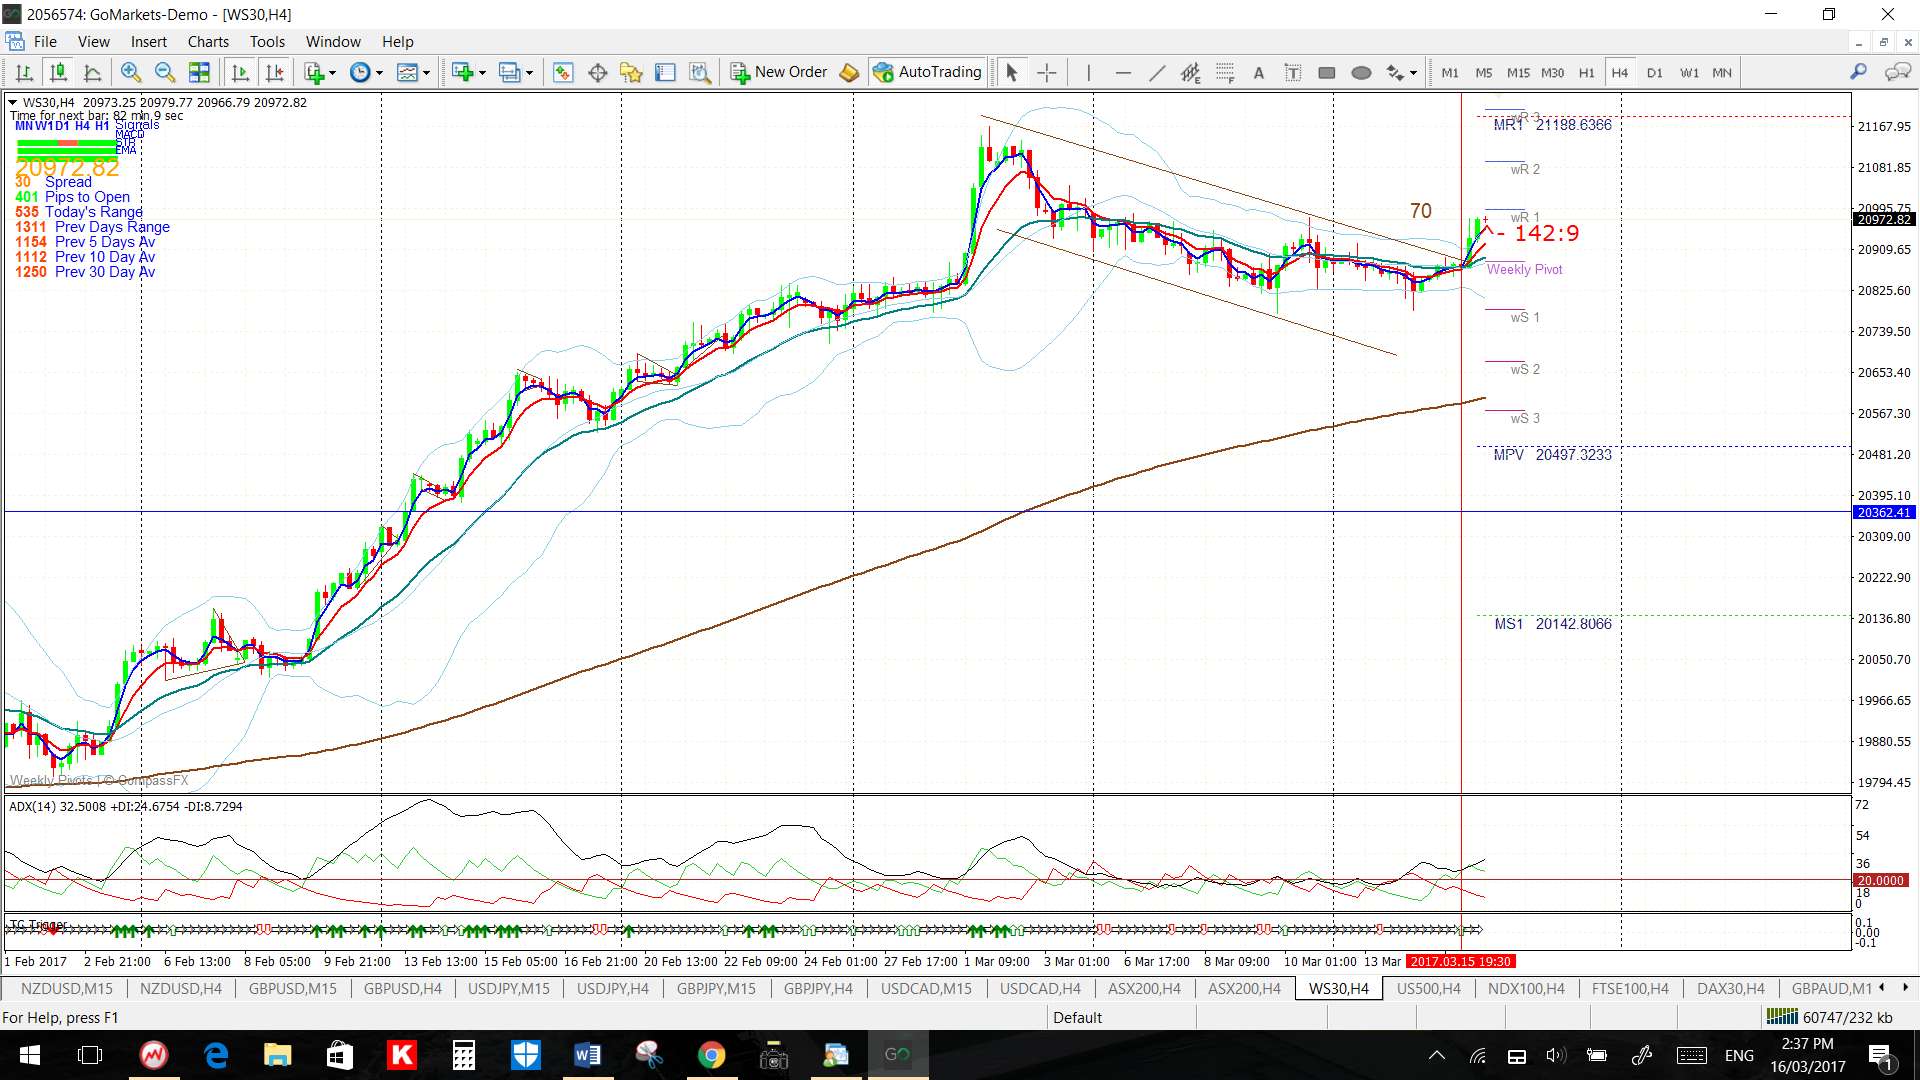
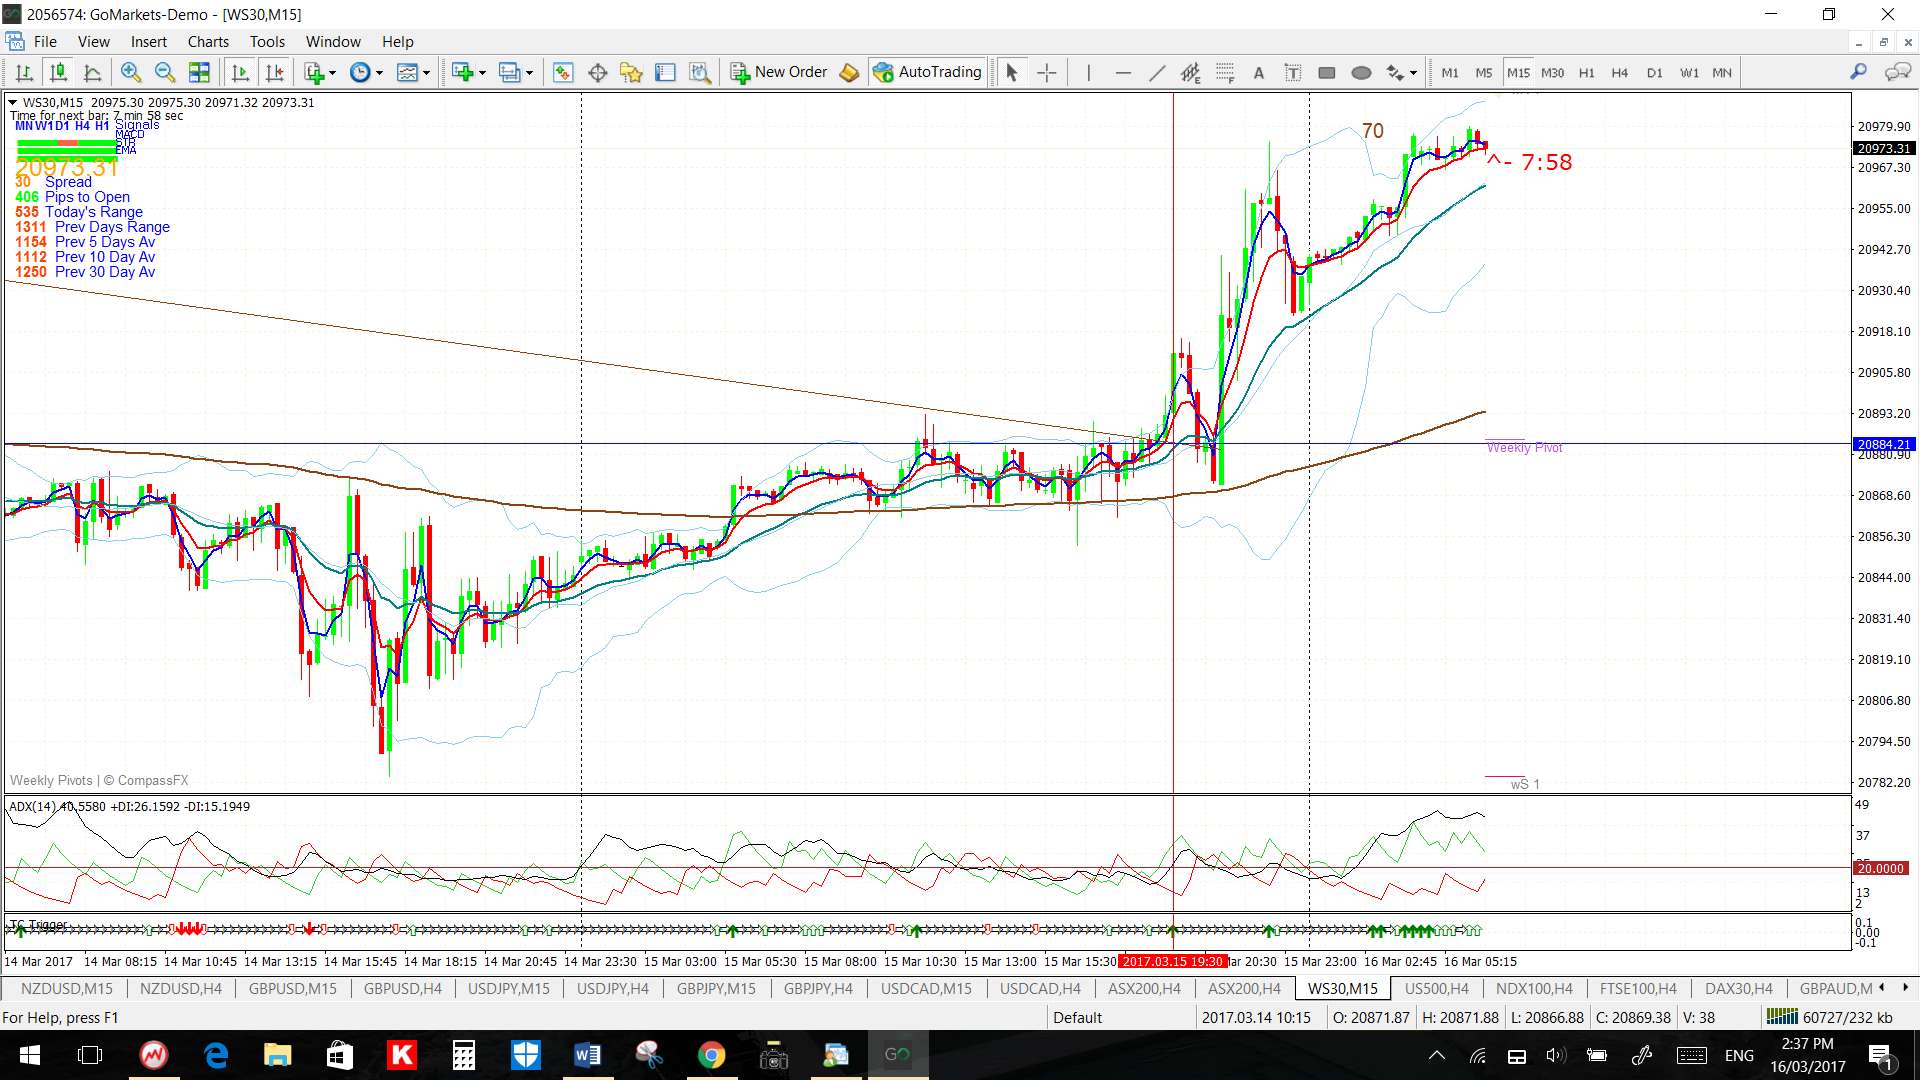
DJIA: gave a 70 point breakout move after consolidating for three weeks and note how the 15 min chart gave a new TC signal right on the trend line break:
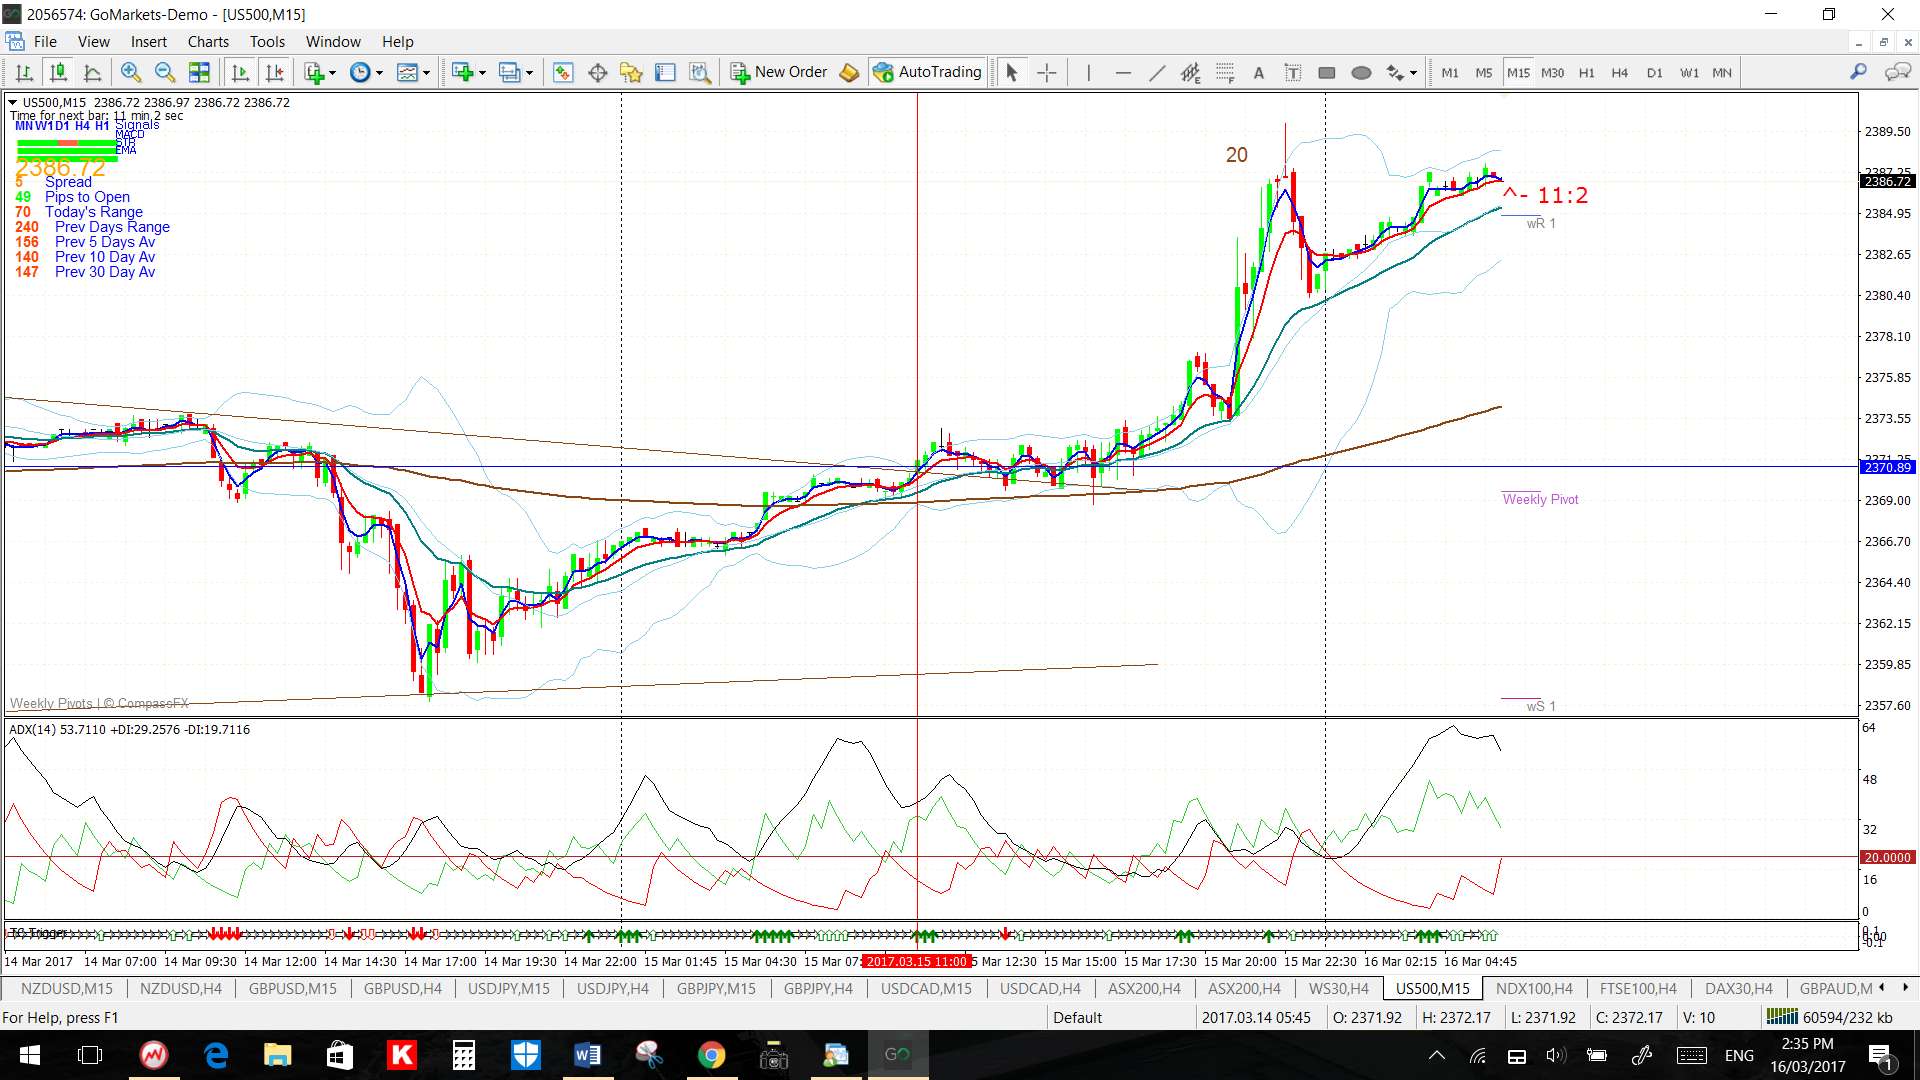
S&P500: gave a 20 point breakout move also after consolidating for three weeks and note how the 15 min chart gave a new TC signal right on the trend line break:

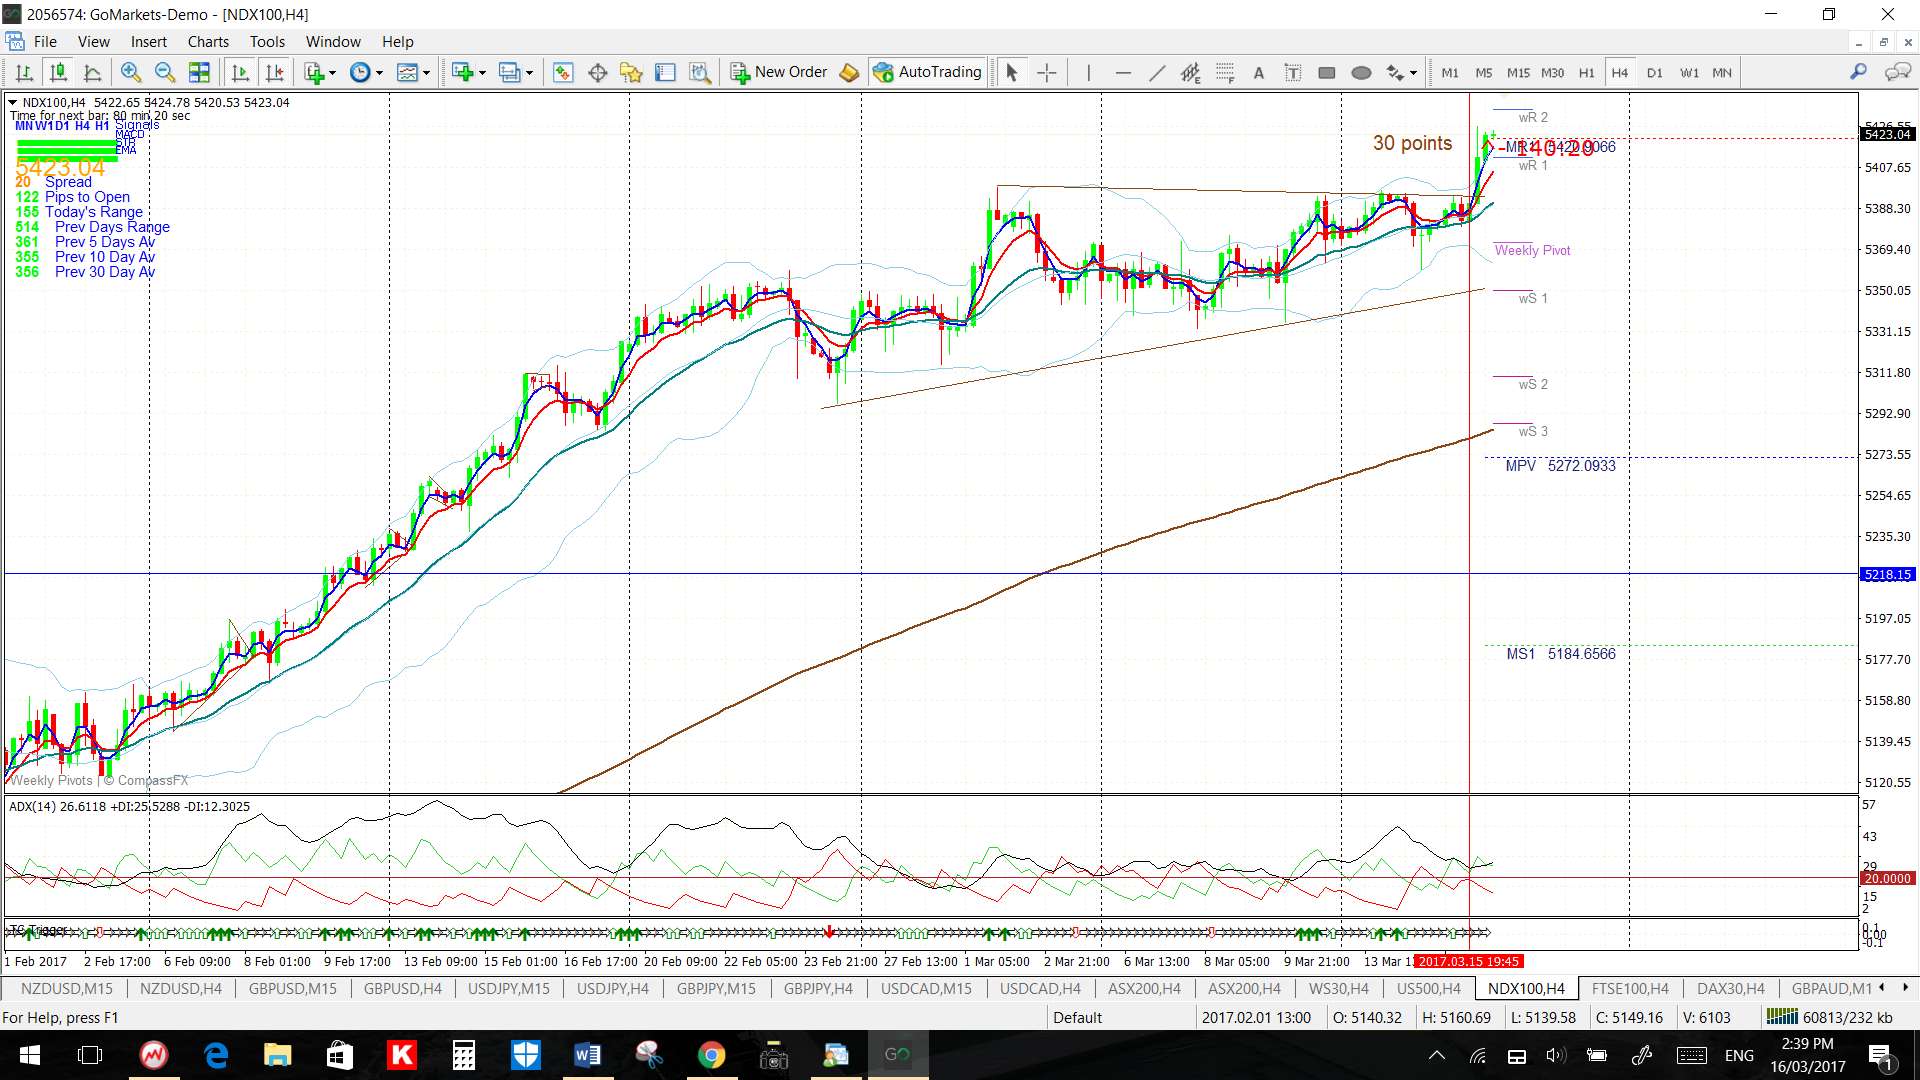
NASDAQ: this, too, gave a 30 point breakout move after consolidating for three weeks and note how the 15 min chart gave a new TC signal right on the trend line break:
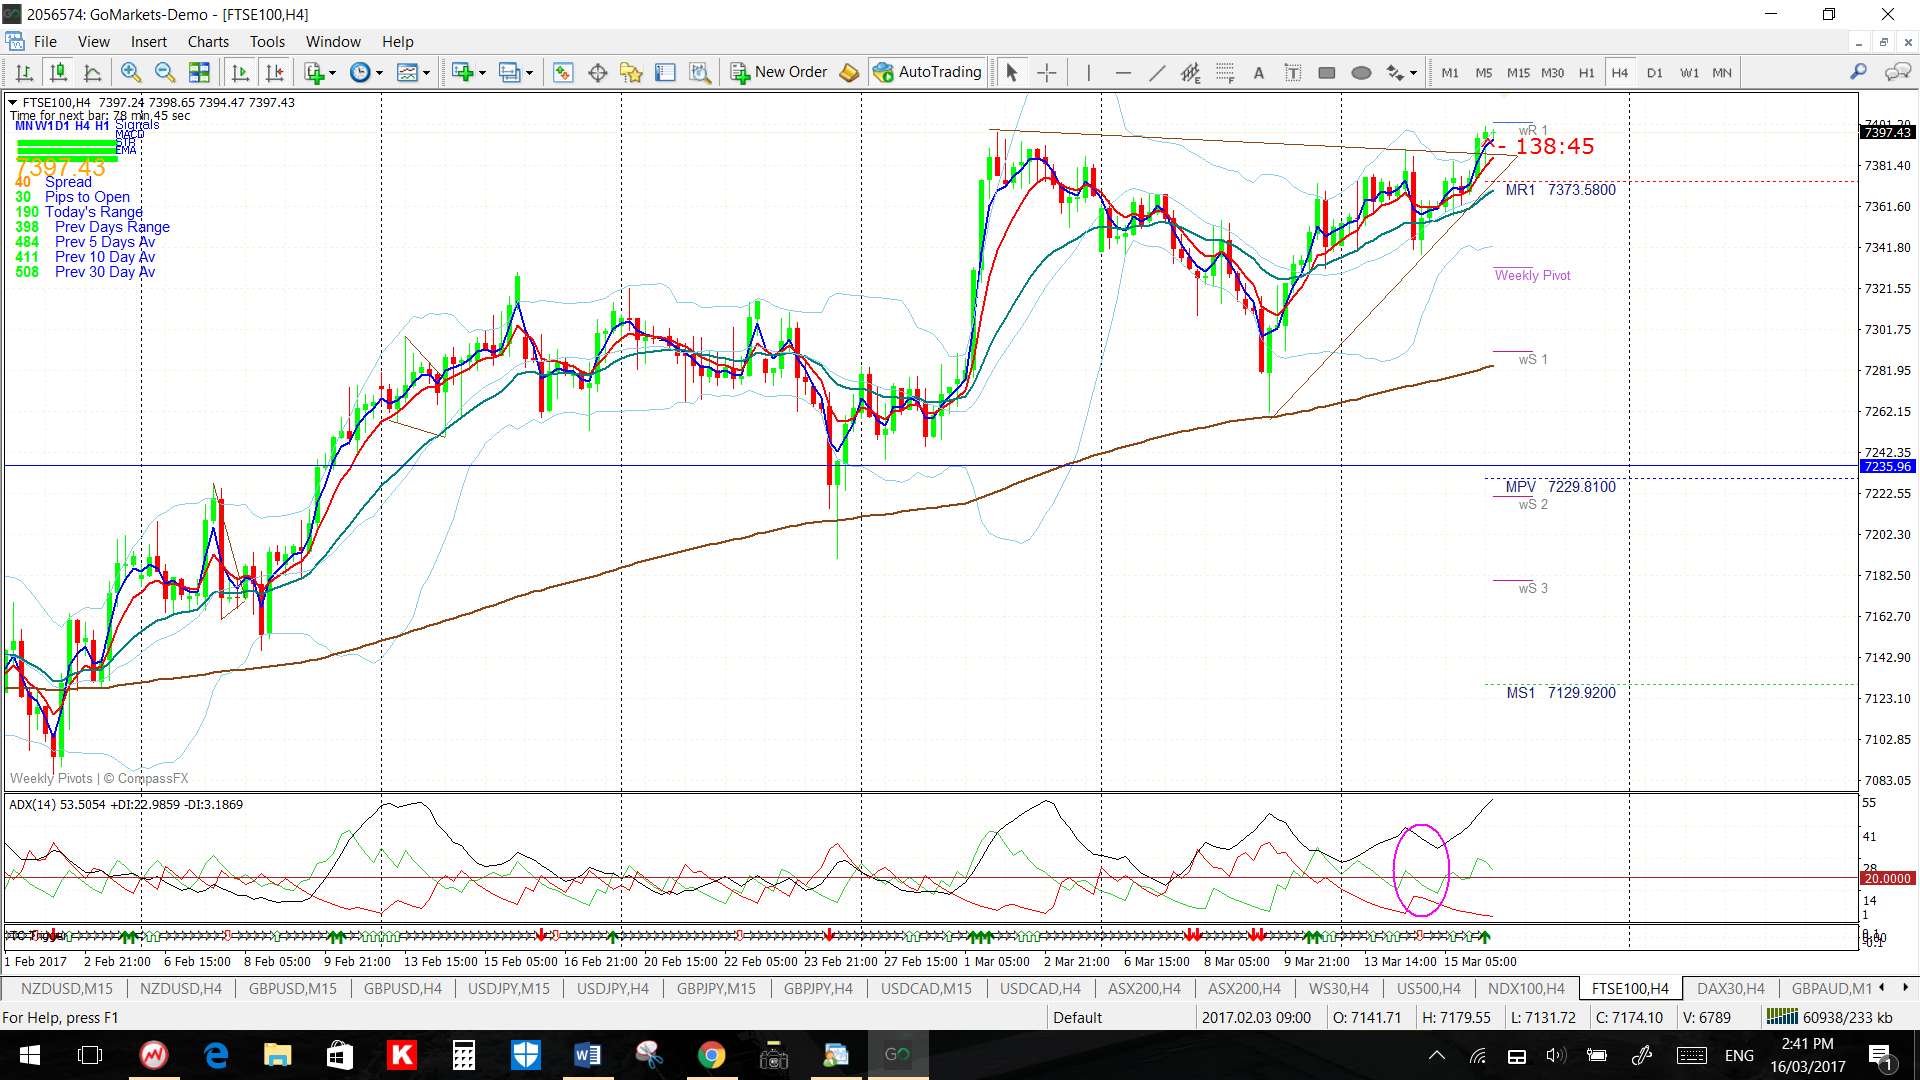
FTSE: the move might just be getting going?
DAX: gave a 45 point breakout move after consolidating for three weeks:
